Amazon Is Winning the AI Race in the Cloud. Here’s What Investors Need to Watch Next.
AWS just posted its fastest growth in nearly five years, yet Amazon shares tanked after earnings. The gap between what the cloud numbers are saying and how the market reacted reveals a high-stakes disagreement that could define the stock for…

This post may contain links from our sponsors and affiliates, and Flywheel Publishing may receive compensation for actions taken through them.
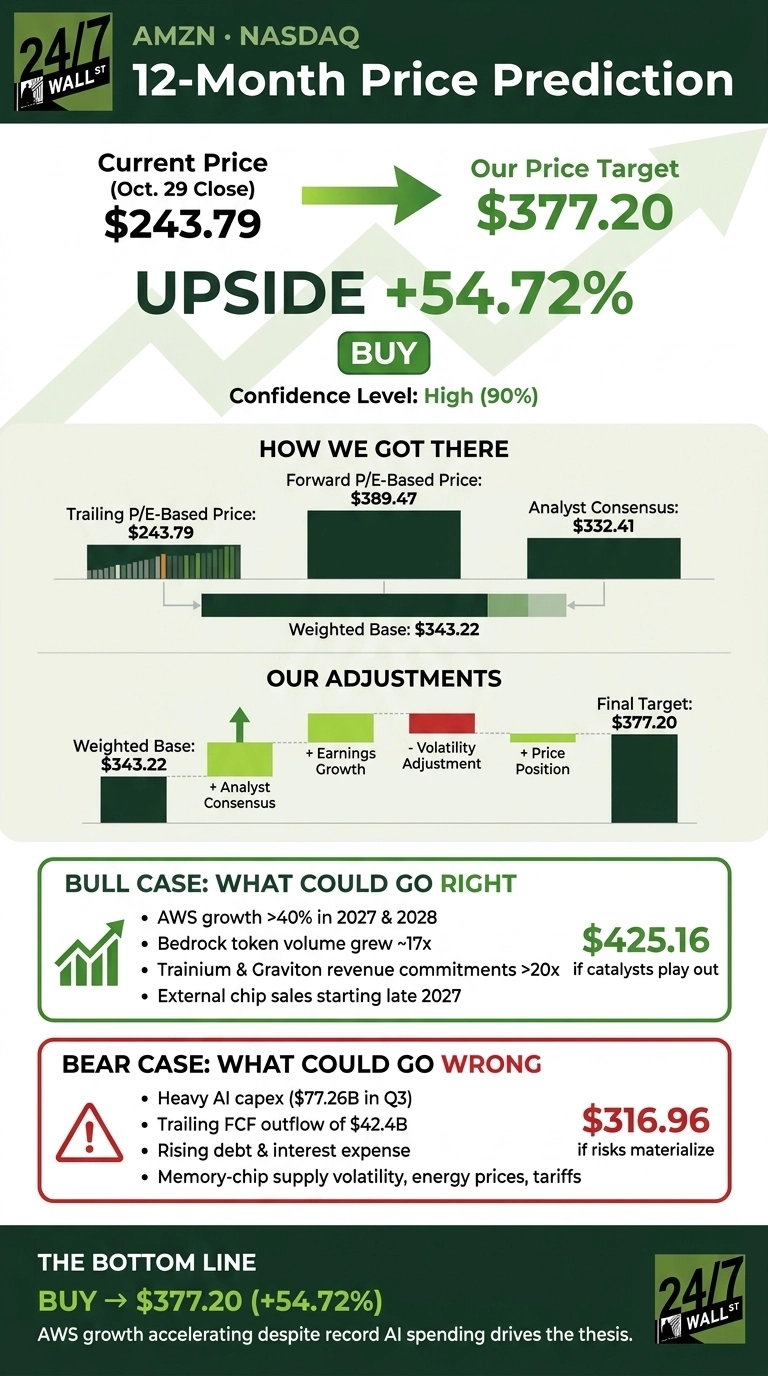
Shares of Amazon (NASDAQ:AMZN | AMZN Price Prediction) closed at $243.79 on October 29. It then fell 6.72% to $227.40 in premarket trading after third-quarter results.
The 24/7 Wall St. price target is $377.20 over the next 12 months. That means 54.72% upside from the close, or about 65.9% from the premarket price. Our rating is buy, with high confidence.
24/7 Wall St. Price Target Summary
| Metric | Value |
|---|---|
| Current Price (Oct. 29 Close) | $243.79 |
| 24/7 Wall St. Price Target | $377.20 |
| Upside | 54.72% |
| Recommendation | BUY |
| Confidence Level | 90% |

I see a gap between the results and the stock’s reaction. AWS growth sped up to 39% and the cloud backlog reached $578 billion. The market is focused on a $220 billion capex plan instead.
AWS Posts Its Fastest Growth in Nearly Five Years as Shares Slide
Shares are down 9.18% over the past week, 7.81% over the past month and 1.48% year to date. At the premarket price, Amazon sits about 20.8% below its 52-week high of $287.20 and 16.0% above its low of $196. CNBC reported the drop as pressure mounting after earnings.
Revenue came in at $201.94 billion, up 12.09%. That was slightly below the $202.20 billion estimate. EPS of $1.89 missed expectations of $1.9579.
Two things distorted the comparison. Prime Day moved into Q2, which cut growth by about 400 basis points, and the year-ago quarter included $9.5 billion of Anthropic gains. Operating income rose 61.15% to $28.08 billion, and the 13.9% operating margin was Amazon’s highest ever.

Why Bulls See $425 in Play
In our bull case, Amazon reaches $425.16. CEO Andy Jassy said AWS can grow “north of 40% in each of 2027 and in 2028” from a $184 billion run rate. Bedrock token volume grew nearly 17 times, and revenue commitments for Trainium and Graviton each rose more than 20 times.
Amazon plans to start selling chips to outside customers in late 2027, and management expects advertising growth in the high teens in Q4. Wall Street largely agrees: 16 analysts rate the stock a strong buy, 43 a buy and only 2 a hold.

Capex Is the Risk Worth Watching
In our bear case, the stock reaches $316.96. Trailing free cash outflow hit $42.4 billion. Q3 capex rose 120.14%, cash fell 16.64%, and management expects to spend much more in 2027. Memory-chip supply, energy prices and tariffs add further risk.
On the other side, operating cash flow grew 19.41%, and AWS operating income rose to $17.77 billion from $11.43 billion. Management also said it has demand visibility through 2027 and 2028.

How Amazon Compares to Microsoft and Alphabet
| Company | P/E | Cloud Unit Growth |
|---|---|---|
| Amazon (AWS) | 34x | 39% |
| Microsoft (Azure) | 29x | 48% |
| Alphabet (Google Cloud) | 13x | 103% |
Microsoft (NASDAQ:MSFT) is AWS’s most direct rival through Azure. Azure revenue reached $33.16 billion, still well short of AWS’s $45.98 billion. Microsoft beat expectations with EPS of $4.89, and its lower multiple supports our view that Amazon’s premium has to be earned through AWS growth.
Alphabet (NASDAQ:GOOGL) competes with Trainium through its TPUs. Google Cloud is growing fastest, but on a $30.71 billion base. Alphabet’s free cash flow was negative $9.07 billion, which shows that heavy AI spending is common across the sector. Compared with these peers, Amazon’s forward P/E of 24x makes the 24/7 Wall St. price target look reasonable.
Amazon Earns a BUY at $377.20
The 24/7 Wall St. price target of $377.20 carries a buy rating with 90% confidence. AWS growth speeding up even as Amazon spends record amounts is the key reason to stay positive.
I’d stay bullish if AWS growth tops 40% in 2027. Capex climbing without margins expanding would make me cautious. For now, the weak reaction to earnings looks like a mispricing.
| Year | 24/7 Wall St. Price Target |
|---|---|
| 2026 | $256.44 |
| 2027 | $373.89 |
| 2028 | $518.19 |
| 2029 | $628.11 |
| 2030 | $736.52 |
Amazon’s current strategy supports these projections. Big moves in either direction could come from how quickly AI capex turns into returns and whether Trainium’s outside sales succeed. All of that data-center spending has to be powered and cooled by someone, and we covered seven of those suppliers in a free report here.
Contact [email protected] for any questions or corrections.
Vandita Jadeja is a financial publisher with over a decade of experience writing about financial topics, including investment, savings, retirement, insurance and banking. Vandita is a Chartered Accountant who loves to debunk financial concepts for readers.
Her work has appeared on sites that include The Motley Fool, InvestorPlace, and Benzinga. She covers investing and focuses on stock picks and price prediction for 24/7 Wall St.
When not looking for the next stock investment opportunity, she can be found traveling, reading, chasing sunsets and enjoying her iced latte.