Jim Cramer Says the Fed “Doesn’t Need to Do More Than 25”

This post may contain links from our sponsors and affiliates, and Flywheel Publishing may receive compensation for actions taken through them.

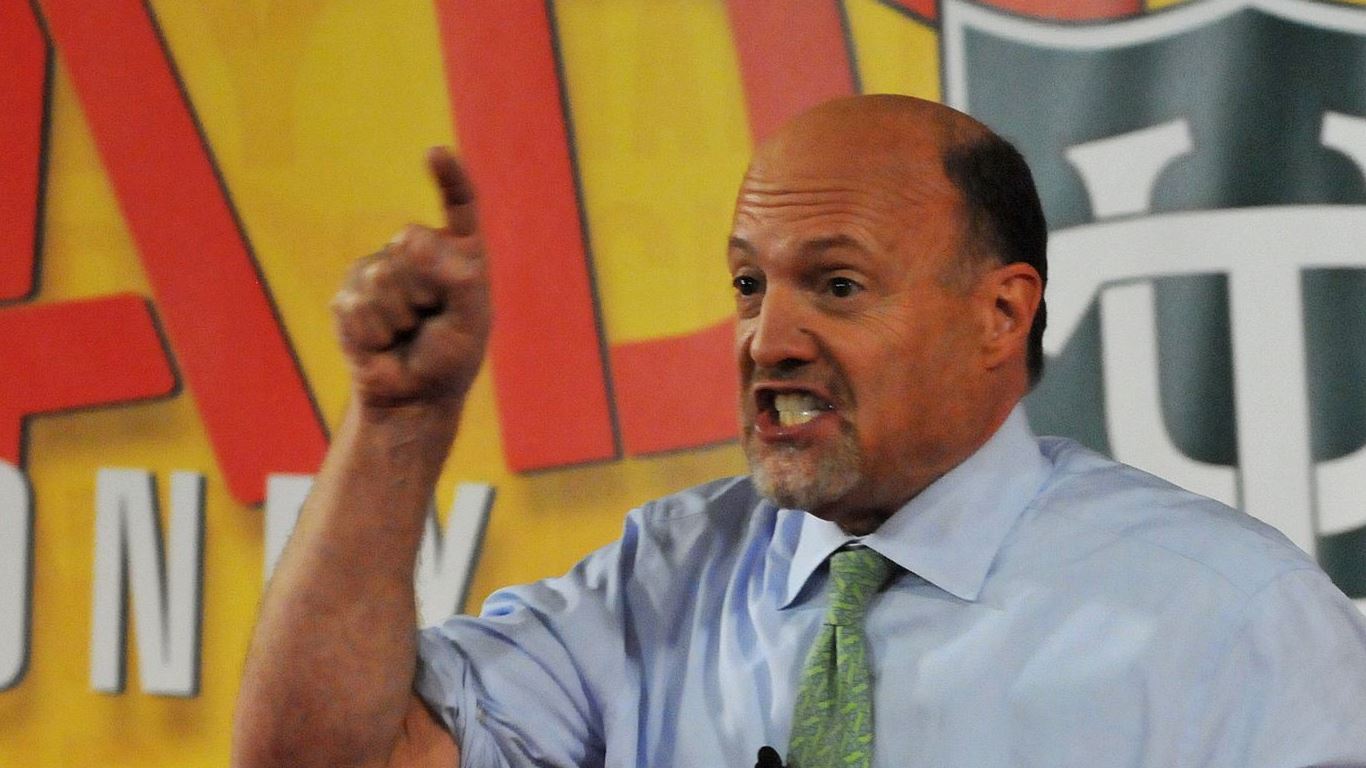
Jim Cramer used his X account on November 20, 2026, to weigh in on how hard the Federal Reserve should push. He wrote: “Here’s the real economy; oil is embedded and really hurting the CPI. The Fed doesn’t need to do more than 25; its point is being made.” He went on to argue that copper, still a key material for data centers, can’t keep sliding like this if the economy is heading into an inflation-driven Fed boom. Then he closed with: “Now oil must come down.”
The timing matters. Minutes released this week showed Fed officials saw higher interest rates needed in December as inflation worries mount. Governor Christopher Waller said the central bank may need to ‘shock people’ with a half-point rate hike, and Governor Lisa Cook said rate hikes are needed to lower high inflation. Cramer’s post puts him on the smaller side of that debate.
What “25” Means and Why Oil Sits at the Center
“25” means 25 basis points, or a quarter of a percentage point. The Fed typically moves in 25-basis-point increments.[1] As of November 20, 2026[1], the upper bound of the federal funds target sat at 4.00%, where it has held since at least October 22.
When Cramer says oil is “embedded,” he means energy costs have moved past the gas pump and into trucking, airfares, manufacturing, and food. Once businesses build those costs into what they charge, they get harder to undo. West Texas Intermediate crude was $57.21 on January 2, 2026, then peaked at $114.58 on April 7 and was back at $110.01 on October 19. Even after easing, the $89.53[2] reading on November 17 was up about 56.5% since early January.
The Consumer Price Index for October 2026 came in at 337.511, up about 0.17% from September. The September index stood roughly 3.7% above its year-earlier level.
Oil Has Already Started Falling
Cramer wants lower oil, and prices have started moving his way. WTI fell from $107.56 on October 30 to $89.53[2]. Regular gasoline averaged $3.81[3] a gallon on November 16, down 12.1% in a month. The 10-year Treasury yield slipped to 5.04%[4] on November 19 after topping out at 5.31% on October 5.
His copper point ties to AI infrastructure. A Colorado General Assembly report mentions research calling data centers the largest driver of U.S. electricity demand, and that expansion runs on copper wiring and grid equipment.
What a Quarter-Point Hike Means for Retirees and Savers
Savings yields: Financial advisor Wes Moss noted on The Clark Howard Podcast that savings account rates follow the Fed closely: “The day rates change or the day oil changes is the day gas prices change.” A quarter-point rise would push savings and CD yields up a little. A half-point rise would push them up more.
Bonds: Bond prices move opposite to yields, so a smaller rise puts less pressure on bonds people already own. Moss calls starting yields destiny: “the starting yield of the bonds you are buying into… typically is your longer term rate of return.” With the 10-year near 5.04%[4], retirees can already lock in rates that look solid by recent standards (we made the case for an income-first withdrawal plan at yields like these in a free guide).
Dividend stocks: Dividend payers have to compete with safe yields. Each extra Fed rise makes Treasuries and CDs more attractive next to utilities and consumer staples so that a smaller move would ease that pressure.
Counterpoint: Inflation Is Still Running Hot
The Fed’s preferred gauge, core PCE, rose 0.3%[5] in September 2026, and that measure strips out energy entirely. The Fed targets 2%[5]. Oil also fell from $107.02 on September 15 to $85.23 ten days later, then climbed back above $100 in October. If prices bounce again, a single quarter-point rise may not be enough, and hawks like Waller want to head off that risk.
Next up: the November CPI release, whether WTI holds below $90, and the Fed’s next statement on its FOMC calendar page. Cramer’s case depends on oil continuing to cool.
Contact [email protected] for any questions or corrections.
Chris Lange is a financial and geopolitical writer with more than a decade of experience covering a myriad of topics. He has published thousands of articles for 24/7 Wall St., with past coverage focused heavily on stocks, IPOs, healthcare, defense, global affairs, and technology.
His work has been quoted, or referenced by a number of outlets including Business Insider, USA Today, Yahoo Finance, MSN, The Motley Fool, and many other publications. A graduate of Southwestern University, he studied business with a focus on investments and has previous experience in banking and startups.
When not reading or writing the news, he is following his passion for Lacrosse, playing chess, or building solar projects with his dad.