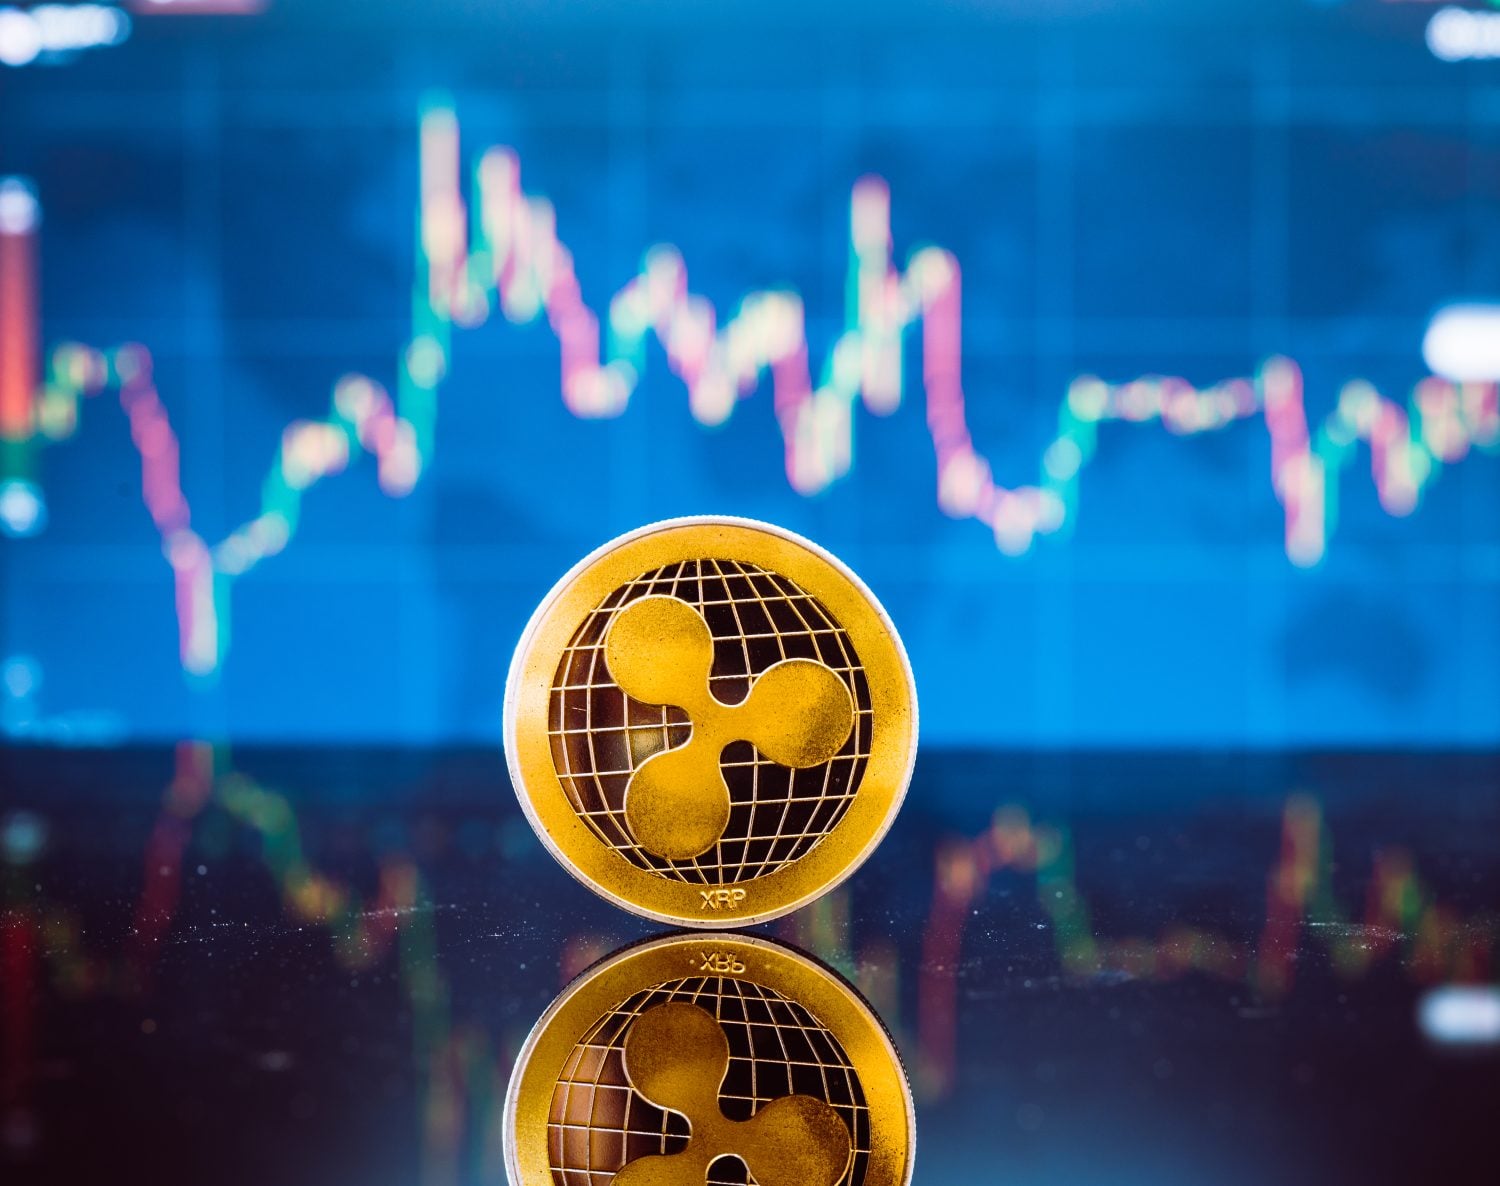
The XRP (CRYPTO:XRP) price recently slid to a 15-week low and trades around $1.15, down roughly 40% this year. The current crypto market selloff has pushed XRP’s monthly RSI—a momentum gauge that smooths price action over whole months—down to about 41.6. That’s one of the lowest readings in XRP’s history, and a zone it has reached only four times in 13 years.
Every other time the XRP price reached this level, a big rally followed within a year or two. So is this the cycle-bottom signal bulls think it is, or is 2026 different?
XRP’s Monthly RSI Just Hit a New Low
XRP’s daily RSI drops into oversold territory all the time, so that alone means little. The monthly reading is different, and it has only dipped into this zone in early 2017, March 2020, June 2022, and now in 2026.
Each of those three moments turned out to be a cycle bottom. After the January 2017 reading, when XRP traded under a penny, it ran to its record near $3.84 by early 2018. After March 2020, with XRP near $0.11, it climbed about 1,600% to $1.96 by April 2021. And after June 2022, around $0.29, it eventually pushed past $3 by January 2025.
That track record is why XRP bulls are treating the current reading as a buy signal. The pattern appears to be forming, but the setup around it has changed a lot since those earlier bottoms.
Why This Time Is Different for XRP
The earlier huge percentages came off much lower starting prices. XRP was under a penny in 2017, so its run to $3.84 was a five-figure percentage gain. The same percentage gain from $1.15 today would put the XRP price in the hundreds of dollars, which isn’t happening this cycle.
There’s also the reading itself. At 41.6, the monthly RSI is lower than it has ever been, below even its March 2020 record. That makes this uncharted territory rather than a proper repeat. The June monthly candle hasn’t even closed yet, so if the XRP price bounces back above $1.30, the final reading would change and the record could fade.
Now, XRP is a very different asset than it was at those earlier bottoms. It has spot ETFs, a March ruling from the SEC and CFTC that classified it as a digital commodity, and the CLARITY Act moving through the Senate. It is also bottoming near $1 instead of a few cents, so the support under it is far stronger than in 2017 or 2020. A recovery from here could be sturdier, even if the percentage upside is smaller.
What the RSI Signal Could Mean for the XRP Price
So what’s a realistic XRP price target if the pattern holds? Reclaiming the $3.65 cycle high over the next year or two would be roughly a 3x from here, and that’s a believable outcome if the broader market sentiment turns. Getting to $5 or beyond would need the CLARITY Act to pass and ETF demand to actually grow, not just the RSI bouncing.
Some analysts are throwing out much bigger numbers, like $14, $20, or even $50, based on long-term channel projections. But XRP at $20 would be a $1.2 trillion asset, roughly the size of Bitcoin’s entire market cap today. So, it’s best to view those targets as the most bullish end of the range.
Moreover, none of this is confirmed yet. A monthly RSI signal plays out over months and a full cycle, so oversold can stay oversold while the rest of crypto keeps falling. The better signal would be a monthly close that turns the RSI back up, Bitcoin holding above $60,000, and the CLARITY Act getting its Senate floor vote before the August recess.
Should XRP Holders Trust the RSI Signal?
The signal is worth respecting. XRP has never hit this monthly RSI zone without a major rally following at some point, and that’s a track record we just can’t ignore. But respecting it means expecting a cycle recovery, not another 60,000% moonshot like 2017.
If you hold XRP, the other lesson in that track record is patience. The 2020 signal needed about a year before XRP hit $1.96, and the 2022 one took roughly two and a half years to push past $3. So even if this bottom is in, the rally that follows could take until 2027 to fully develop, and a flat XRP price through the summer wouldn’t break the pattern.