Litecoin Fell 21% in a Month, Over 4 Times Bitcoin’s Drop. Can It Get Back to $70?
Litecoin is bleeding out faster than nearly every major crypto, and the road back to $70 depends on a chain of events that has yet to even begin. Here is what traders are watching and what happens if it all…

This post may contain links from our sponsors and affiliates, and Flywheel Publishing may receive compensation for actions taken through them.

Litecoin (CRYPTO:LTC) is priced at $56.65, following a drop of 20.5% over the past month. In comparison, Bitcoin (CRYPTO:BTC) saw a much smaller decline of just 4.6%. That means Litecoin’s fall was more than four times as steep. LTC hit a low of $56.66 on October 25, putting it near the bottom of its monthly range.
Traders are focused on the $70 mark because Litecoin traded there in September 2026. The coin started the month at $71.27 on September 27, just one day after reaching a 90-day high of $72.55. To reach $70 again, Litecoin would need to gain 23.6% from its current price.
What a $70 Litecoin Would Be Worth

Litecoin’s market cap, which represents the total value of all coins in circulation, was $4.40 billion on October 27, placing it 26th among cryptocurrencies. A price of $70 would bring LTC back close to its late-September valuation.
Historically, $70 is a modest target for Litecoin. The coin opened 2026 at $76.69 and reached $99.38. Its all-time high was $410.26 on May 9, 2021, and it trades 86.2% below that peak.
However, Litecoin’s increasing supply challenges long-term investors. Miners continuously create new Litecoins with each block, which keeps the circulating supply rising. That means a $70 price implies a larger market cap than it did in previous cycles, making LTC look cheaper on older price charts than it is now.
Spot Litecoin ETF Demand Has Thinned Out as the Price Fell

Spot ETFs are funds that directly hold Litecoin and trade on stock exchanges. Net inflow is new money coming in minus money going out. U.S. spot Litecoin ETFs recorded net inflows on only a few sessions between September 28 and October 26. They took in $1.18 million on September 28, $1.45 million on September 30, $482,142 on October 7, and $581,140 on October 19. On other days, the inflows were zero.
As of October 26, the funds held $13.02 million in net assets, with total net inflows of $16.88 million. In contrast, U.S. spot Bitcoin ETFs attracted $110.34 million on just one day. Litecoin’s largest inflow days came at the end of September, while LTC still traded near $71. Buying interest fell as the price did.
Bitcoin’s Own Recovery Could Pull Litecoin Higher
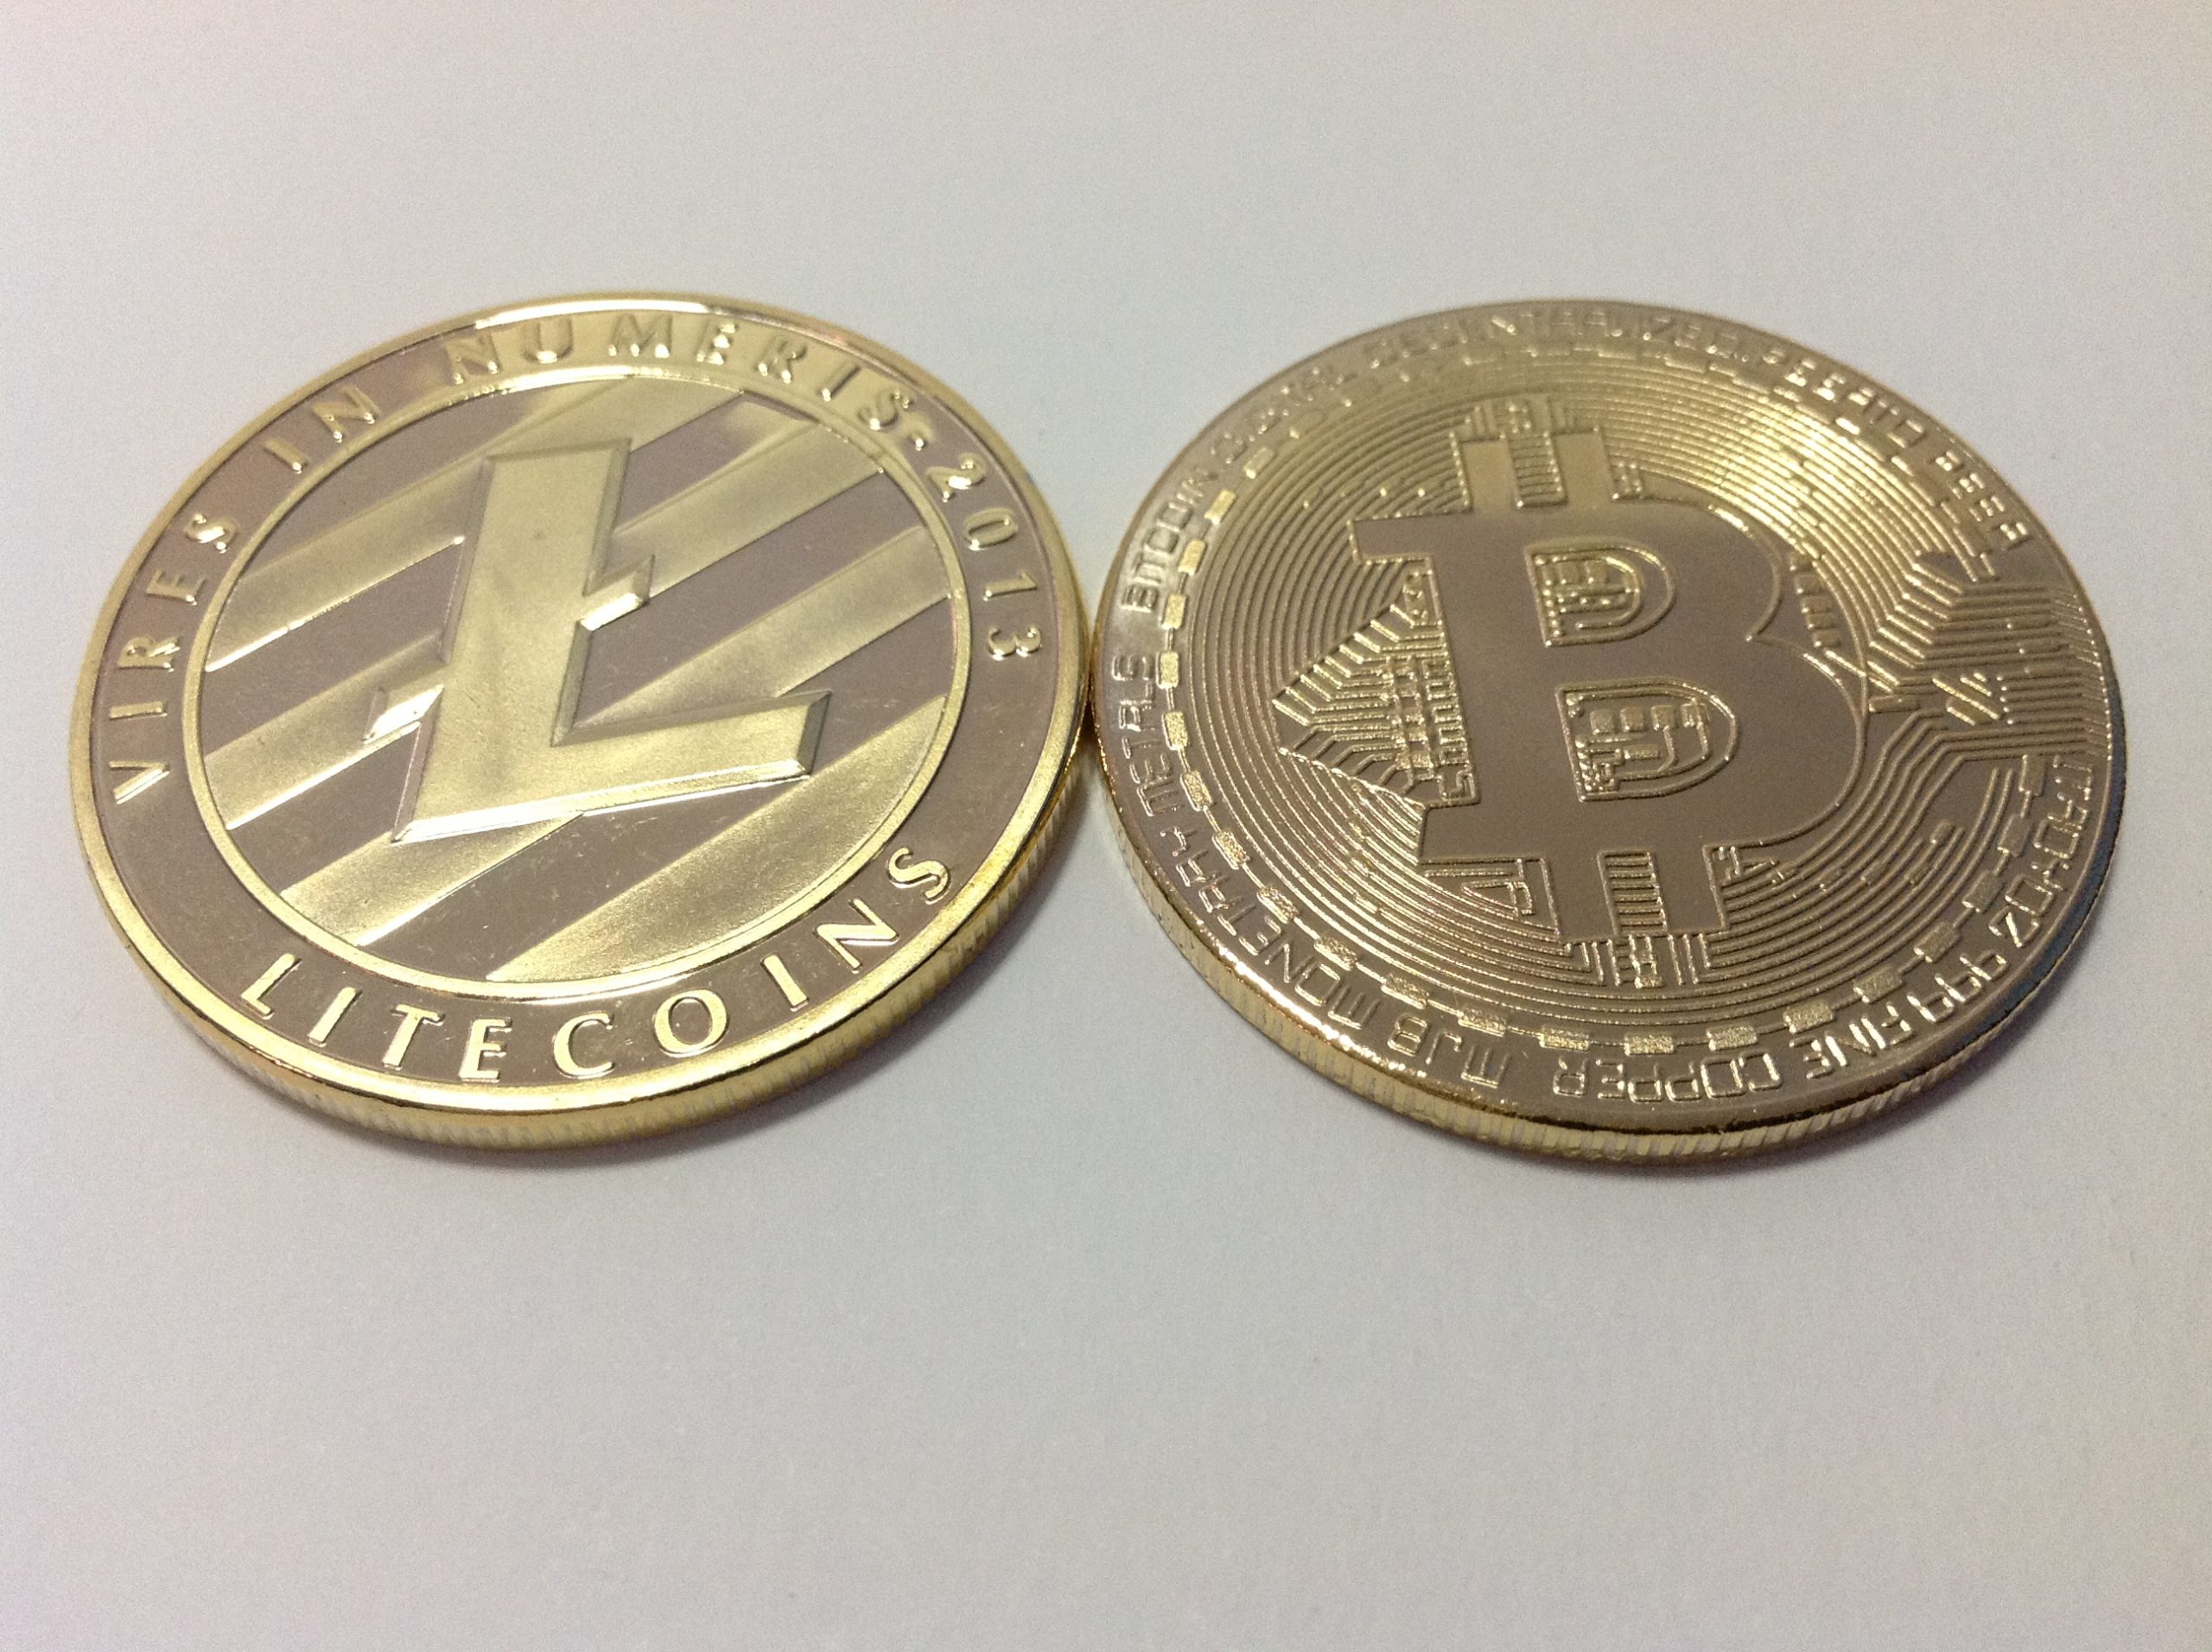
The LTC/BTC ratio shows how much Bitcoin one Litecoin can buy. The ratio stands at about 0.000702, which highlights Litecoin’s struggle against Bitcoin. Over the past month, Ethereum (CRYPTO:ETH) fell 13.6%, and XRP (CRYPTO:XRP) dropped 13.8%, both performing better than Litecoin, which suggests investors are shifting toward larger cryptocurrencies.
Litecoin’s earlier rise shows Bitcoin’s influence. Bitcoin jumped from a 90-day low of $62,773 on August 1 to $86,597 on September 21. During that period, LTC surged from $43.81 on August 14 to a peak of $72.55. Bitcoin trades at $80,684, just below its 20-day average of $81,999 and its 50-day average of $81,806.
Litecoin Needs to Reclaim Key Moving Averages to Recover

Moving averages help traders assess market trends by averaging closing prices over a certain number of days. LTC trades below its 20-day average of $60.50 and 50-day average of $61.34, meaning recent buyers are at a loss. However, it still holds above its 200-day average of $52.11, maintaining the longer-term uptrend since the June 2026 low of $40.87.
Can Litecoin Reach $70 by the End of 2026?
It appears unlikely that Litecoin will hit $70 before the end of December 2026. Several conditions would need to be met, in this order.
- Bitcoin must regain its 20-day average of $81,999, since past LTC rallies have followed Bitcoin’s increases.
- LTC needs to close above its 50-day average of $61.34. Until this happens, the conversation around $70 remains speculative.
- Spot Litecoin ETFs must record net inflows on consecutive days. Since late September, inflow days have not come consistently.
Even with these improvements, sellers who bought near the $72.55 high in September may prevent any rally from reaching $70, creating resistance in that price range where sell pressure tends to accumulate.
If Bitcoin continues to decline and ETF demand remains stagnant, the critical level to monitor is the 200-day average at $52.11. A daily close below this level would bring the August 2026 low of $43.81 back into focus. For LTC holders, this level may matter more in the coming weeks than the $70 target.
Contact [email protected] for any questions or corrections.
Sam Daodu is a crypto analyst and the editor of 24/7 Wall St.'s Crypto Desk, where he covers Bitcoin, XRP, Ethereum, Solana and the altcoins investors search for most. His work focuses on price levels, spot ETF flows, on-chain data and the regulatory decisions that move crypto markets, written so a first-time buyer and a seasoned trader can both use it.
Sam has written about crypto professionally since 2019 and has published more than 2,000 articles. Before joining 24/7 Wall St., he wrote for crypto media outlets and Web3 companies and ghostwrote for crypto founders and token launches. His analysis is syndicated on Yahoo Finance, MSN and AOL and has been cited by other crypto news sites. He also founded MacLabs Marketing, a content and personal branding agency for crypto founders and executives.
When he isn't reading charts, Sam is usually at the gym or watching One Piece, a series he maintains has better tokenomics than most altcoins.