How Much Walmart’s 90-Day Slide Hit Top Consumer Staples ETFs
Walmart's summer slide cut differently through FSTA, XLP, and VDC depending on how much each fund actually owns, and the gap between them is bigger than most investors assume.


The Walmart (NASDAQ:WMT | WMT Price Prediction) pullback is the story consumer staples investors are talking about this summer, and it flows through Fidelity MSCI Consumer Staples Index ETF (NYSEARCA:FSTA), Consumer Staples Select Sector SPDR Fund (NYSEARCA:XLP), and Vanguard Consumer Staples Index Fund (NYSEARCA:VDC) in surprisingly different ways. Walmart shares have fallen roughly 14% over the past 90 days, from about $130 on May 7 to about $112 on August 6. Zooming out, however, the picture changes: Walmart is up fractionally year to date, up 9% over the past year, and up 132% over five years. This looks like a drawdown inside a longer uptrend.
Walmart’s Q1 FY27 report reiterated guidance rather than raising it. The company delivered revenue of $177.8 billion, up 6.1% year over year, but flagged an approximately 700-basis-point headwind in Health & Wellness from Maximum Fair Pricing legislation and ongoing IEEPA tariff uncertainty. Meanwhile, the latest University of Michigan Consumer Sentiment Index reading is 55.2, rebounding from June’s multi-year low of 49.5. That is the macro to watch: the Bureau of Labor Statistics Consumer Price Index (CPI) print and the monthly Census retail sales release are the two data feeds most likely to move staples over the next 12 months.
FSTA: The Most Concentrated Walmart Exposure of the Three
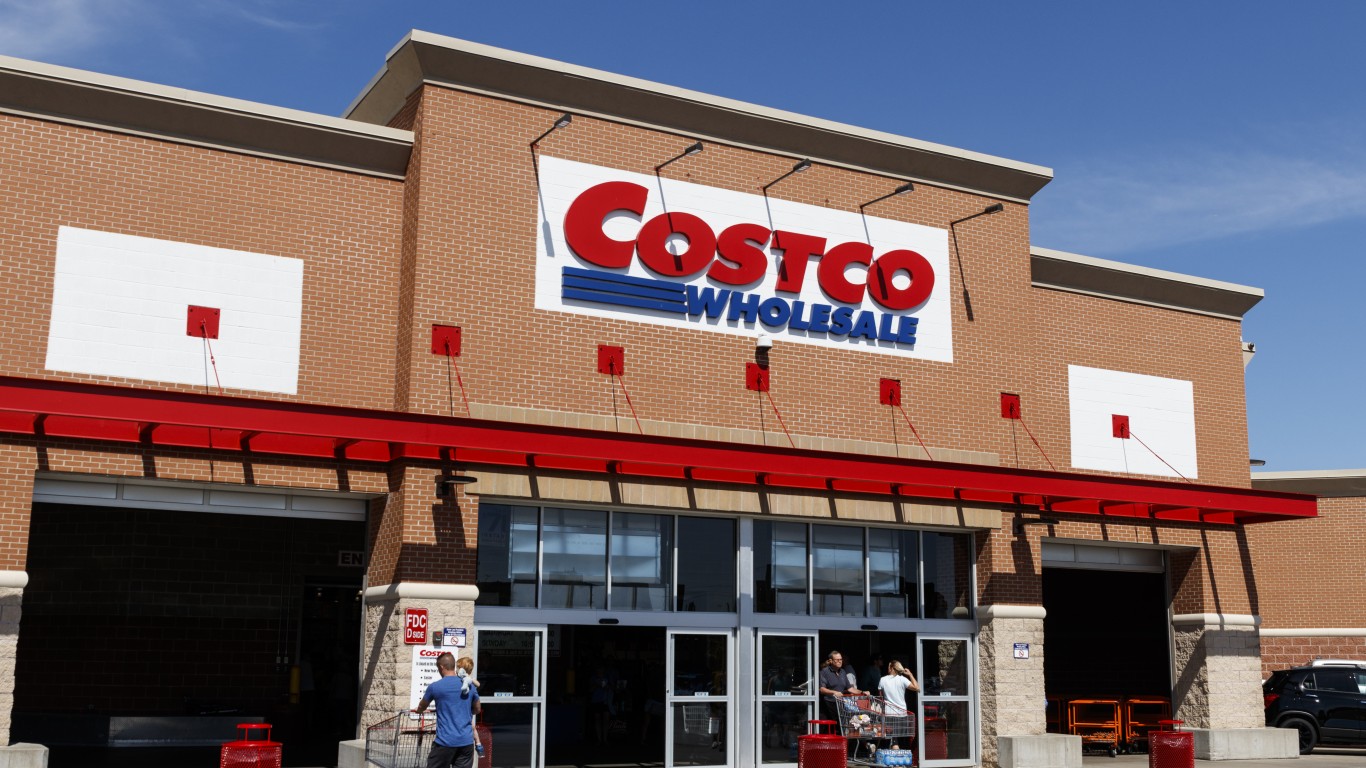
FSTA tracks the MSCI USA IMI Consumer Staples 25/50 Index, which sweeps in small- and mid-caps alongside the giants. Its net expense ratio is 0.08%. That broader mandate has produced the heaviest Walmart weight in the group: Walmart is the top holding at 13.4% of net assets, worth about $190.0 million out of $1.4 billion in total net assets. Costco follows at 11.4%, so nearly 25% of FSTA lives in two big-box retailers. The fund is holding up (8.7% year to date) because Coca-Cola, Procter & Gamble, and the tobacco names have offset Walmart’s drag.
XLP: Narrower Index, Lighter Walmart Weight
XLP holds only the S&P 500 staples subset (about 38 names) and carries a net expense ratio of 0.09%. Walmart is still the top holding, but at a lower weight of 10.4%, followed by Costco at 9.0% and Coca-Cola at 7.2%. Because XLP has a smaller Walmart slice than FSTA despite being the more concentrated index, a single-name Walmart move actually transmits less on a percentage basis here. XLP is nearly flat on the week and up 9.6% year to date, roughly in line with peers.
VDC: Vanguard’s Broad-Basket Staples Vehicle
VDC tracks the MSCI US Investable Market Consumer Staples 25/50 Index, structurally similar to FSTA. Its net expense ratio is 0.09%. Walmart is a top holding at 14.0%, or about $1.1 billion of the fund’s net assets. VDC is also roughly flat on the week, up 1.1% on the month, and up 9.3% year to date. The tight clustering with FSTA and XLP year to date shows that even with different Walmart concentrations, diversification across roughly 100 staples names smooths out single-stock damage.
What to Watch Next
As mentioned, the macro signals to monitor are the next Census retail sales release and CPI print, given that June retail sales hit $768.6 billion, a 12-month high, and a rollover would confirm the sentiment weakness. The fund-specific signals are the next quarterly MSCI reviews for FSTA and VDC, and the S&P Dow Jones sector rebalance for XLP. If Walmart’s slide continues into the next reconstitution, FSTA’s 13.4% Walmart weight is the position with the most concentrated exposure to further downside, and the one with the most upside if the $137.98 analyst target price starts to come back into view.

Contact [email protected] for any questions or corrections.
Trey has been an editor and author at 24/7 Wall St. for more than a decade, where he has published thousands of articles analyzing corporate earnings, dividend stocks, short interest, insider buying, private equity, and market trends. His comprehensive coverage spans the full spectrum of financial markets, from blue-chip stalwarts to emerging growth companies.
Beyond 24/7 Wall St., Trey has created and edited financial content for Benzinga and AOL's BloggingStocks, contributing additional hundreds of articles to the investment community.
Trey's editorial expertise extends across multiple publishing environments. He served as production editor at Dearborn Financial Publishing and development editor at Kaplan, where he helped shape financial education materials. Earlier in his career, he worked as a writer-producer at SVE. His freelance editing portfolio includes work for prestigious clients such as Sage Publications, Rand McNally, the Institute for Supply Management, the American Library Association, Eggplant Literary Productions, and Spiegel.
Outside of financial journalism, Trey writes fiction and has been an active member of the writing community for years, moderating workshop sessions at regional conventions.