How Much of Your Portfolio Should Actually Be in DRAM
The Roundhill Memory ETF has roughly doubled since April, making it one of the fastest-gaining thematic funds in recent memory. Before you chase that return, there is a sizing question that could protect your retirement or quietly wreck it.


The Roundhill Memory ETF (CBOE:DRAM) has done something unusual for a thematic fund launched in April: it has roughly doubled in under five months. From its inception on April 2, 2026, DRAM has climbed about 107% to about $58, riding an AI-driven memory upcycle. For a retirement-focused investor, the real question is how much of a portfolio should sit in a fund this concentrated, this new, and this cyclical.
What You Are Actually Buying
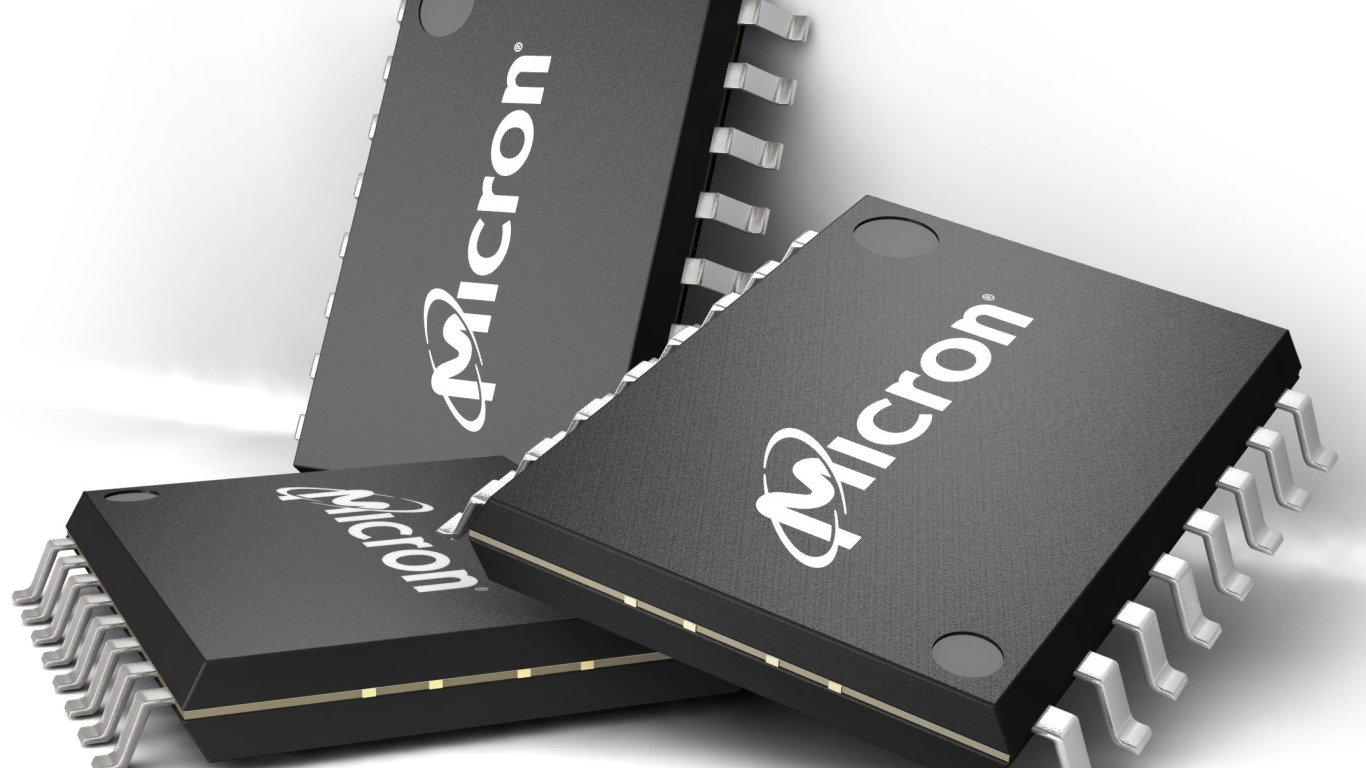
DRAM is a narrow bet on global memory chipmakers, weighted toward the three companies that dominate DRAM and NAND production. The top three positions, Samsung Electronics at 25%, SK hynix at 24%, and Micron Technology at 24%, account for roughly three-quarters of the fund. Storage names like Kioxia, Sandisk, Western Digital, and Seagate fill most of the rest, with small Taiwanese positions in Nanya Technology and Winbond.
Geography matters here. South Korea makes up roughly 49% of the fund, the U.S. 38%, Taiwan 6%, and Japan 5%. Sector exposure is essentially pure tech at 98% Information Technology. The expense ratio runs 0.65%, in line with other thematic funds but well above broad semiconductor ETFs.
Does the Concentrated Bet Pay Off?
Since DRAM launched, it has outrun broader benchmarks by a wide margin, but the comparison window is short. Over the past year, iShares Semiconductor ETF (SOXX) returned about 115%, essentially matching DRAM’s launch-to-date gain while offering exposure to logic, equipment, and design names as well. Vanguard Total Stock Market ETF (VTI) rose about 20% over the same year. The narrow memory tilt has amplified an already strong chip cycle.
The catch: memory is the most cyclical corner of semiconductors. Spot DRAM and NAND prices swing hard, and the last downcycle sent Micron to an operating loss. A fund with 73% of assets in three memory pure-plays will draw down harder than NASDAQ:SOXX when pricing rolls over.
Three Tradeoffs Retirees Should Price In
- Overlap with what you already own. If your core holdings include NYSEARCA:VTI, an S&P 500 fund, or SOXX, you already own Micron, and SOXX holders own Western Digital and Seagate too. Adding DRAM stacks concentrated bets on positions you have exposure to elsewhere.
- Trading hours and tax friction. Nearly half the portfolio trades in Seoul. New York-hours price discovery happens through ADRs and the ETF’s arbitrage mechanism, which can widen premiums and discounts on volatile days. Foreign dividend withholding and the fund’s expected high turnover also argue for holding DRAM in a tax-advantaged account rather than a taxable brokerage.
- A trading record measured in months. With only 97 trading days available, there is no full memory cycle in the data. Reddit sentiment reflects that speculative flavor, with wallstreetbets sentiment scores of 82 in early August and one popular post titled "Is the memory trade dead? I’m buying SNDK and DRAM etf".
A Sizing Framework That Respects the Risk
DRAM belongs in the satellite sleeve. For a retirement-focused investor with a diversified equity base, a workable ceiling is 1% to 3% of total portfolio value, funded from an existing tech or thematic allocation rather than from bonds or broad index holdings. Investors who already own SOXX or SMH should count that exposure first and likely stay at the low end, since Micron, Western Digital, and Seagate already sit inside those funds.
Anyone drawing income within five years, or who cannot stomach a 40% to 50% drawdown in a single position, should look elsewhere. The first years of withdrawals do disproportionate damage to a plan, which is why we built a free guide around defending them (you can grab it here). Broad semiconductor funds capture most of the AI memory upside with a more forgiving ride, and a total-market fund captures it more cheaply still. DRAM earns a slot only for investors who want a deliberate, sized-down bet on the memory cycle continuing, and who can wait out the next downturn without selling.
Contact [email protected] for any questions or corrections.
Austin Smith is a financial publisher with over two decades of experience as an investor, analyst, and advisor. He covers stocks, ETFs, Artificial intelligence and personal finance for 24/7 Wall St. Previously, he spent over a decade at The Motley Fool as a senior editor for Fool.com, portfolio advisor for Millionacres, and launched The Ascent to help reader take control of their personal finances.
His work has been featured on Fool.com, NPR, CNBC, USA Today, Yahoo Finance, MSN, AOL, Marketwatch, and many other publications. He is as an advisor to private companies, and co-hosts The AI Investor Podcast with Eric Bleeker.
When not looking for investment opportunities, he can be found skiing, running, or playing soccer with his children. Learn more about Austin's investment approach here.