Your ETF’s Spread Looks Like Zero. Here’s What That Number Doesn’t Tell You
That 0.00% bid-ask spread on your ETF looks like free trading, but the number is calculated in a way that quietly ignores the moments most likely to cost you money.

This post may contain links from our sponsors and affiliates, and Flywheel Publishing may receive compensation for actions taken through them.
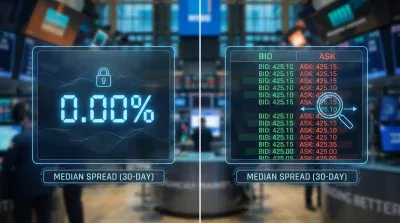
Pull up the fund page for the SPDR S&P 500 ETF Trust (NYSEARCA:SPY), and one number looks almost too good. State Street Global Advisors lists SPY’s 30-day median bid/ask spread at 0.00% as of October 26, 2026.
That figure is real, but it describes only a typical moment over the past month and makes no promise about the price you’ll get when you click buy. Here’s what the number measures, what it leaves out, and how to check the price that actually matters for your money.
What a Bid-Ask Spread Actually Costs You
The bid is the highest price a buyer will pay right now. The ask is the lowest price a seller will accept. The gap between them is the bid-ask spread, and iShares’ own prospectus warns that an investor “may incur costs attributable to the difference” between those two prices when trading shares.
This cost sits apart from the expense ratio, the annual fee a fund charges for running your money. You pay the spread every time you trade, usually to a market maker, a firm that stands ready to buy and sell shares all day and makes that gap for the service.
How a Near-Zero Spread Gets Built
State Street Global Advisors explains that it identifies the national best bid and offer (the best prices available across the whole market) at the end of each 10-second interval during each trading day. State Street Global Advisors runs that process over the last 30 calendar days, divides each gap by the midpoint price, and then posts the median.
A median is the middle value when you line up every reading from smallest to largest. It describes a typical moment. The largest spreads — the ones that would cost you the most — sit at the edges, where the median ignores them.
Bond funds such as the iShares 20+ Year Treasury Bond ETF (NASDAQ:TLT) use the same approach. Like State Street Global Advisors, BlackRock iShares reports a 30-day median bid/ask spread of 0.01% for the iShares 20+ Year Treasury Bond ETF as of October 23, 2026. Both rank among the most heavily traded funds in their categories, which explains their small medians.
What the Median Leaves Out
The SEC’s investor guidance spells out the gap. Trade execution isn’t instantaneous, prices can change quickly (especially in fast-moving markets), and because price quotes cover only a specific number of shares, investors may not always receive the price they saw on their screen.
So the live spread at the moment you trade, and how many shares are available at that price, matter far more to your order than any 30-day median. Markets get volatile without warning. Reuters reported this week that trend-following hedge funds saw their worst week since 2024 as AI stocks fell, a reminder that calm averages can hide rough days.
Even SPY Drifts Above and Below Its Holdings
Every ETF has a net asset value, called NAV, which is the per-share value of everything the fund owns. The market price can sit slightly above NAV (a premium) or slightly below it (a discount).
State Street Global Advisors reports SPY’s premium/discount at 0.01% as of October 26, 2026, comparing the 4 p.m. bid/ask midpoint with the 4 p.m. indicative NAV, while BlackRock iShares lists TLT’s premium/discount at 0.07 as of October 23, 2026.
These moves are routine. State Street Global Advisors says SPY’s 4 p.m. bid/ask midpoint was above NAV on 123 trading days in calendar 2025, and State Street Global Advisors says it was below NAV on 127 trading days that year. Even the biggest fund on the market moves between small premiums and discounts as a normal part of trading.
Your Broker Picks Where Your Order Goes
When you place a trade, your broker decides where to send the order and has a duty to seek best execution, according to SEC guidance. You might receive price improvement, meaning a fill better than the quote you saw, but it isn’t guaranteed.
A Four-Step Check Before You Click Buy
If you’re moving a large sum, such as a rollover near retirement, these steps take about a minute:
- Look at the live bid and ask. The fund page’s median describes the past month. The quote on your screen describes right now.
- Compare published medians across similar funds. A consistently tight figure signals healthy trading in that fund.
- Consider a limit order. A market order fills at whatever price is available when it reaches the market. A limit order sets the most you’ll pay (or the least you’ll accept when selling) and won’t fill beyond that price.
- Mind your order size. The quoted price applies only to a limited number of shares, so a large order can reach into worse prices.
A near-zero published spread tells you a fund trades efficiently most of the time, and that’s a truly good sign about the fund. Your own cost gets set by the live quote at the moment you trade, which makes it the number worth checking every single time.
Contact [email protected] for any questions or corrections.
Ryne Mauck is an investment writer covering exchange-traded funds, retirement planning, and portfolio strategy. Through his work at 24/7 Wall St. and other investment platforms, including Seeking Alpha, he aims to provide clear, research-driven insights that help investors make more informed decisions while maintaining a long-term approach to investing.
Ryne holds a B.Sc. in Finance and an M.A. in Political Science. He is a formerly registered Municipal Advisor Representative and has passed the Series 50, Series 63, and Series 65 exams. His articles are not intended to be, nor should they be interpreted as, financial advice.