One Financial ETF Yields 15.70% and Lost Money. The Two Yielding Under 2% Kept Pace With the S&P 500
A monthly payout that looks like a gift can hide a shrinking share price and a leveraged business model. Before chasing double-digit income in financials, see what the high-yield fund holds, what its distributions are quietly doing, and what the…

This post may contain links from our sponsors and affiliates, and Flywheel Publishing may receive compensation for actions taken through them.

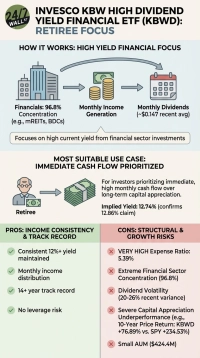
The Invesco KBW High Dividend Yield Financial ETF (NASDAQ:KBWD) has a trailing twelve-month distribution yield of 15.7%, a number that catches the eye of almost any income investor. Over the year ended November 4, 2026, the fund still returned -8%, and that figure includes every distribution reinvested.
Two simpler funds did much better. Both the Vanguard Financials ETF (NYSEARCA:VFH) and State Street Financial Select Sector SPDR ETF (NYSEARCA:XLF) returned approximately 15%. Both roughly matched the iShares Core S&P 500 ETF (NYSEARCA:IVV). That S&P 500 comparison fund returned 14% over the same window and finished slightly behind both.
KBWD Gets Its 15.7% Yield From Leveraged Lenders
As of August 31, 2026, KBWD held 39 positions and had $413 million in net assets. These are small, high-payout financial companies. The megabanks you would expect in a financials fund are missing.
Its largest stock holding was FS KKR Capital, a business development company (BDC), at 4%. A short-term cash vehicle inside the fund, the Invesco Private Prime Fund, was bigger at 10%.
Mortgage REITs fill a long string of positions, with weights running from Annaly Capital Management at 3% to Orchid Island Capital at 4%. AGNC Investment, ARMOUR Residential REIT, and Dynex Capital fall in that band. BDCs such as Goldman Sachs BDC and Carlyle Secured Lending, along with asset managers and regional banks, make up most of the rest.
Why These Businesses Pay So Much
Both groups are designed to pass income through to shareholders. Under 26 U.S.C. § 857(a)(1), a REIT must pay out at least 90% of its taxable income to keep its special tax status. BDCs elect regulated investment company treatment, and 26 U.S.C. § 852(a)(1) sets the same 90% minimum. Because they keep so little of their earnings, payouts stay high, and growing the business usually means raising new capital.
Leverage drives both the income and the risk. A mortgage REIT borrows short-term money to buy longer-dated mortgage securities and earns the difference between the two rates. When rates move sharply, book value can fall faster than the dividends can replace it. A BDC lends borrowed money to midsize private companies, so any rise in defaults comes straight out of net asset value.
Rates Explain Only Part of the Loss
Fed policy ended the window where it started. The Fed’s target range had an upper bound of 4% at both the start and end of the window. The Fed cut it to 3.75% in December 2025 and raised it again in September 2026.
That round trip, combined with large moves in longer-term Treasury yields, kept funding costs and mortgage valuations volatile, and credit quality and payout cuts were also part of the story. KBWD’s monthly distribution fell from $0.14795 in February 2026 to $0.13485 in October 2026, a sign that its holdings were paying less.
The yield still looks high because it is simply trailing distributions divided by the share price. If the price drops faster than payouts shrink, the yield rises. Part of the 15.7% figure reflects a share price that has dropped (we listed the seven warning signs that a big yield is about to be cut in a free report on dividend traps).
XLF Leans on Berkshire, JPMorgan and the Card Networks
XLF holds only the financial stocks in the S&P 500. As of June 30, 2026, it had 81 positions and about $51 billion in net assets.
Berkshire Hathaway at 12% and JPMorgan Chase at 12% led the portfolio, followed by Visa at 8% and Mastercard at 5%. The card networks earn fees on spending and take on little credit risk. Berkshire’s insurance and industrial businesses also water down the pure banking exposure. Concentration is the tradeoff: a rough stretch at Berkshire or JPMorgan affects the whole fund.
XLF carries a yield of 1.4% and paid four quarterly distributions over the trailing twelve months. Its return came almost entirely from rising share prices, with the dividend playing a small part.
VFH Reaches Deeper Into Midsize and Smaller Financials
The MSCI US Investable Market Financials 25/50 Index that VFH follows covers large, midsize, and small banks, insurers, capital markets firms, and diversified financial companies. That adds regional lenders and smaller insurers that XLF does not hold, while market-cap weighting keeps the same giants at the top.
The fund’s expense ratio is 0.09%, according to its prospectus dated June 30, 2026. It yields 1.6%, slightly more than XLF, and its one-year return roughly matched XLF’s.
VFH made four quarterly distributions, but their size varied widely in 2026, from $0.3793 in March to $0.8519 in June. If you plan your budget around each payment, expect them to be uneven.
Five Years Show the Broad Funds Trailing the S&P 500
Over the past five years, KBWD’s total return was -8%. XLF returned 61%, and VFH returned 59%.
Both broad funds trailed IVV, which returned 76% over the same period. One strong year leaves that longer record intact, and past returns in either window are an unreliable guide to the next. KBWD paid out cash every month for five years and still left investors who reinvested with less than they put in.
What to Check Before Trusting a Double-Digit Yield
A very high yield in financials usually points to leveraged, high-payout businesses, and since all three of these funds hold stocks, any of them can fall sharply. Before treating a large yield as income, check these four things:
- Total return: Compare the yield with the fund’s total return over one and five years. A large distribution means little if the share price is falling faster than the payments come in.
- Distribution trend: Compare recent payouts with earlier ones. Shrinking payments, like KBWD’s this year, often appear before the yield figure reflects the problem.
- Tax character: High-payout funds can classify part of their distributions as return of capital, which reduces your cost basis and is not considered income. Income from REITs and BDCs often does not qualify for the lower qualified-dividend tax rate. Review the fund’s year-end tax filings along with its distribution notices.
- Underlying holdings: Read the holdings report. Leverage, credit exposure, and rate sensitivity in the top positions tell you how the fund is likely to hold up when conditions change.
Which Financial Fund Fits Which Investor
XLF suits investors who want large-cap financial exposure anchored by Berkshire, JPMorgan, and the card networks. VFH fits those who want broader reach into midsize and smaller financials, with a stated 0.09% fee. KBWD only suits investors needing monthly cash flow. They must understand leveraged lenders and accept that their principal can shrink even as the payments keep coming. If your goal is building total wealth, the broad funds are the better place to start your research.
Contact [email protected] for any questions or corrections.
Ryne Mauck is an investment writer covering exchange-traded funds, retirement planning, and portfolio strategy. Through his work at 24/7 Wall St. and other investment platforms, including Seeking Alpha, he aims to provide clear, research-driven insights that help investors make more informed decisions while maintaining a long-term approach to investing.
Ryne holds a B.Sc. in Finance and an M.A. in Political Science. He is a formerly registered Municipal Advisor Representative and has passed the Series 50, Series 63, and Series 65 exams. His articles are not intended to be, nor should they be interpreted as, financial advice.