Howard Marks Warned Me About S&P 500 Valuations: I Ignored Him and My Portfolio Doubled
On a recent episode of My First Million, Sam Parr told his co-host Shaan Puri that he keeps 80% of his portfolio in the S&P 500, which would not be remarkable except for who told him not to. Howard Marks,…

This post may contain links from our sponsors and affiliates, and Flywheel Publishing may receive compensation for actions taken through them.

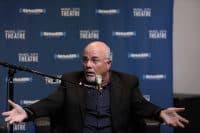
On a recent episode of My First Million, Sam Parr told his co-host Shaan Puri that he keeps 80% of his portfolio in the S&P 500. That alone would not be remarkable. What makes it interesting is who told him not to. Howard Marks, the Oaktree co-founder whose memos move money around the world, had sat in that same studio in August 2025 and warned that buying the S&P at 23x forward earnings would deliver returns “between -2% and 2%” over the next decade. That warning came in Marks’s August 2025 memo, “The Calculus of Value,” which cited J.P. Morgan data showing that every historical instance of buying the index at a 23x forward multiple (in the period 1987 through 2014, the only window with sufficient data) produced a ten-year annualized return in that range. Puri pressed Parr on whether he had a real rebuttal or was just ignoring one of the most respected risk minds alive.
Parr’s answer: “I don’t care.”
Since the warning, the index has largely cooperated with Parr, not Marks. The S&P 500 gained roughly 23% in the thirteen months following Marks’s caution, and Parr’s portfolio has doubled since he sold The Hustle to HubSpot in February 2021. One wrinkle worth noting: the S&P’s forward P/E has since compressed from that worrying 23x to around 21x, as a powerful earnings surge has raised the denominator faster than prices have risen. So is Marks wrong? Or is Parr just early to being wrong?
My verdict: Parr’s process beats Marks’ forecast, even if Marks’ math is right
I’ve been reading Howard Marks’s memos for the better part of two decades, and I’ve watched smart people use his warnings to justify staying in cash through some of the best compounding years of their lives. That is the trap. Marks is not usually wrong about valuation. He is just operating on a timeline most retail investors cannot sit through without flinching.
The mechanic that matters most is the opportunity cost of waiting. When a famous investor says future returns will be low, the instinct is to reduce exposure. But “low” in Marks’s framing means -2% to 2% real returns over ten years, not a crash next Tuesday. The path to that low average usually includes years that look nothing like the average.
Run the numbers on a $100,000 portfolio. If you bought SPDR S&P 500 ETF (NYSEARCA:SPY) on August 1, 2025, at approximately $619 and held to around $762 as of mid-September 2026, your $100,000 became roughly $123,000 in just over a year. If you instead sat in 10-year Treasuries at about 4.4%, you collected closer to $4,900 in coupon income over the same window. That is the gap. The forecast can still be correct over the full decade, and you will have already banked more than a year of equity gains the bond sitter never collected.
Stretch the lens further. SPY carries a 10-year price compound annual growth rate of roughly 13%, and its 20-year total return sits at approximately 483%. Credentialed voices warned against the index at multiple points inside those windows. Parr’s thesis is studying American history and targeting “8% nominal return every single year.” That number maps cleanly to a century of equity data, and is actually conservative given the index’s realized pace over the past decade. That is pattern recognition, not recklessness.
Since Marks published “The Calculus of Value,” he returned to the My First Million studio for a second conversation (Episode 841) in 2026, this time focusing on AI and decision-making under uncertainty. His core view on valuation has not shifted: high prices leave no margin for error. What has shifted is the earnings picture, which has compressed the S&P’s forward P/E back toward 21x without a meaningful market decline. That is a different setup than the one Marks warned about, even if his long-range caution still applies.
The variable: what real return do you actually need?
The one factor that decides whether Marks or Parr is right for you is your required real return, after inflation.
Inflation remains above the Fed’s target. The CPI rose 3.4% year over year through August 2026, with energy costs the primary driver as gasoline jumped 3.9% in August alone. Core inflation, which strips out food and energy, eased to 2.4% annually, the lowest reading since March 2021. Both readings still sit above the Fed’s 2% goal, and Fed Chairman Kevin Warsh, who took office on May 22, 2026, has made controlling inflation his primary stated objective. If Marks is correct and the next decade delivers 1% real, a retiree drawing 4% a year is liquidating principal every year. For that person, valuation risk is existential, not theoretical.
For a 35-year-old still contributing, the picture is different. Even at 1% real annual returns, dollar-cost averaging through a flat decade means buying more shares at lower prices, then capturing the eventual mean reversion. Parr is 36 and still earning. The math forgives him.
Parr also made a point worth sitting with: the S&P 500 “is not an American index. It’s a global index.” Look at the top of SPY. NVIDIA (NASDAQ:NVDA | NVDA Price Prediction) at around 8% of the index, Apple (NASDAQ:AAPL) at roughly 7%, Microsoft (NASDAQ:MSFT) at about 5%. These are global cash flow machines wearing American tickers. As Marks himself noted in “The Calculus of Value,” these seven companies alone accounted for more than half of the S&P’s 58% two-year total return in 2023 and 2024. The 23x multiple Marks warned about was partly the price of that extraordinary earnings quality, and since then the earnings have partly justified the price.
What to actually do with this
- Calculate your required real return. Take your retirement number, subtract current savings, divide by years remaining, and back out inflation. If you need more than 4% real, sitting out equities on someone else’s forecast will almost certainly leave you short.
- Stress test against Marks’ scenario. Model your portfolio assuming 1% real returns for ten years. If you still reach your goal, valuation worry is noise for your specific situation. If you fall short, the signal is to raise your savings rate, not to try timing the market.
- Write your plan down before the next selloff. The VIX hit 31 on March 27, 2026. Anyone without a written investment plan at that moment probably sold something they later regretted.
Marks may yet be proven right on the decade. The Shiller CAPE currently sits around 41x, placing it at the 98.8th percentile of all monthly readings since 1881, and only a handful of months at the peak of the dot-com bubble have ever been higher. Parr admits his biggest behavioral bias is refusing to sell losers, and that same stubbornness is what keeps him indexed through volatility. The real lesson from both men: a plan you will actually stick with usually beats the smartest forecast you will second-guess at the first sign of trouble.
Editor’s note: This pass updated the SPY price comparison to reflect mid-September 2026 levels (approximately $762, up roughly 23% from the August 2025 entry point of $619), corrected Sam Parr’s age from “roughly 38” to 36, refreshed CPI data to the August 2026 reading of 3.4% headline and 2.4% core (released September 11, 2026), and raised the Shiller CAPE figure from the prior “around 39x” to the current approximately 41x, which sits at the 98.8th percentile of all monthly readings since 1881.
Contact [email protected] for any questions or corrections.
Don Lair writes about options income, dividend strategy, and the kind of boring-but-durable investing that actually funds retirement. He's the founder of FITools.com, an independent contributor to 24/7 Wall St., and a former writer for The Motley Fool.