A $900,000 Portfolio That Quietly Pays $60,000 a Year Without Touching Principal
Most retirees assume a big nest egg means accepting either a meager paycheck or a slow bleed of principal, but the real tradeoff is far more nuanced and depends on which yield tier you choose to trust with your financial…

This post may contain links from our sponsors and affiliates, and Flywheel Publishing may receive compensation for actions taken through them.

Sixty thousand dollars a year is roughly what the median U.S. household spends after taxes, and it is the number many pre-retirees quietly aim to replace with investment income. Hitting it on a $900,000 nest egg requires a blended yield near 6.7%, which sits above the 4.7% 10-year Treasury yield and well above the national average on a 12-month CD. With Treasury yields recently pushing toward multi-decade highs, the gap between “safe” income and what $900,000 can actually generate is closing, but it has not closed entirely.
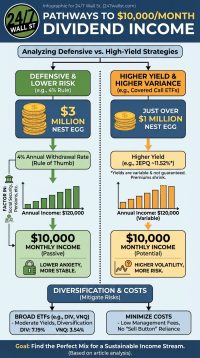
The real question is how to reach that yield without slowly liquidating the portfolio that produces it. Three tiers frame the tradeoffs.
Conservative Tier: 3% to 4% Yield
At a 3.5% yield, $60,000 divided by 0.035 requires roughly $1,714,000 of capital. That is nearly double the $900,000 anchor, and that gap is precisely the point: the safest income costs the most upfront.
This is the domain of dividend growth equities, broad-market dividend ETFs, regulated utilities, and blue-chip regional banks. Alliant Energy (NASDAQ:LNT | LNT Price Prediction) illustrates the profile, with a yield near 2.9% backed by a $0.54 quarterly payout and a growth pipeline tied to 3.4 GW of contracted data center demand. Alliant has raised its dividend for more than two decades at an average annual rate near 6%, giving shareholders income that compounds meaningfully over time. East West Bancorp (NASDAQ:EWBC) raised its quarterly dividend from $0.60 to $0.80 at the start of 2026, lifting the annualized rate to $3.20 per share, a 33% jump that reflects both strong earnings and management confidence. Casey’s General Stores (NASDAQ:CASY) yields under 0.3% but has raised its dividend for 27 consecutive years, reaching a quarterly payout of $0.57 per share.
The tradeoff here is deliberate. You buy the least current income and the most durability. Distributions grow, principal tends to compound, and the portfolio survives cuts that would devastate higher-yielding alternatives.
Moderate Tier: 5% to 7% Yield
At 6%, $60,000 divided by 0.06 requires $1,000,000. At the portfolio’s implied 6.7% blend, $900,000 does the job exactly. At 7%, the required capital drops to roughly $857,000.
This tier is populated by energy MLPs, equity REITs, preferred shares, covered call equity funds, and high-dividend value ETFs. Plains All American Pipeline (NASDAQ:PAA) is a concrete example, distributing $0.4175 per unit quarterly for an annualized $1.67, a distribution yield the partnership itself pegged at approximately 7% in its second-quarter 2026 results. Plains also raised its 2026 adjusted EBITDA guidance midpoint by $130 million to $2.88 billion during that same period, giving the distribution a real coverage cushion. The partnership completed the sale of its Canadian NGL business in May 2026, cutting pro forma leverage to 3.3x and toward the low end of its 3.25 to 3.75x target.
The tradeoff: distribution growth slows compared to the conservative tier, some covered call strategies cap upside in strong markets, and MLPs require K-1 tax filings at year-end.
Aggressive Tier: 8% to 14% Yield
At 10%, $60,000 divided by 0.10 requires only $600,000. At 12%, the number drops to $500,000. On paper, the aggressive tier looks like the obvious answer.
The math hides real risk. Mortgage REITs, business development companies, leveraged covered call funds, and high-yield bond funds live here. AGNC Investment (NASDAQ:AGNC) pays $0.12 monthly for a current yield around 13%, but its per-share dividend has declined at a compound annual rate of roughly 5% since 2016, and its tangible book value has drifted lower over years even as the monthly checks arrived on schedule. The principal erosion is the mechanism that keeps the headline yield elevated even as the underlying payout shrinks.
The core risk is precisely that: high current income often coexists with a shrinking asset base. The $60,000 a portfolio generates today can become $54,000 or $48,000 in five years if principal quietly erodes.
The Compounding Point Most Yield Charts Hide
A 3.5% yield growing 8% annually doubles income in about nine years. A 12% yield that stays flat, or drifts lower, does not. Casey’s is the clearest illustration: shares trade near $870 today, after a 10-year gain that has left earlier buyers holding a position worth many times their original cost, with the quarterly dividend climbing from pennies to $0.57. The aggressive-tier mREIT delivered a fraction of that total return over the same period, with the share price ending near where it started, meaning nearly all of the return came from distributions rather than asset appreciation.
A growth company with a 0.7% yield attached to a genuinely expanding business can outrun a static high payout on total-return math once the compounding period is long enough.
Three Actions to Take This Week
- Reprice the target. Pull last year’s actual spending, not gross salary. Many households replacing a $60,000 income only need to fund $45,000 to $50,000 after taxes and payroll deductions disappear.
- Run a ten-year total-return comparison between a 3.5% dividend growth vehicle and a 10% high-yield fund. Include reinvested distributions. The gap almost always favors the grower once compounding runs its full course.
- Model the tax bill by tier. Plains generates a K-1, the mREIT pays ordinary-income dividends, and qualified dividends from Alliant, East West, and Casey’s typically receive preferential rates. In a sub-4% Fed Funds environment, the after-tax spread between tiers is wider than the headline yields suggest.
$900,000 can pay $60,000 without touching principal. Whether it keeps doing so in 2036 depends on which tier you lean on now, and on whether the income it generates grows alongside the cost of living or slowly falls behind it.
Editor’s note: This article updates Alliant Energy’s quarterly dividend to $0.54 and yield to approximately 2.9%, corrects Casey’s quarterly payout to $0.57 per share, revises Plains All American’s distribution yield to approximately 7% based on the partnership’s second-quarter 2026 results, adjusts the 10-year Treasury yield reference to 4.7% to reflect current market levels, and adds context on Plains All American’s completed Canadian NGL divestiture and the related leverage reduction.
Contact [email protected] for any questions or corrections.
I am a long time investor and student of business, and believe finding good companies that can become great investments is the best game on earth. After 20 years of writing and researching the public markets it is clear that individuals have never had more tools and information to take control of their financial lives. From ETFs and $0 commissions to cryptos and prediction markets there has never been a greater democratization of access to investing.
I write to help people understand the investments available to them so they can make the best choice for their portfolio, whether they're starting out or looking for income in retirement.