The Top 1% Now Hold 32.5% of U.S. Household Wealth, the Highest Share in Fed Records Going Back to 1989. The Bottom Half Holds 2.3%

This post may contain links from our sponsors and affiliates, and Flywheel Publishing may receive compensation for actions taken through them.
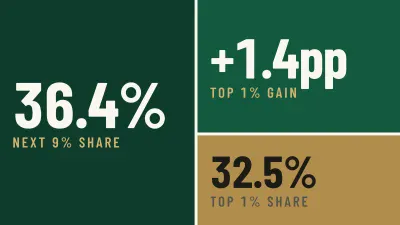
In the second quarter of 2026[1], the richest 1% of American households held 32.5% of the country’s household wealth, according to the Federal Reserve’s Distributional Financial Accounts. That is the highest share in the Fed’s series, which starts in 1989[1]. Meanwhile, the bottom half of all households held just 2.3%[1].
A couple of terms help explain the data. Net worth is everything a household owns (a home, savings, retirement accounts, stocks) minus everything it owes, like a mortgage, car loans, and credit card balances. Percentiles line up every household from the least wealthy to the most. The middle household falls at the 50th percentile, and the richest 1% starts at the 99th. So “the bottom half” covers every household below the middle.
Ranking America’s Wealth Groups by Share of Net Worth
The Federal Reserve organizes households into four main groups. Here’s how they ranked by share of total U.S. household net worth in the second quarter of 2026:
- Next 9% (90th to 99th percentile): 36.4%[1]. These are well-off households, like successful professionals and business owners, sitting just below the very top.
- Top 1% (99th percentile and up): 32.5%[1]. Wealth is concentrated even inside this group. The top 0.1% alone held 15%[1].
- Next 40% (50th to 90th percentile): 28.8%[1]. That’s the upper-middle class, the group most people picture when they think of a comfortable homeowner with a retirement account.
- Bottom 50% (below the 50th percentile): 2.3%[1]. Half the country’s households split that share.
The Fed reports dollar amounts in nominal terms, so they aren’t adjusted for inflation. The shares avoid that problem, since each one compares groups within the same quarter.
Bottom Half’s Share Has Moved Sharply Since 1989
When the series began in 1989 Q3[1], the bottom half held 3.5%. It peaked at 4.1%[1] in 1992 Q3, then slid for years. Then the housing crash wiped much of it out.
The share bottomed at 0.4%[1] in several quarters between 2010 and 2012. For households near the bottom, the home is usually the biggest asset, and it often comes with a large mortgage. Prices fell, the debt didn’t, and many families saw their equity disappear.
Home values eventually recovered, and the bottom half’s share came back with them, reaching 2.7%[1] in 2022. Since then, it has drifted back to 2.3%[1].
Stock Ownership Drives the Gap
The wealthiest households own most of the stock market. The richest 1% held 50.9%[1] of corporate equities and mutual fund shares outside retirement plans. When stock prices rise, they collect the biggest share of the gains, and their slice of total wealth grows. Over the past year, the top 1%’s share rose 1.4 percentage points[1].
The upper-middle 40% looks different. More of its wealth sits in homes and pensions, so a stock rally lifts that group less. That helps explain why the middle class can feel stuck in place during stock rallies.
Generations show the same split, with Baby boomers holding 54.5% of stocks and funds and 52.5% of all household net worth. Millennials held only 9.3%[1] of stocks and funds.
Still, the millennials who did own stock saw it pay off. Their stock and fund holdings rose 39.7%[1] from a year earlier, and their net worth grew 18.5%, so even a small stake participated in the rally.
What It Means for Retirees and Savers
Most households get into the stock market through a 401(k), an IRA, or a low-cost index fund that holds hundreds of companies at once. A diversified fund spreads risk across the whole market. That means a household with a small balance gets a piece of the same gains that lift the top 1%. 24/7 Wall St. explores index funds and workplace retirement plans in greater detail.
Small balances usually come with small contributions. Vanguard’s How America Saves 2026 found that participants with balances under $10,000 had the lowest average deferral rate, at 4.2% of pay. Deferral rates rose as balances grew. For retirees and people close to retirement, it’s a reminder that money already invested keeps working long after the paychecks stop.
What to Watch in the Next Fed Update
The Fed updates these accounts every quarter, and the next release will show whether the top 1%’s record share holds. The data tells us where wealth sits today. It can’t predict where markets go next, and a stock decline would likely shrink the top group’s share just as a rally expanded it.
The wealth gap mostly comes down to who owns stocks, and a retirement account or a diversified index fund lets just about any household own some.
Contact [email protected] for any questions or corrections.
David Beren has been a Flywheel Publishing contributor since 2022. Writing for 24/7 Wall St. since 2023, David loves to write about topics of all shapes and sizes. As a technology expert, David focuses heavily on consumer electronics brands, automobiles, and general technology. He has previously written for LifeWire, formerly About.com. As a part-time freelance writer, David’s “day job” has been working on and leading social media for multiple Fortune 100 brands. David loves the flexibility of this field and its ability to reach customers exactly where they like to spend their time. Additionally, David previously published his own blog, TmoNews.com, which reached 3 million readers in its first year. In addition to freelance and social media work, David loves to spend time with his family and children and relive the glory days of video game consoles by playing any retro game console he can get his hands on.