Americans 70 and Older Now Hold 33.6% of U.S. Household Wealth, the Highest Share on Record. Households Under 40 Hold 6.5%

This post may contain links from our sponsors and affiliates, and Flywheel Publishing may receive compensation for actions taken through them.

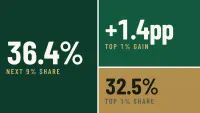
Households headed by someone 70 or older held 33.6%[1] of all U.S. household net worth in the second quarter of 2026[1], according to the Federal Reserve’s Distributional Financial Accounts. No older group has held a larger share in a series that goes back to 1989[1]. Households headed by someone under 40 held 6.5%[1].
Net worth is everything a household has, like a house, stocks, retirement accounts, and cash in the bank, minus everything it owes, like a mortgage, car loan, or credit card balance. The Fed sorts households by the age of the person who heads them. Its dollar totals aren’t adjusted for inflation, so comparing each group’s share of the total works better than comparing dollar amounts from different decades.
Ranking Every Age Group by Its Slice of U.S. Wealth
The 70-and-older group’s share rose 1.7 percentage points[1] between the second quarter of 2025 and the second quarter of 2026. At 33.6%[1], it’s the highest reading in the Fed’s quarterly series.
In 1989[1], the same age group held 18.9%. Here’s how all four groups rank by share of household net worth in the second quarter of 2026:
The 55-to-69 group still holds the most. Those are peak earning and saving years, and many people in that range have spent decades paying down a mortgage and adding to a 401(k). The under-40 group comes in last because younger households are just getting started. Some may still be carrying student loans or newer mortgages with less equity built up.
Why Wealth Keeps Shifting Toward Older Households
Stock ownership explains much of the shift. Households 70 and older own 40.5%[1] of the corporate stock and mutual funds held outside workplace retirement plans. When stock prices rise, the group that has the most stock gains the most in dollar terms, and its share of the country’s wealth grows with it.
Two slower trends likely add to it. Longer lifetimes can keep wealth in older households for more years before it passes on. Older homeowners who have paid off their mortgages count the full value of the house toward net worth with no debt to subtract.
The next-oldest group holds a large share of retirement savings. Households headed by someone 55 to 69 hold 49.5%[1] of all money in defined contribution plans, such as 401(k)s, and annuities. As those people turn 70, their balances move into the older group. That’s one reason the oldest group’s share could keep rising, though the Fed’s data only covers the past and doesn’t forecast it.
What Paper Wealth Means for Retirees
A big balance still has to be turned into money retirees can spend. For most, the steady check is Social Security. The average retired worker’s benefit is estimated at $2,071 a month after the 3.6% inflation adjustment for 2027.
Traditional IRA owners must also start required minimum distributions, which are mandatory annual withdrawals, at age 73. That age rises to 75 for people born in 1960 or later. A large pre-tax balance that sits untouched until then can trigger an oversized tax bill the first year withdrawals begin, which our free guide on defusing that first-year tax bomb walks through.
Those withdrawals count as taxable income, and that income can raise Medicare costs. The standard Part B premium is $202.90[2] a month in 2026, even though single filers with income above $109,000[2] pay income-related surcharges that can push the premium as high as $689.90.
After retirement, assets pass to heirs. IRS data shows 7,195 estate tax returns filed in 2024, and publicly traded stock was the largest asset category. Most people who inherit an IRA and aren’t a spouse or another eligible beneficiary have to empty it by the 10th anniversary of the owner’s death.
24/7 Wall St. ranked household wealth by income percentile on Nov. 13. The age breakdown answers a separate question: which households have had the most years to build their wealth.
Time in the Market Explains Most of the Gap
The oldest households hold a record share mainly because they’ve had homes and stocks the longest. Those assets have grown for decades, and that’s how the group’s share climbed from 18.9%[1] in 1989 to 33.6% in the second quarter of 2026.
The under-40 group’s 6.5%[1] mostly reflects fewer years of having assets. The Fed’s next quarterly update could show whether stock prices keep lifting the oldest group’s share as the 55-to-69 group ages into it.
Contact [email protected] for any questions or corrections.
David Beren has been a Flywheel Publishing contributor since 2022. Writing for 24/7 Wall St. since 2023, David loves to write about topics of all shapes and sizes. As a technology expert, David focuses heavily on consumer electronics brands, automobiles, and general technology. He has previously written for LifeWire, formerly About.com. As a part-time freelance writer, David’s “day job” has been working on and leading social media for multiple Fortune 100 brands. David loves the flexibility of this field and its ability to reach customers exactly where they like to spend their time. Additionally, David previously published his own blog, TmoNews.com, which reached 3 million readers in its first year. In addition to freelance and social media work, David loves to spend time with his family and children and relive the glory days of video game consoles by playing any retro game console he can get his hands on.