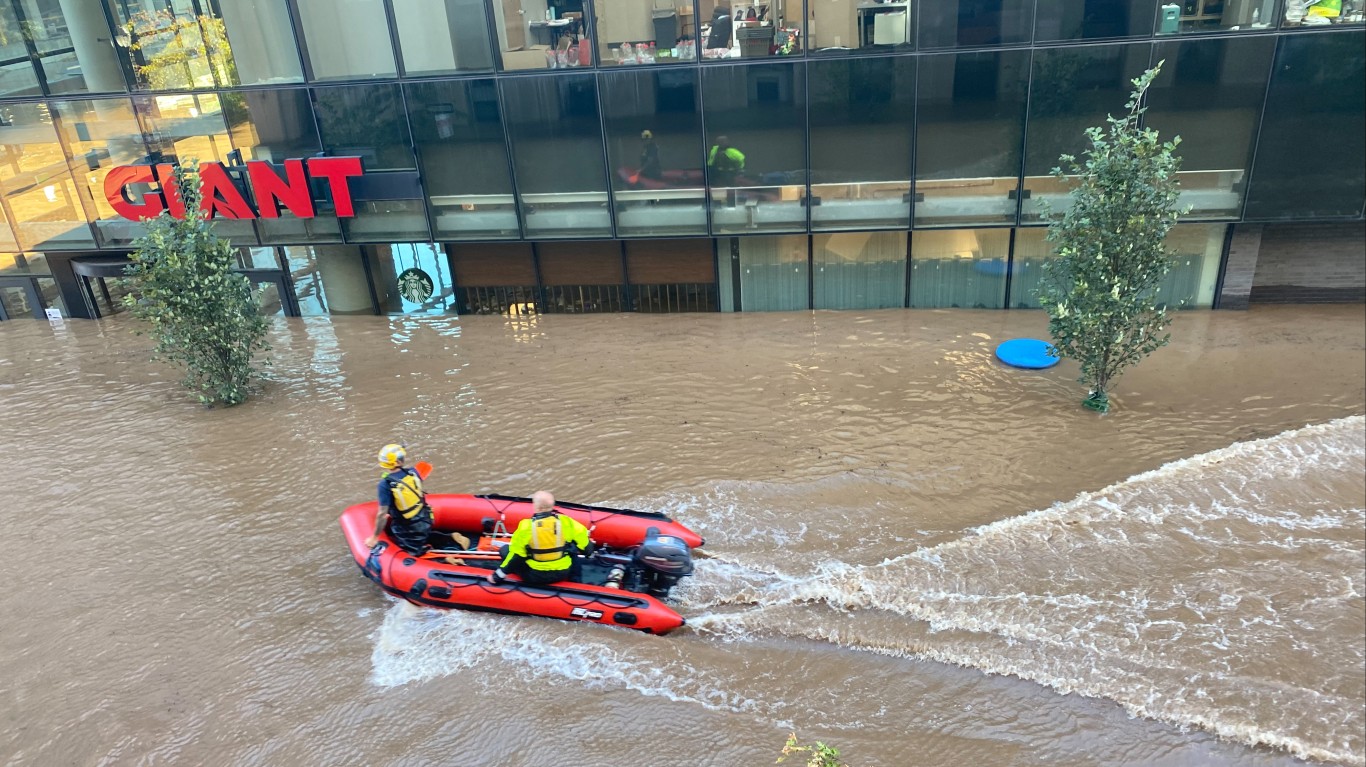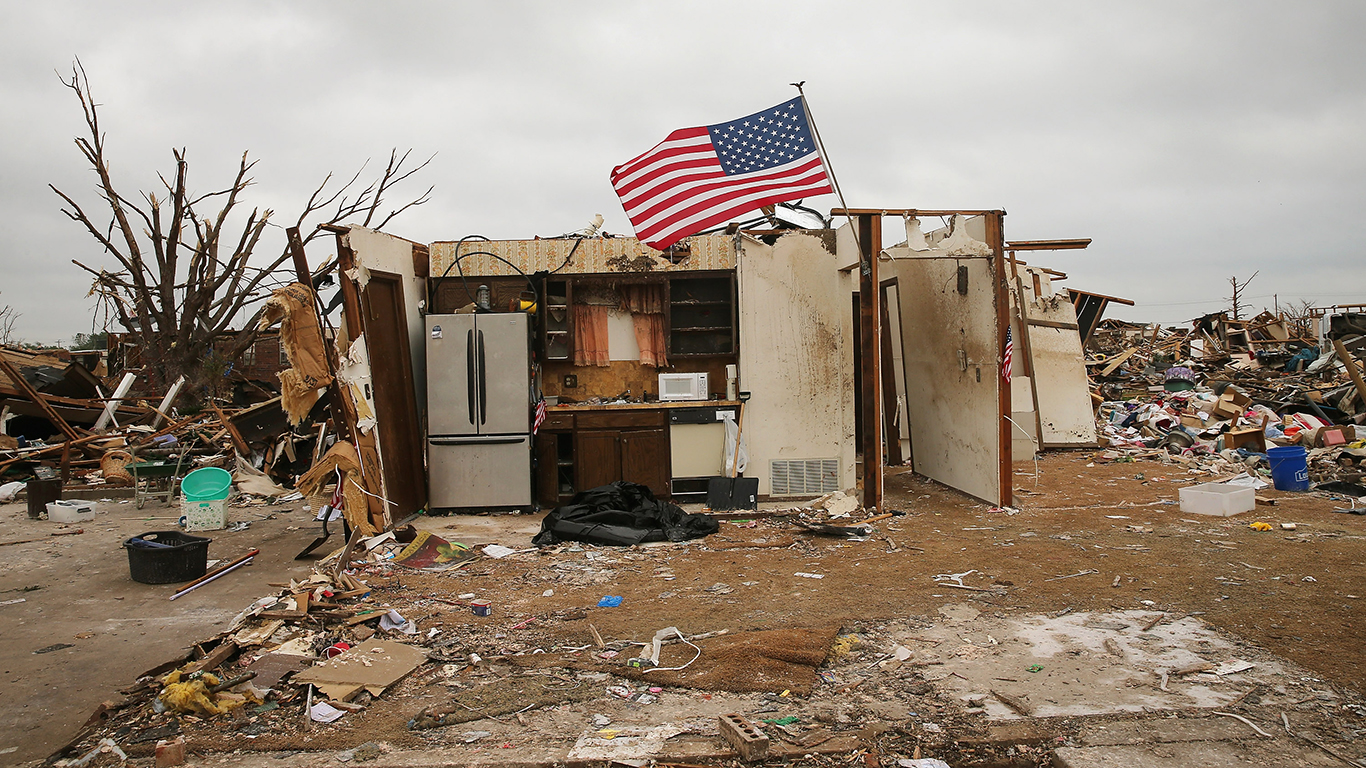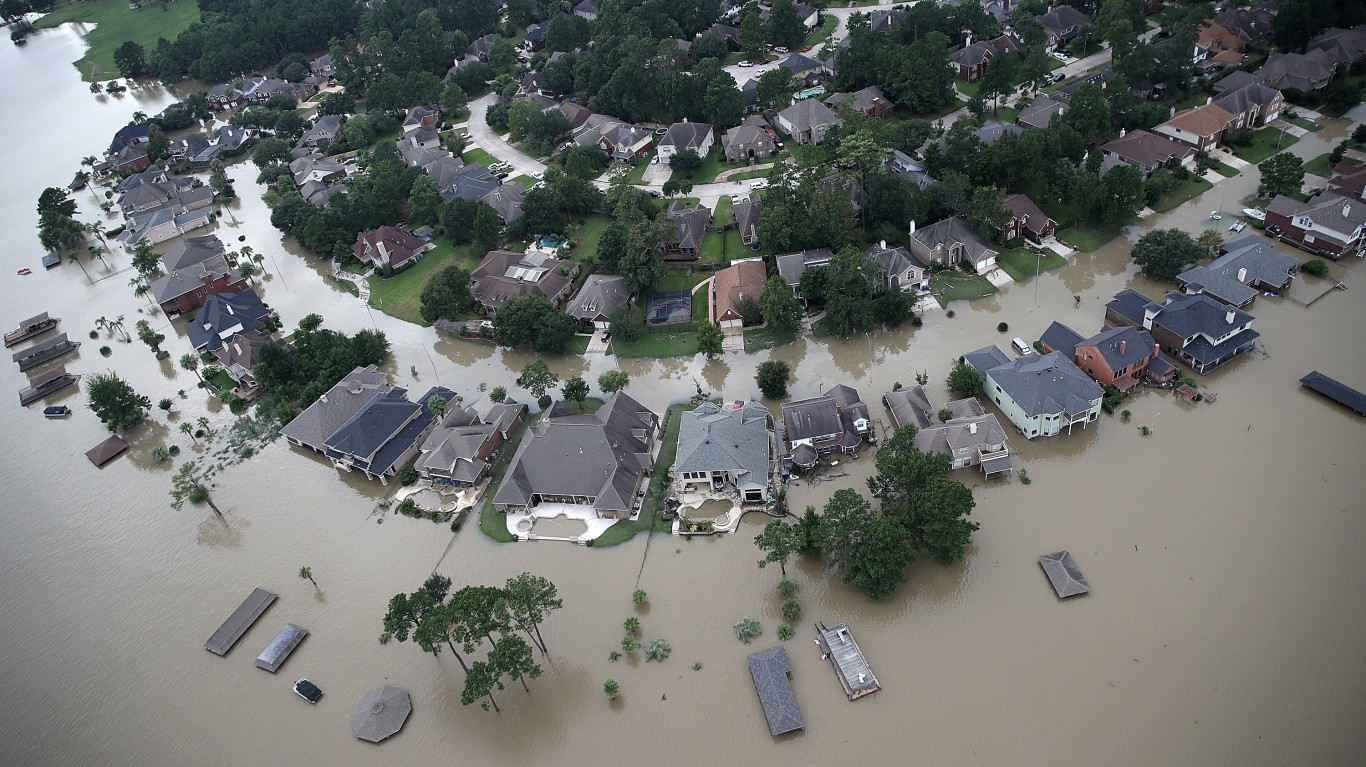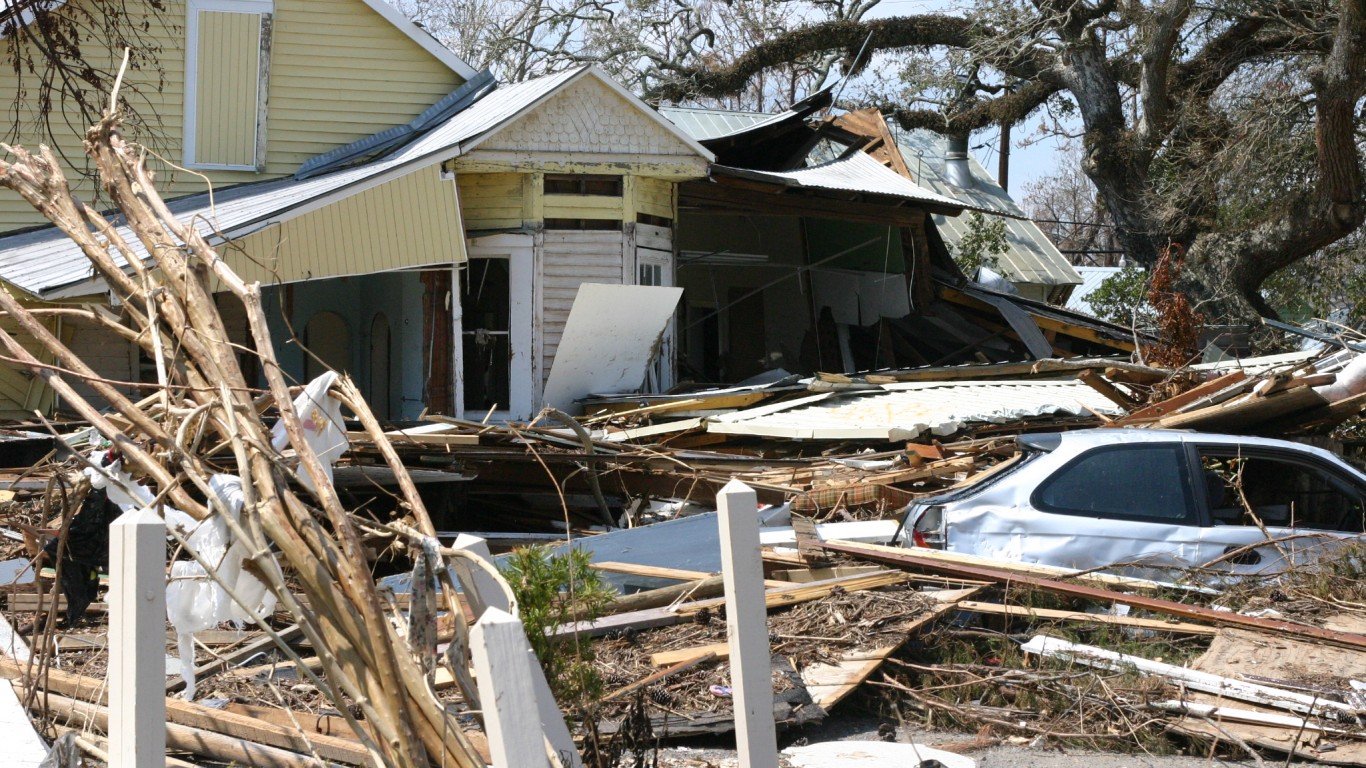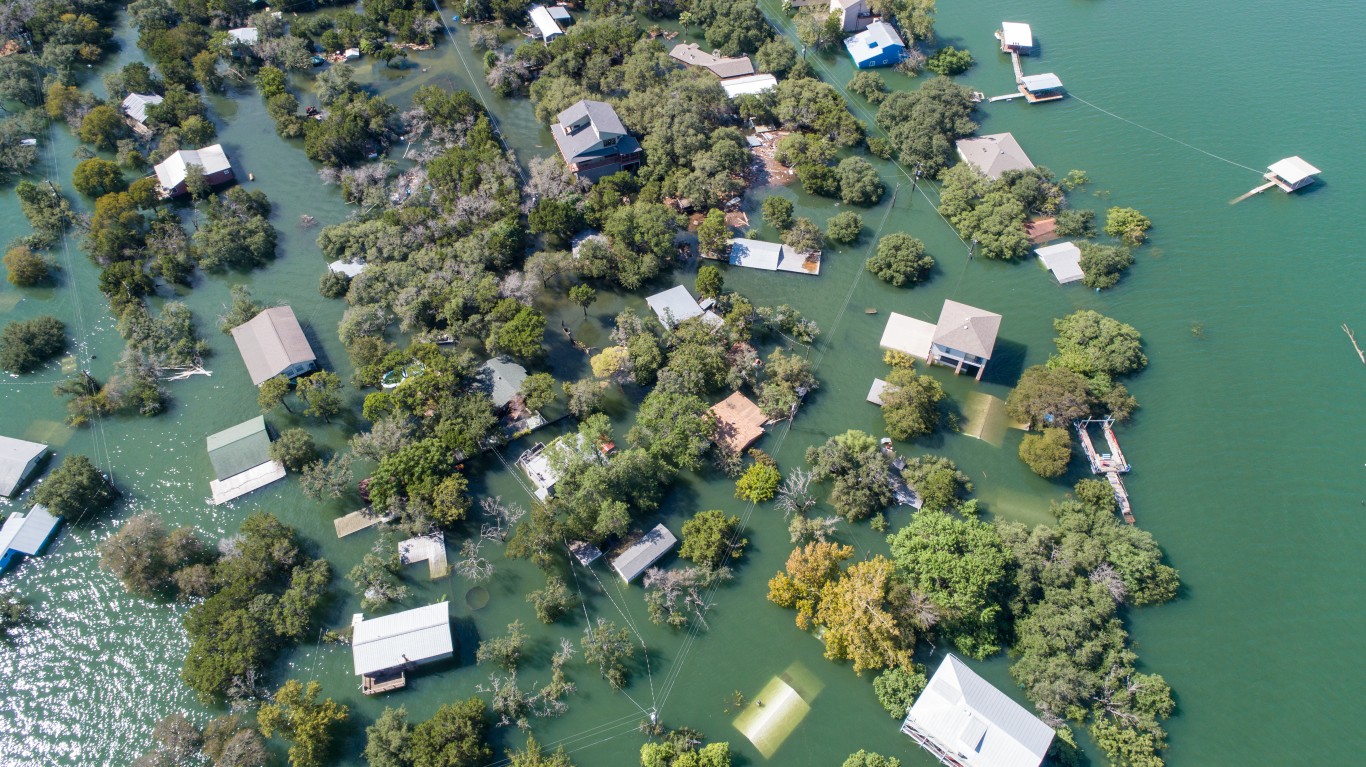
From hurricanes to disease outbreaks to wildfires, some part of the United States is usually facing an imminent natural disaster that could potentially endanger lives and cost millions of dollars. Hurricane Katrina destroyed 300,000 homes and caused more than $100 billion in damage. The Ebola strain, which devastated parts of West Africa in 2014, infected or killed several people in the U.S., and under different circumstances, could have been much deadlier. Wildfires raging in Alberta, Canada currently cover land mass roughly the size of Rhode Island, and similar fires burn millions of acres and kill Americans every year.
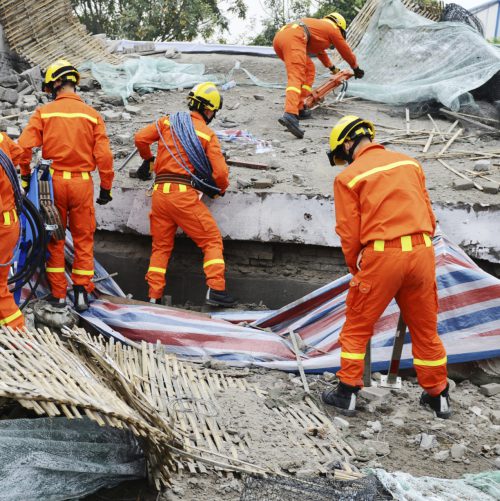
The federal government, through the Federal Emergency Management Agency, plays a significant role in providing support and coordinating relief efforts in crisis situations. State governments, however, also play meaningful roles in taking on the challenge of responding to a disaster, and not all states are equally prepared. 24/7 Wall St. reviewed a number of policies and spending habits on the state level to determine which states are the most and least prepared for natural disasters.
To determine which states are best prepared for an environmental disaster or a public health emergency, 24/7 Wall St. rated states based on criteria determined by the National Health Security Preparedness Index, a program of the Robert Woods Johnson Foundation. For each state, we reviewed certain disaster preparedness policies, such as whether the state mandates child-care facilities to have emergency evacuation plans, whether state public health labs have enough staff to properly combat a serious disease outbreak, and whether the state has a firm plan to combat issues that can stem from climate change. Currently, just 15 states have such a plan.
Click here to see the least prepared states for disaster.
Click here to read our methodology.
We also reviewed states on measures including the number of physicians and emergency medical technicians per capita, as well as changes in emergency management funding.
There does not appear to be a clear reason why some states adopt more recommended emergency preparedness policies while others do not, or why some states spend more than others and have more staff on hand to deal with potential disaster. States that tend to be more friendly to larger government involvement, including New York and Maryland, ranked as relatively well prepared. However, so did states with smaller governments and budgets, such as Mississippi and Kentucky.
Some states are relatively less affected by natural disasters, while some states are significantly more disaster-prone, be it to hurricanes, tornadoes, wildfires, or disease outbreaks. This may explain why states such as Utah and Michigan, which have relatively few reported major disasters that required FEMA intervention, tend to rank worse for emergency preparedness. However, some of the states that tend to be particularly at risk, including Florida and Texas, rank among the worst for implementing policies that can help avoid the worst effects of a disaster.
Editor’s note: A previous version of this article incorrectly stated that Hurricane Katrina had destroyed more than 300,000 million homes. It has been corrected to read “300,000 homes.”

1. Vermont
>All-hazards preparedness funding for FY 2015: $5,102,037
> Pct. change in hazard preparedness funding FY 2014-FY 2015: 0.3%
> EMTs per 100,000 residents: 99.0 (13th highest)
> Most common natural disasters: Flooding

2. New York
>All-hazards preparedness funding for FY 2015: $29,422,240
> Pct. change in hazard preparedness funding FY 2014-FY 2015: -0.6%
> EMTs per 100,000 residents: 72.2 (17th lowest)
> Most common natural disasters: Winter storms
[nativounit]

3. Kentucky
>All-hazards preparedness funding for FY 2015: $11,366,101
> Pct. change in hazard preparedness funding FY 2014-FY 2015: -0.1%
> EMTs per 100,000 residents: 103.3 (8th highest)
> Most common natural disasters: Tornadoes, flooding

4. Maine
>All-hazards preparedness funding for FY 2015: $5,784,996
> Pct. change in hazard preparedness funding FY 2014-FY 2015: -0.3%
> EMTs per 100,000 residents: 123.3 (4th highest)
> Most common natural disasters: Winter storms
[recirclink id=332010]

5. North Carolina
>All-hazards preparedness funding for FY 2015: $21,063,010
> Pct. change in hazard preparedness funding FY 2014-FY 2015: -0.2%
> EMTs per 100,000 residents: 102.4 (9th highest)
> Most common natural disasters: Hurricanes

6. Wisconsin
>All-hazards preparedness funding for FY 2015: $15,199,568
> Pct. change in hazard preparedness funding FY 2014-FY 2015: 0.2%
> EMTs per 100,000 residents: 108.0 (6th highest)
> Most common natural disasters: Flooding

7. Nebraska
>All-hazards preparedness funding for FY 2015: $6,741,803
> Pct. change in hazard preparedness funding FY 2014-FY 2015: -0.1%
> EMTs per 100,000 residents: N/A
> Most common natural disasters: Winter storms, tornadoes
[nativounit]
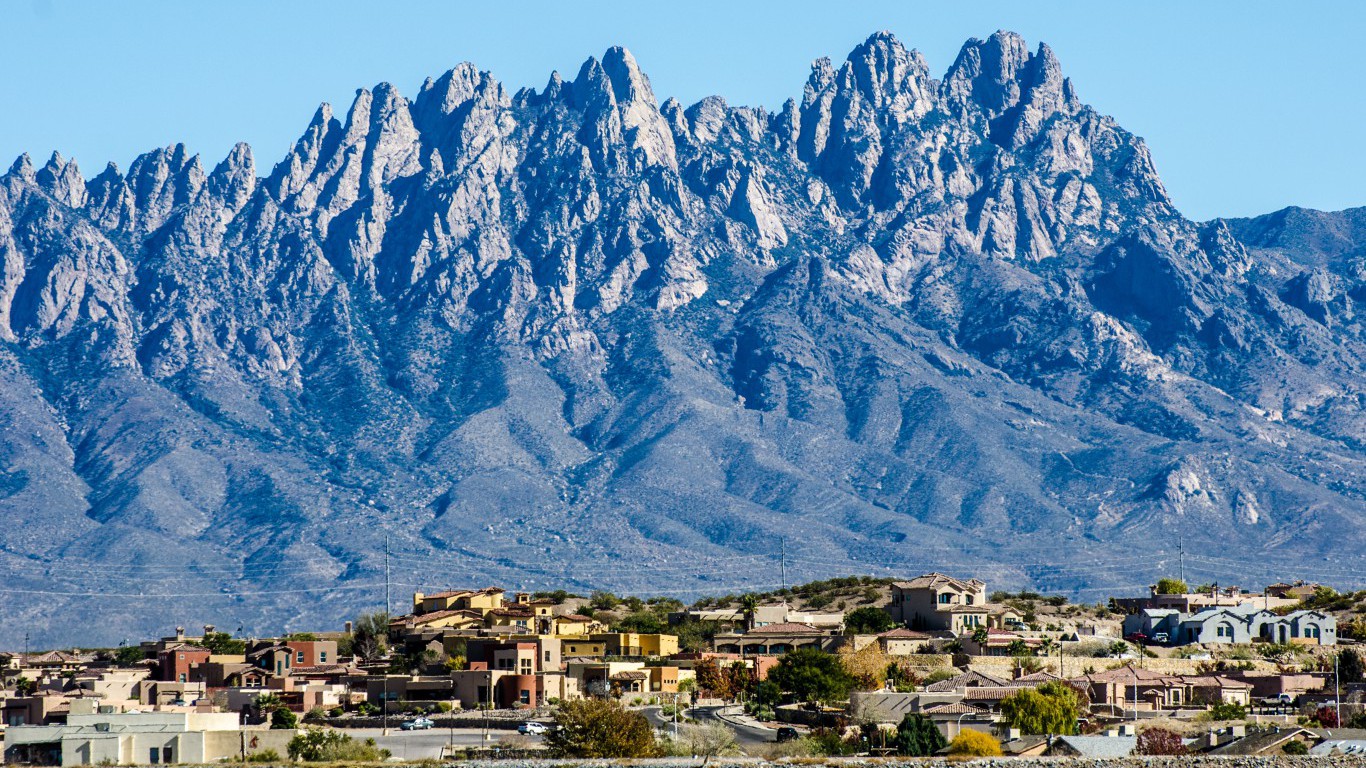
8. New Mexico
>All-hazards preparedness funding for FY 2015: $8,259,009
> Pct. change in hazard preparedness funding FY 2014-FY 2015: 1.1%
> EMTs per 100,000 residents: 77.2 (24th lowest)
> Most common natural disasters: Flooding, wildfires

9. Maryland
>All-hazards preparedness funding for FY 2015: $16,183,664
> Pct. change in hazard preparedness funding FY 2014-FY 2015: -0.3%
> EMTs per 100,000 residents: 78.8 (25th lowest)
> Most common natural disasters: Hurricanes, winter storms
[recirclink id=331922]
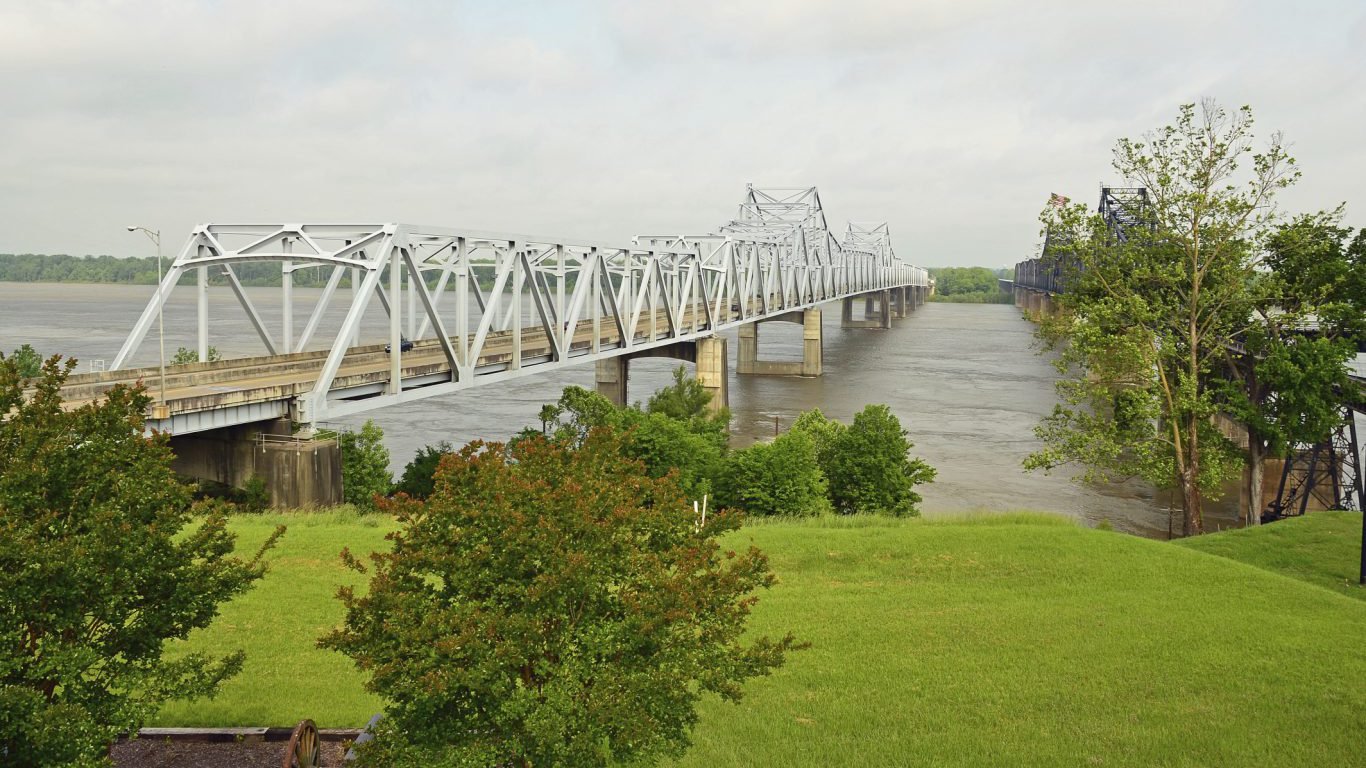
10. Mississippi
>All-hazards preparedness funding for FY 2015: $8,871,044
> Pct. change in hazard preparedness funding FY 2014-FY 2015: -0.3%
> EMTs per 100,000 residents: 70.8 (16th lowest)
> Most common natural disasters: Hurricanes, flooding

11. Illinois
>All-hazards preparedness funding for FY 2015: $25,584,922
> Pct. change in hazard preparedness funding FY 2014-FY 2015: -0.1%
> EMTs per 100,000 residents: 93.6 (16th highest)
> Most common natural disasters: Winter Storms, tornadoes

12. South Carolina
>All-hazards preparedness funding for FY 2015: $12,922,861
> Pct. change in hazard preparedness funding FY 2014-FY 2015: 0.8%
> EMTs per 100,000 residents: 106.2 (7th highest)
> Most common natural disasters: Hurricanes
[recirclink id=331805]
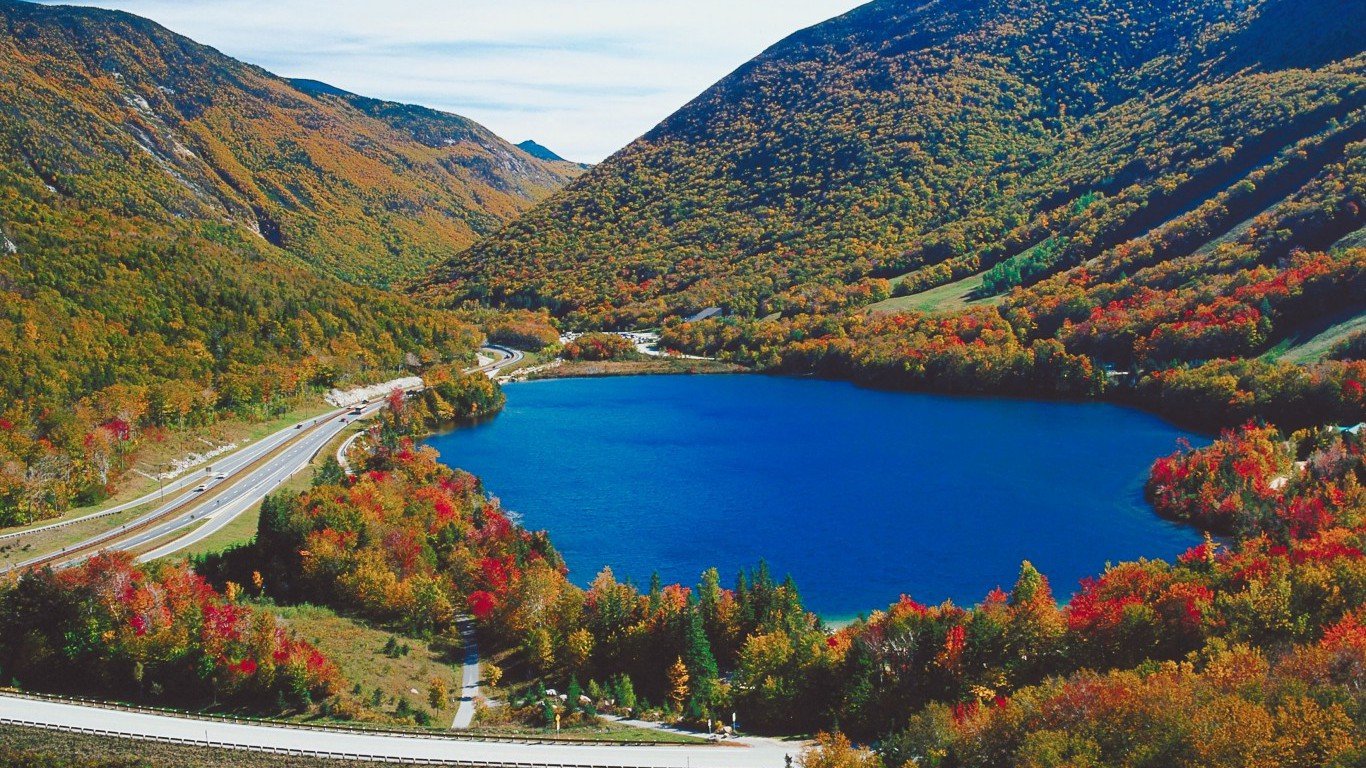
13. New Hampshire
>All-hazards preparedness funding for FY 2015: $5,916,845
> Pct. change in hazard preparedness funding FY 2014-FY 2015: -0.4%
> EMTs per 100,000 residents: 82.2 (23rd highest)
> Most common natural disasters: Winter storms

14. Delaware
>All-hazards preparedness funding for FY 2015: $5,447,654
> Pct. change in hazard preparedness funding FY 2014-FY 2015: -0.2%
> EMTs per 100,000 residents: 156.0 (the highest)
> Most common natural disasters: Hurricanes, flooding
[nativounit]

15. Virginia
>All-hazards preparedness funding for FY 2015: $21,345,217
> Pct. change in hazard preparedness funding FY 2014-FY 2015: 1.1%
> EMTs per 100,000 residents: 58.1 (10th lowest)
> Most common natural disasters: Hurricanes

16. Massachusetts
>All-hazards preparedness funding for FY 2015: $17,359,749
> Pct. change in hazard preparedness funding FY 2014-FY 2015: 0.7%
> EMTs per 100,000 residents: 85.7 (22nd highest)
> Most common natural disasters: Hurricanes, winter storms

17. Louisiana
>All-hazards preparedness funding for FY 2015: $12,036,695
> Pct. change in hazard preparedness funding FY 2014-FY 2015: -0.3%
> EMTs per 100,000 residents: 60.6 (12th lowest)
> Most common natural disasters: Hurricanes, flooding
[recirclink id=331648]
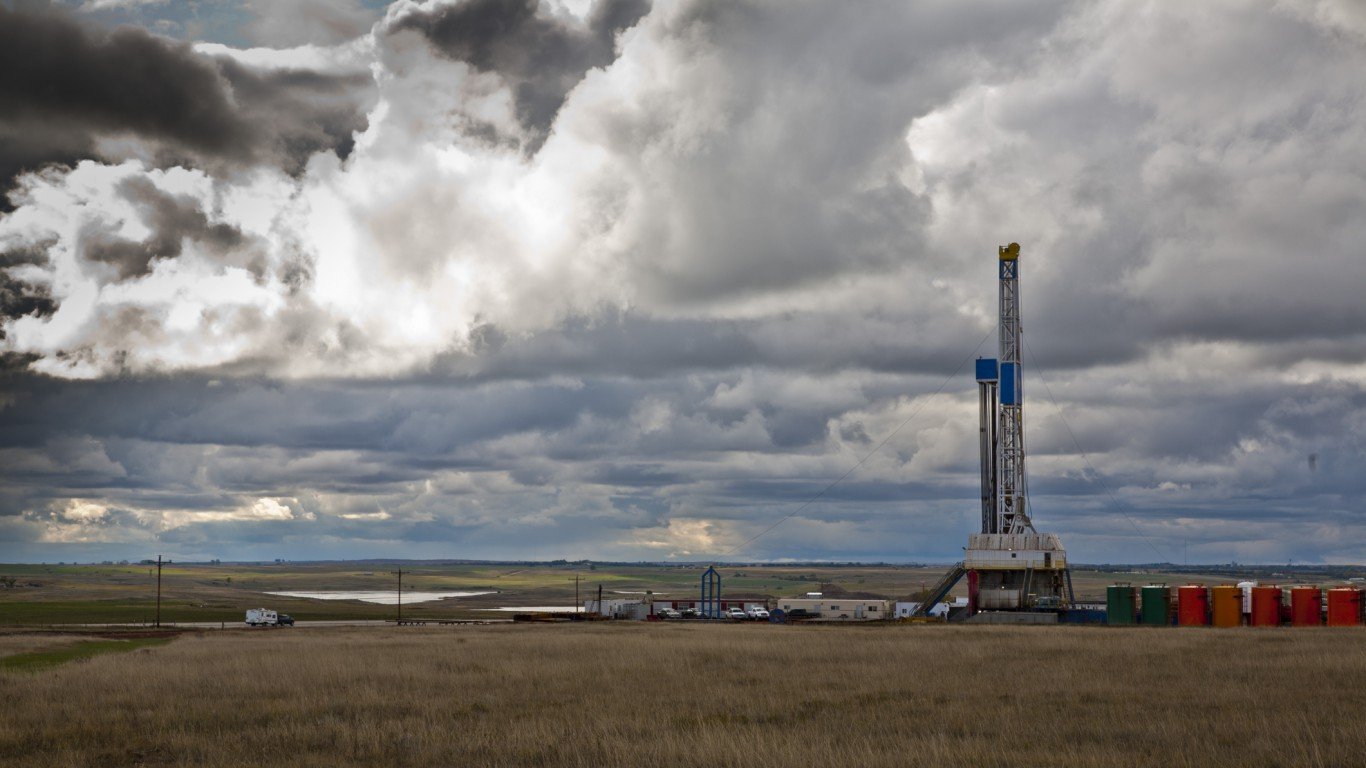
18. North Dakota
>All-hazards preparedness funding for FY 2015: $5,081,188
> Pct. change in hazard preparedness funding FY 2014-FY 2015: 0.4%
> EMTs per 100,000 residents: 142.0 (2nd highest)
> Most common natural disasters: Flooding, winter storms
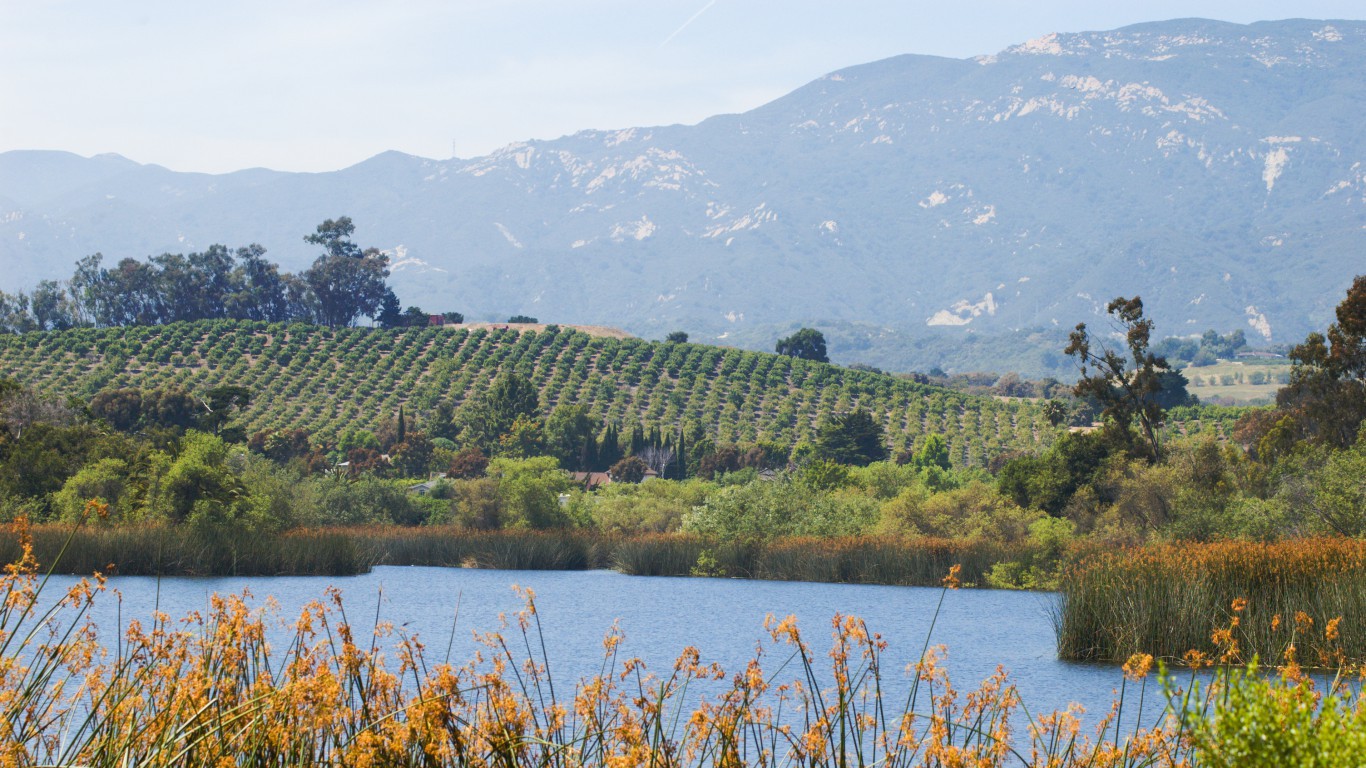
19. California
>All-hazards preparedness funding for FY 2015: $65,755,119
> Pct. change in hazard preparedness funding FY 2014-FY 2015: 0.1%
> EMTs per 100,000 residents: 43.1 (4th lowest)
> Most common natural disasters: Earthquakes, wildfires
[nativounit]

20. Alabama
>All-hazards preparedness funding for FY 2015: $12,127,751
> Pct. change in hazard preparedness funding FY 2014-FY 2015: -0.4%
> EMTs per 100,000 residents: 74.4 (18th lowest)
> Most common natural disasters: Hurricanes, flooding
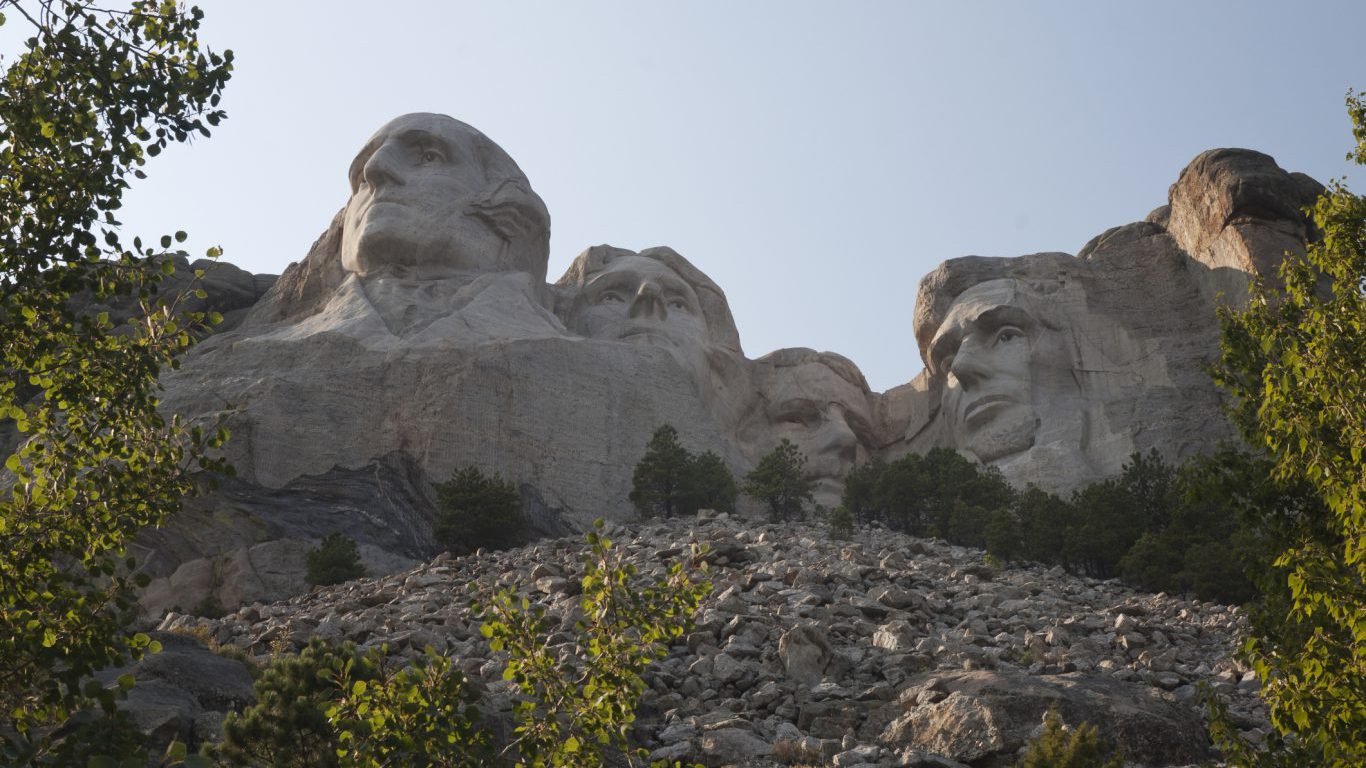
21. South Dakota
>All-hazards preparedness funding for FY 2015: $5,005,958
> Pct. change in hazard preparedness funding FY 2014-FY 2015: -0.8%
> EMTs per 100,000 residents: 100.8 (12th highest)
> Most common natural disasters: Flooding, winter storms

22. Connecticut
>All-hazards preparedness funding for FY 2015: $10,192,053
> Pct. change in hazard preparedness funding FY 2014-FY 2015: -0.5%
> EMTs per 100,000 residents: 89.0 (21st highest)
> Most common natural disasters: Winter storms, hurricanes
[nativounit]

23. New Jersey
>All-hazards preparedness funding for FY 2015: $21,428,540
> Pct. change in hazard preparedness funding FY 2014-FY 2015: -0.3%
> EMTs per 100,000 residents: 89.1 (20th highest)
> Most common natural disasters: Hurricanes, winter storms
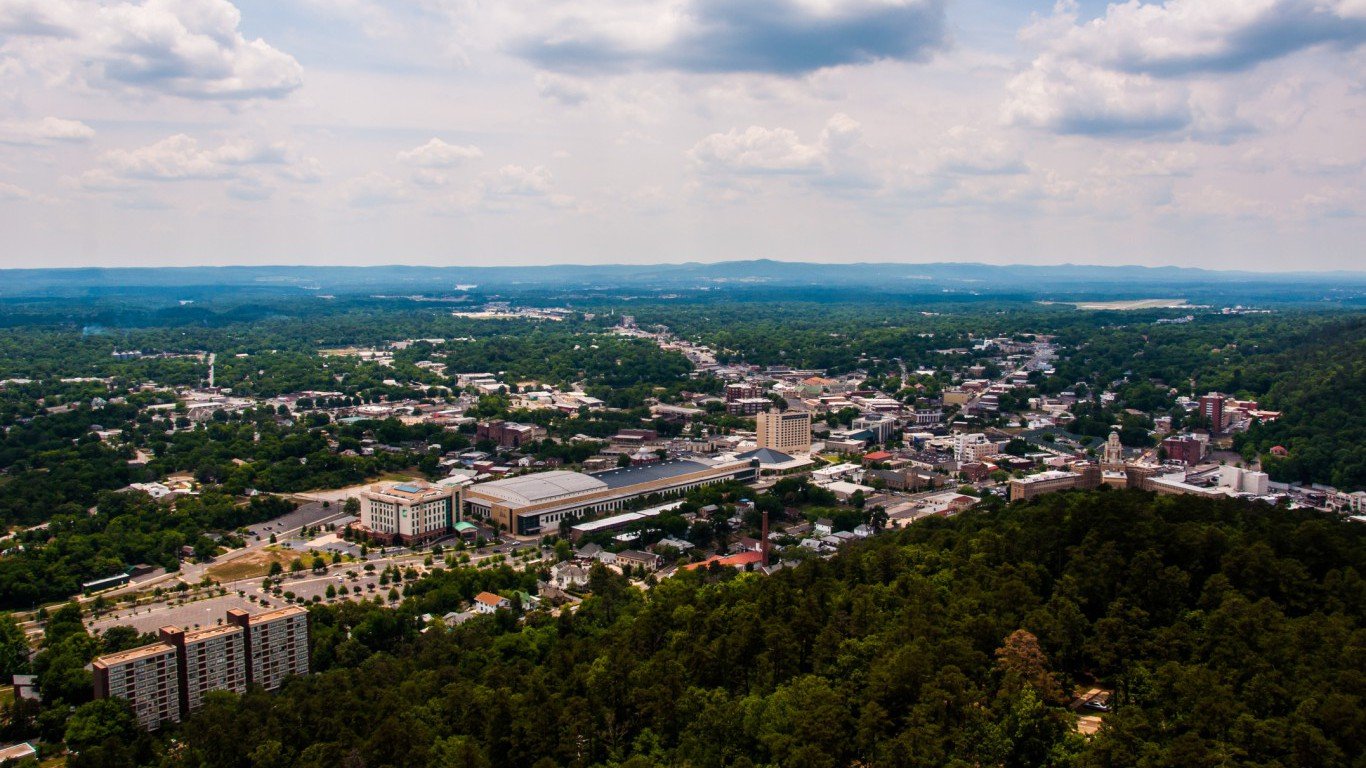
24. Arkansas
>All-hazards preparedness funding for FY 2015: $8,641,726
> Pct. change in hazard preparedness funding FY 2014-FY 2015: -0.2%
> EMTs per 100,000 residents: 74.8 (19th lowest)
> Most common natural disasters: Flooding, tornadoes
[recirclink id=331254]

25. Rhode Island
>All-hazards preparedness funding for FY 2015: $5,472,107
> Pct. change in hazard preparedness funding FY 2014-FY 2015: 0.1%
> EMTs per 100,000 residents: 75.8 (20th lowest)
> Most common natural disasters: Hurricanes, winter storms

26. Missouri
>All-hazards preparedness funding for FY 2015: $14,652,835
> Pct. change in hazard preparedness funding FY 2014-FY 2015: -0.5%
> EMTs per 100,000 residents: 101.3 (11th highest)
> Most common natural disasters: Tornadoes, flooding

27. Tennessee
>All-hazards preparedness funding for FY 2015: $15,313,207
> Pct. change in hazard preparedness funding FY 2014-FY 2015: -0.2%
> EMTs per 100,000 residents: 102.1 (10th highest)
> Most common natural disasters: Tornadoes, flooding
[nativounit]

28. Kansas
>All-hazards preparedness funding for FY 2015: $8,813,560
> Pct. change in hazard preparedness funding FY 2014-FY 2015: -0.4%
> EMTs per 100,000 residents: 94.4 (15th highest)
> Most common natural disasters: Tornadoes, flooding
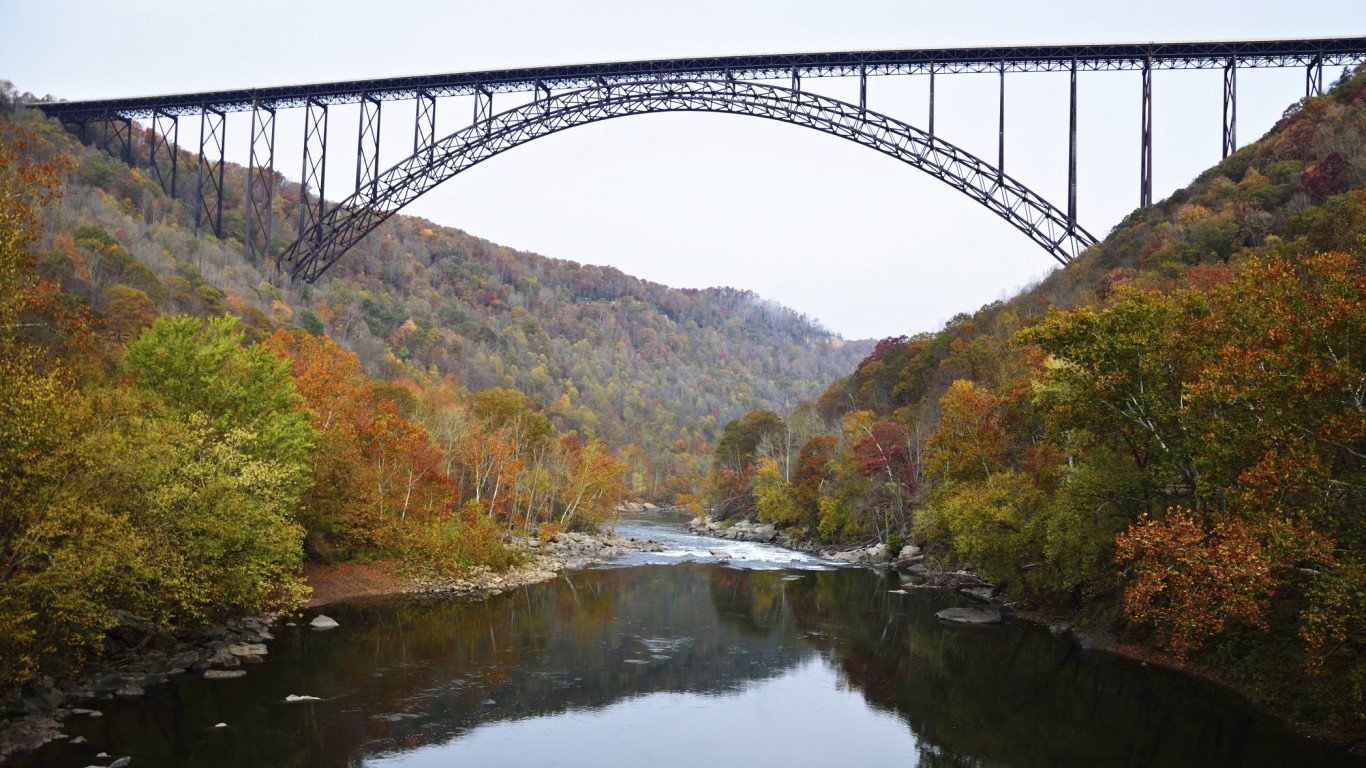
29. West Virginia
>All-hazards preparedness funding for FY 2015: $6,708,426
> Pct. change in hazard preparedness funding FY 2014-FY 2015: -0.5%
> EMTs per 100,000 residents: 127.5 (3rd highest)
> Most common natural disasters: Winter storms
[recirclink id=331165]

30. Iowa
>All-hazards preparedness funding for FY 2015: $8,869,886
> Pct. change in hazard preparedness funding FY 2014-FY 2015: 0.0%
> EMTs per 100,000 residents: 76.9 (23rd lowest)
> Most common natural disasters: Tornadoes, flooding

31. Ohio
>All-hazards preparedness funding for FY 2015: $25,363,476
> Pct. change in hazard preparedness funding FY 2014-FY 2015: -0.5%
> EMTs per 100,000 residents: 91.2 (17th highest)
> Most common natural disasters: Flooding, winter storms

32. Oklahoma
>All-hazards preparedness funding for FY 2015: $10,403,441
> Pct. change in hazard preparedness funding FY 2014-FY 2015: -0.1%
> EMTs per 100,000 residents: 89.2 (19th highest)
> Most common natural disasters: Tornadoes, winter storms
[recirclink id=330933]
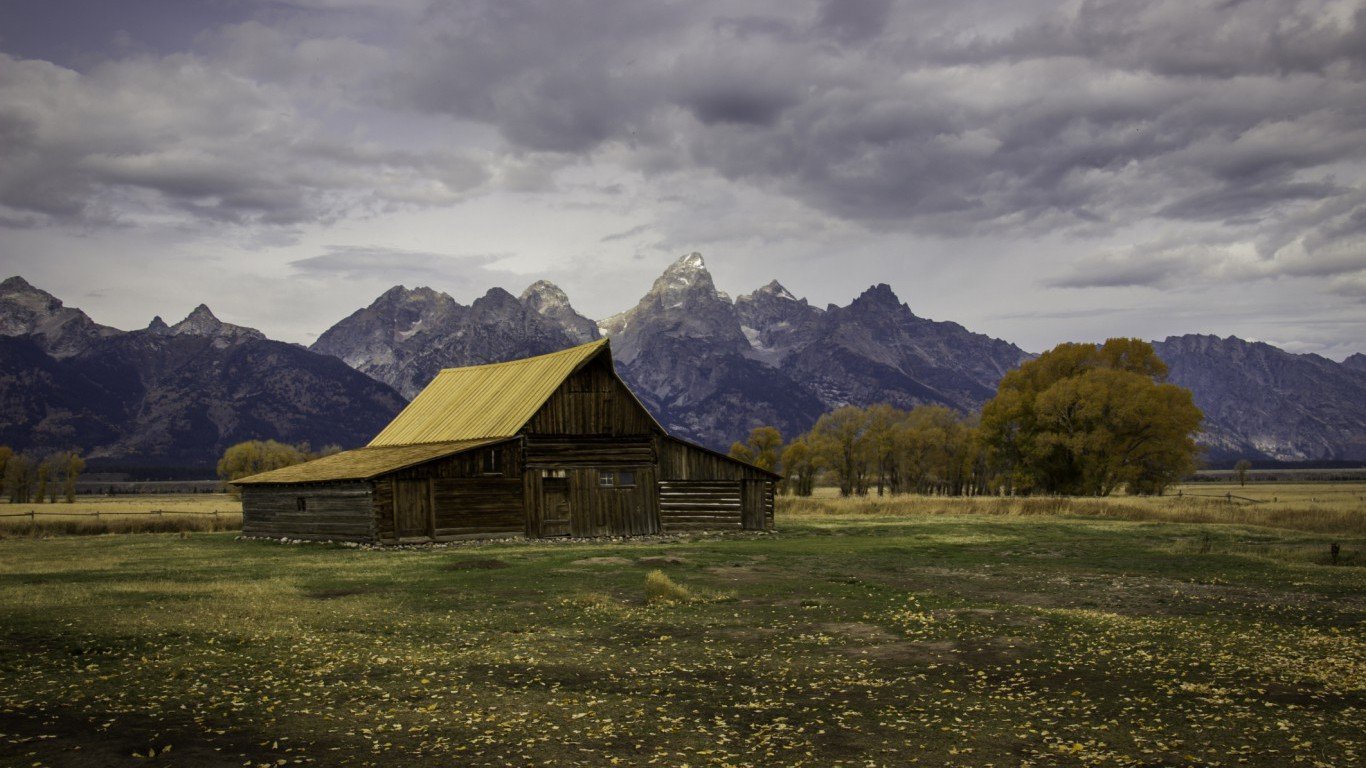
33. Wyoming
>All-hazards preparedness funding for FY 2015: $5,039,970
> Pct. change in hazard preparedness funding FY 2014-FY 2015: 0.3%
> EMTs per 100,000 residents: 114.7 (5th highest)
> Most common natural disasters: Forest fires, flooding

34. Pennsylvania
>All-hazards preparedness funding for FY 2015: $27,656,271
> Pct. change in hazard preparedness funding FY 2014-FY 2015: -0.5%
> EMTs per 100,000 residents: 96.3 (14th highest)
> Most common natural disasters: Flooding
[nativounit]
35. Montana
>All-hazards preparedness funding for FY 2015: $5,254,112
> Pct. change in hazard preparedness funding FY 2014-FY 2015: -0.2%
> EMTs per 100,000 residents: 58.6 (11th lowest)
> Most common natural disasters: Wildfires

36. Arizona
>All-hazards preparedness funding for FY 2015: $15,813,534
> Pct. change in hazard preparedness funding FY 2014-FY 2015: 0.0%
> EMTs per 100,000 residents: 55.3 (9th lowest)
> Most common natural disasters: Flooding, forest fires

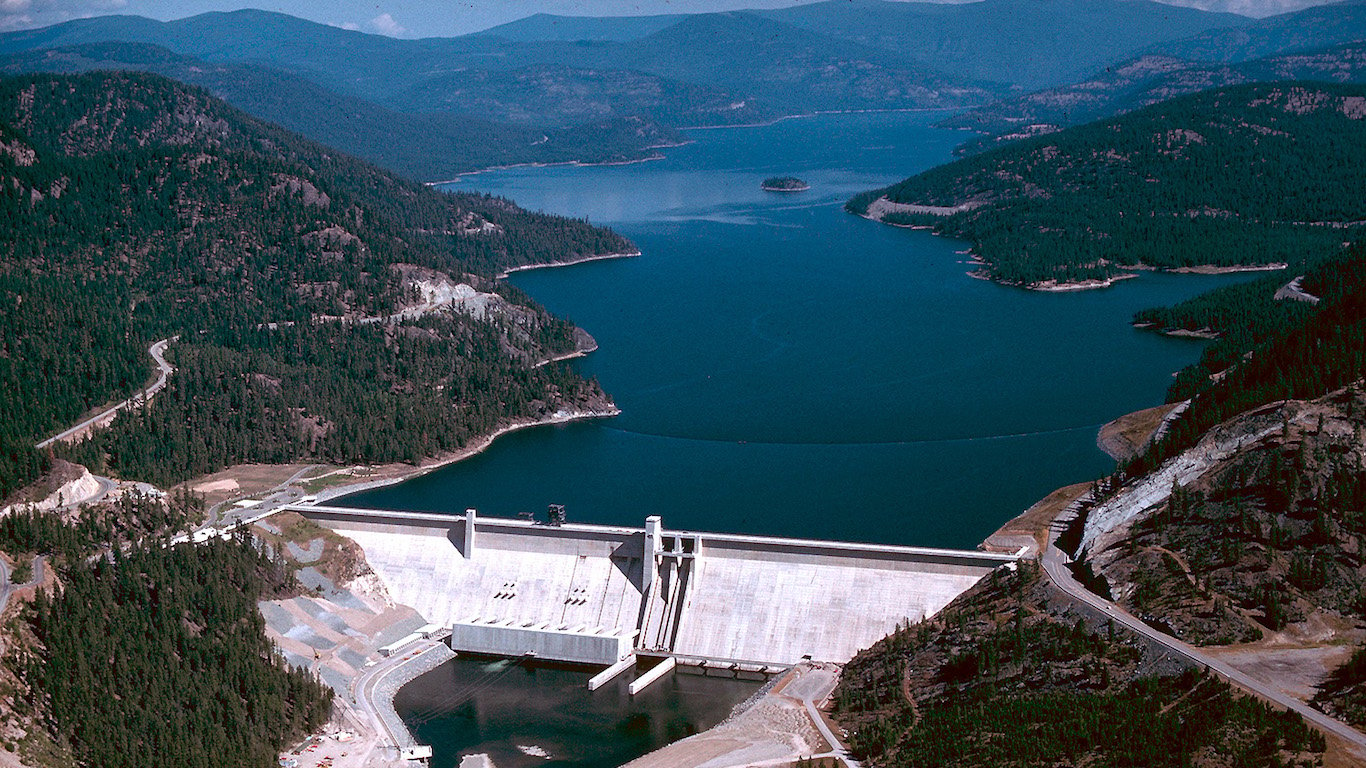
37. Washington
>All-hazards preparedness funding for FY 2015: $16,352,719
> Pct. change in hazard preparedness funding FY 2014-FY 2015: 0.1%
> EMTs per 100,000 residents: 40.8 (3rd lowest)
> Most common natural disasters: Earthquakes, flooding
[recirclink id=330390]
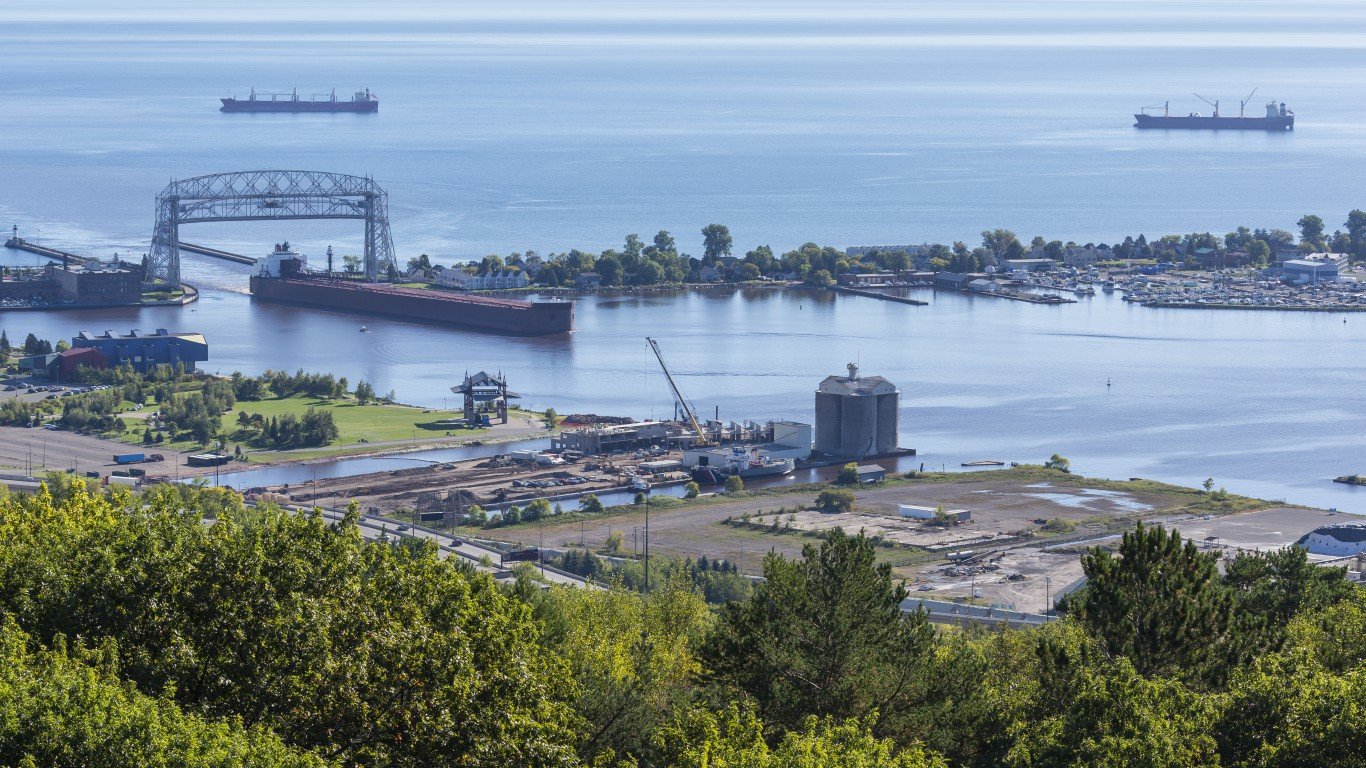
38. Minnesota
>All-hazards preparedness funding for FY 2015: $14,782,695
> Pct. change in hazard preparedness funding FY 2014-FY 2015: 0.6%
> EMTs per 100,000 residents: 80.3 (24th highest)
> Most common natural disasters: Winter storms

39. Indiana
>All-hazards preparedness funding for FY 2015: $15,526,792
> Pct. change in hazard preparedness funding FY 2014-FY 2015: -0.2%
> EMTs per 100,000 residents: 79.1 (25th highest)
> Most common natural disasters: Tornadoes, flooding
[nativounit]
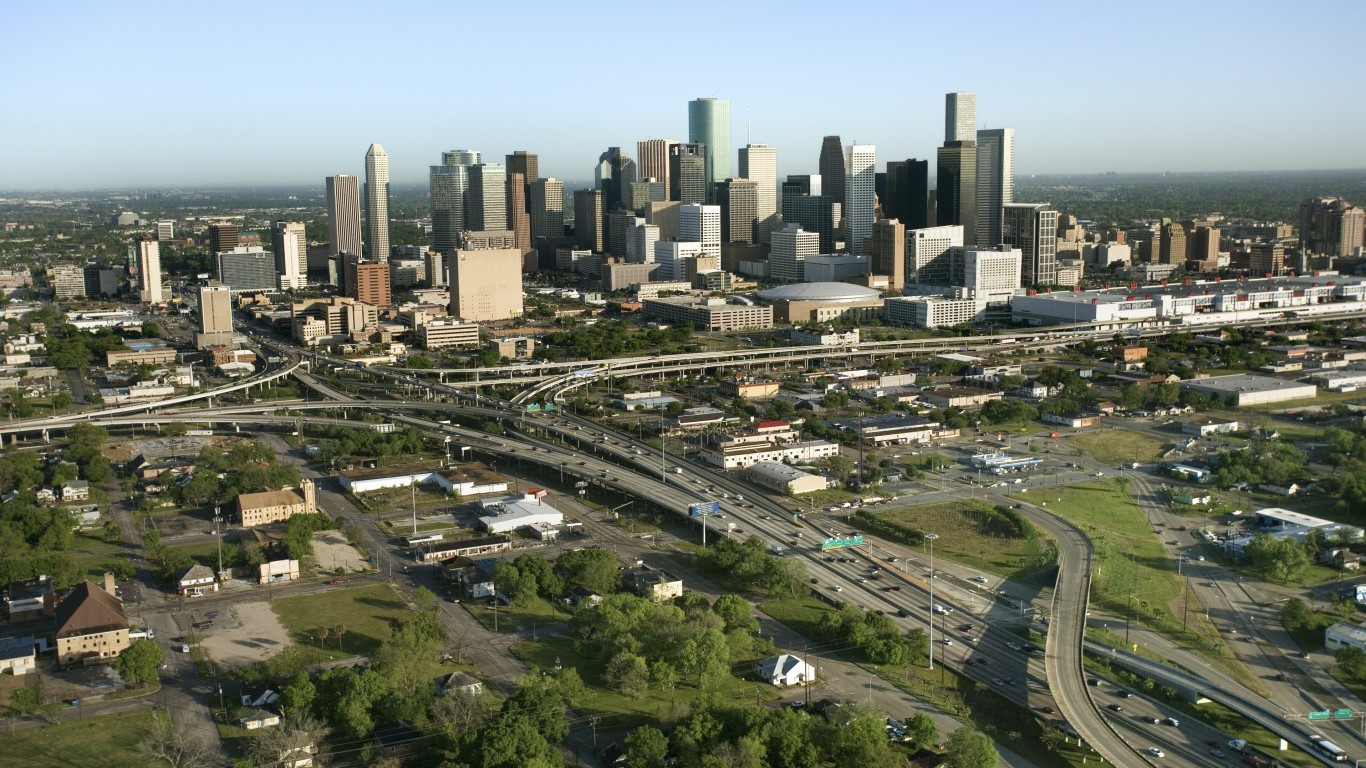
40. Texas
>All-hazards preparedness funding for FY 2015: $53,485,837
> Pct. change in hazard preparedness funding FY 2014-FY 2015: 0.3%
> EMTs per 100,000 residents: 67.8 (15th lowest)
> Most common natural disasters: Tornadoes, hurricanes, flooding
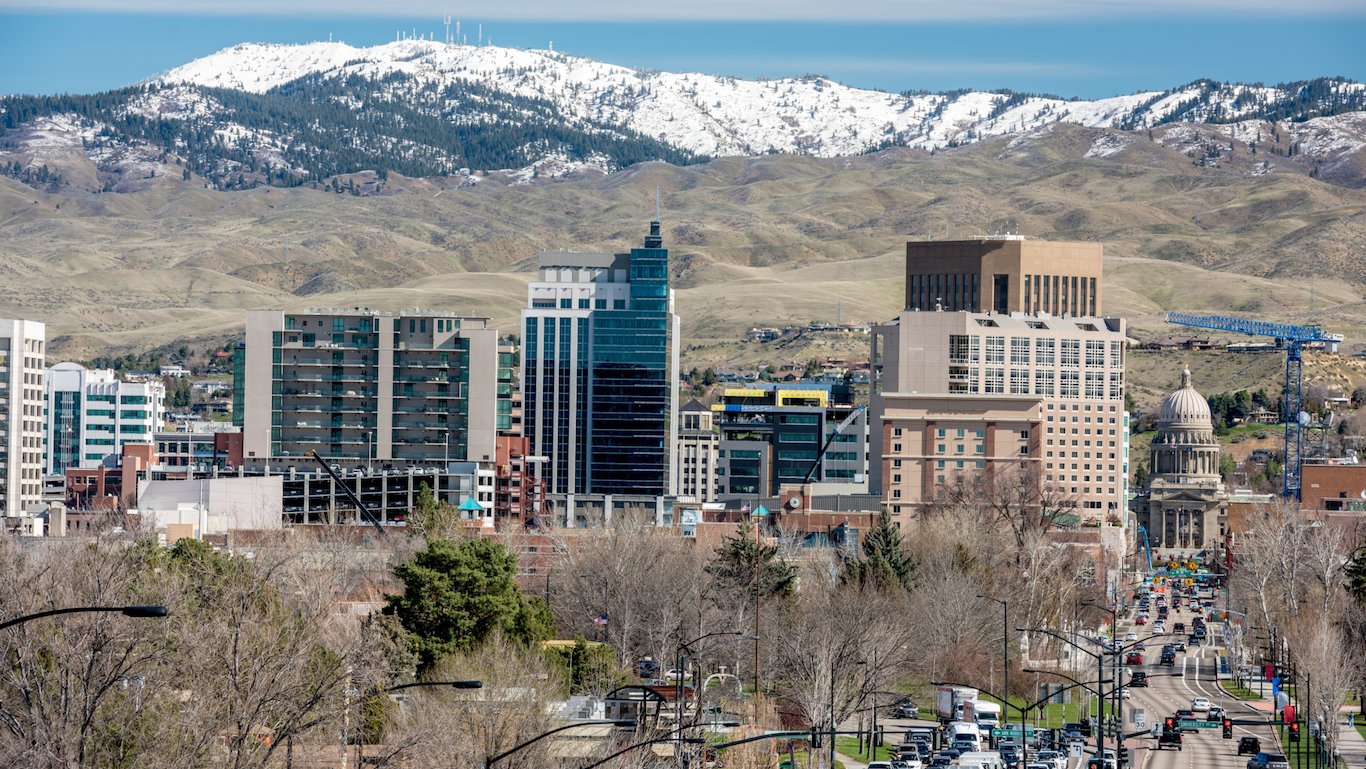
41. Idaho
>All-hazards preparedness funding for FY 2015: $6,252,645
> Pct. change in hazard preparedness funding FY 2014-FY 2015: 0.0%
> EMTs per 100,000 residents: 66.7 (14th lowest)
> Most common natural disasters: Flooding, forest fires
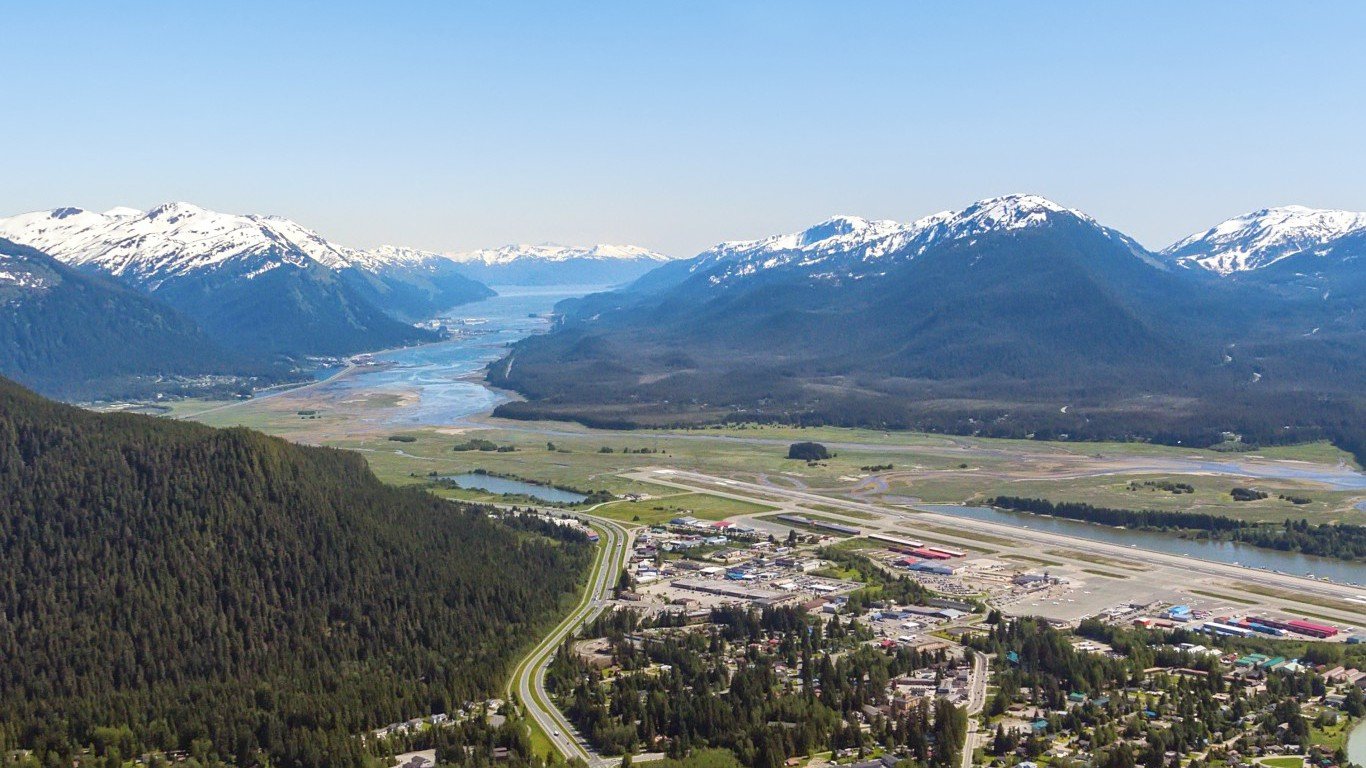
42. Alaska
>All-hazards preparedness funding for FY 2015: $5,152,380
> Pct. change in hazard preparedness funding FY 2014-FY 2015: 1.1%
> EMTs per 100,000 residents: 52.9 (8th lowest)
> Most common natural disasters: Winter Storms, freezing
[nativounit]

43. Utah
>All-hazards preparedness funding for FY 2015: $8,582,188
> Pct. change in hazard preparedness funding FY 2014-FY 2015: 0.3%
> EMTs per 100,000 residents: 76.8 (22nd lowest)
> Most common natural disasters: Flooding

44. Michigan
>All-hazards preparedness funding for FY 2015: $22,758,630
> Pct. change in hazard preparedness funding FY 2014-FY 2015: 0.1%
> EMTs per 100,000 residents: 65.6 (13th lowest)
> Most common natural disasters: Winter storms
[recirclink id=330389]

45. Colorado
>All-hazards preparedness funding for FY 2015: $13,031,374
> Pct. change in hazard preparedness funding FY 2014-FY 2015: 0.3%
> EMTs per 100,000 residents: 76.7 (21st lowest)
> Most common natural disasters: Wildfires, flooding

46. Oregon
>All-hazards preparedness funding for FY 2015: $10,557,527
> Pct. change in hazard preparedness funding FY 2014-FY 2015: -0.3%
> EMTs per 100,000 residents: 47.9 (6th lowest)
> Most common natural disasters: Flooding, earthquakes
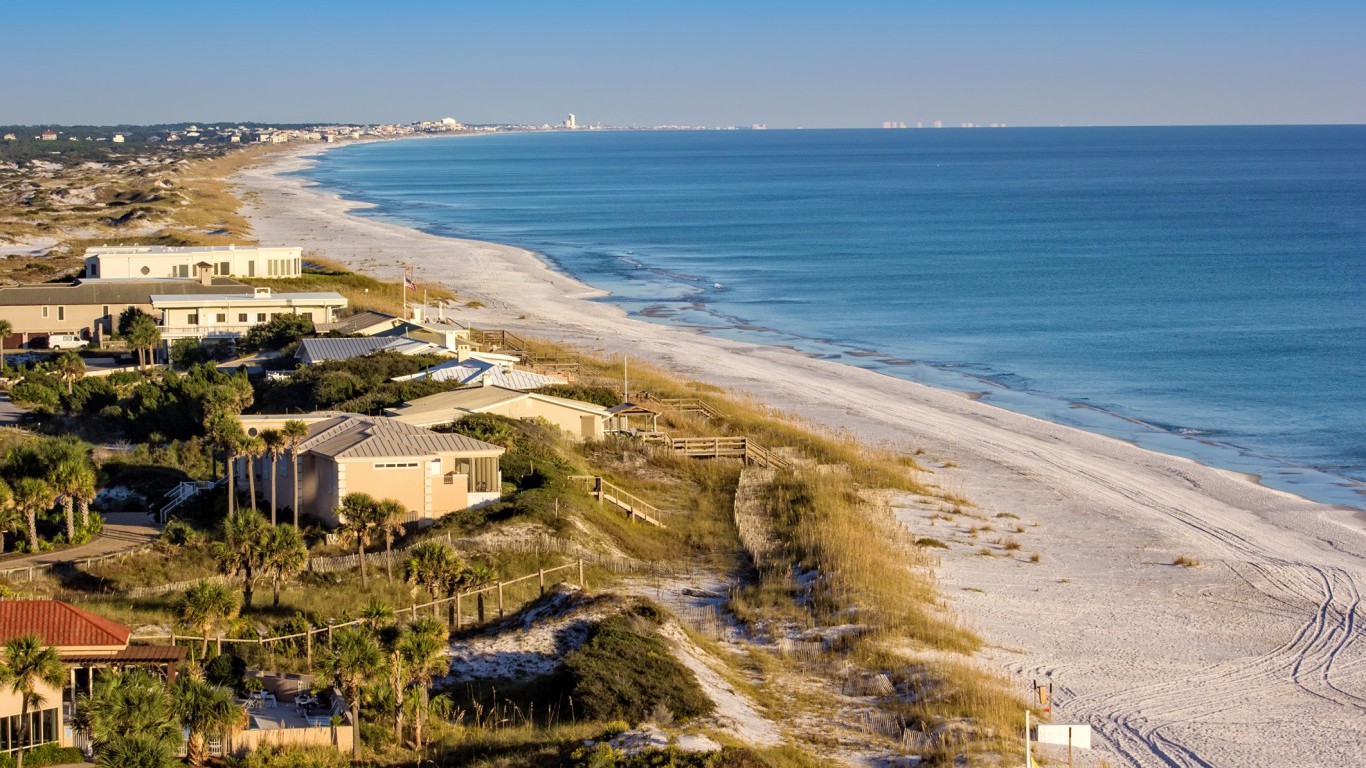
47. Florida
>All-hazards preparedness funding for FY 2015: $41,148,138
> Pct. change in hazard preparedness funding FY 2014-FY 2015: 0.5%
> EMTs per 100,000 residents: 48.3 (7th lowest)
> Most common natural disasters: Hurricanes
[nativounit]
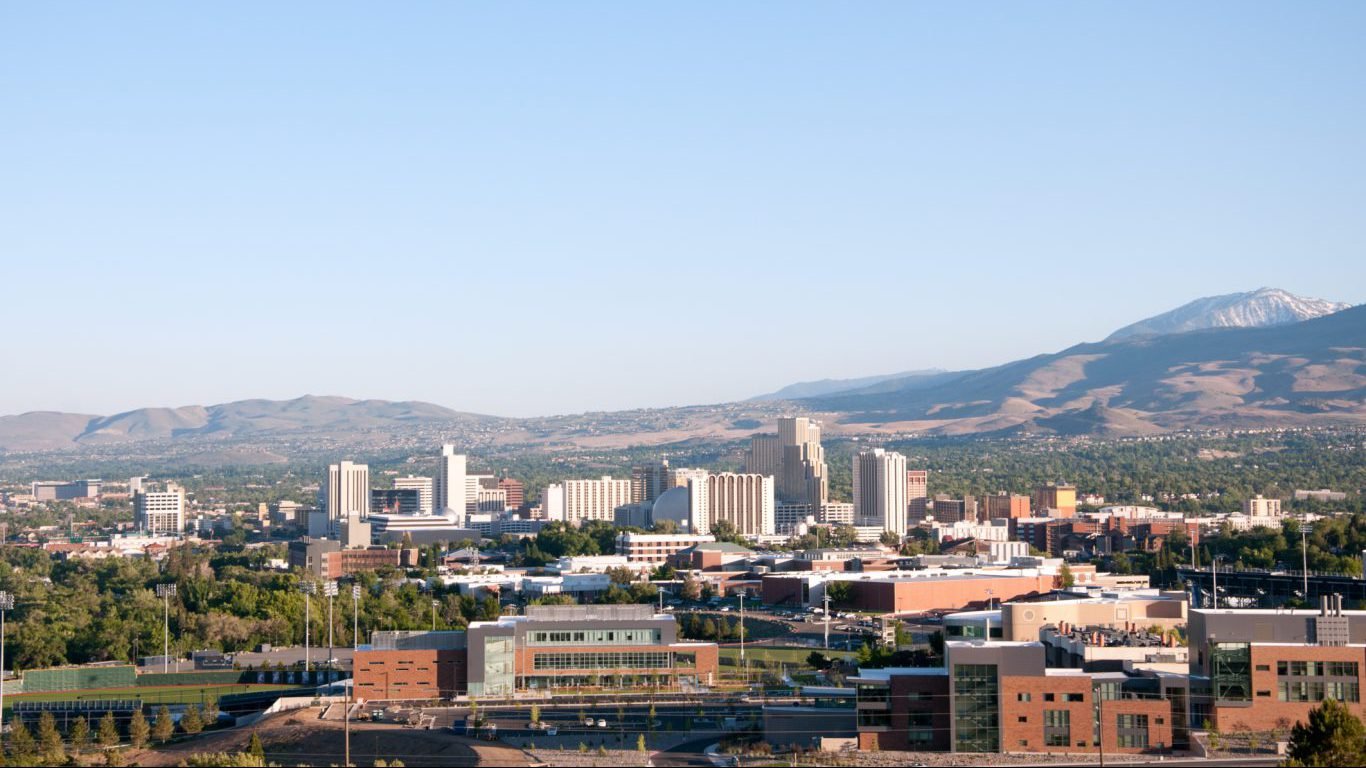
48. Nevada
>All-hazards preparedness funding for FY 2015: $8,680,424
> Pct. change in hazard preparedness funding FY 2014-FY 2015: 0.0%
> EMTs per 100,000 residents: 45.8 (5th lowest)
> Most common natural disasters: Flooding, wildfires
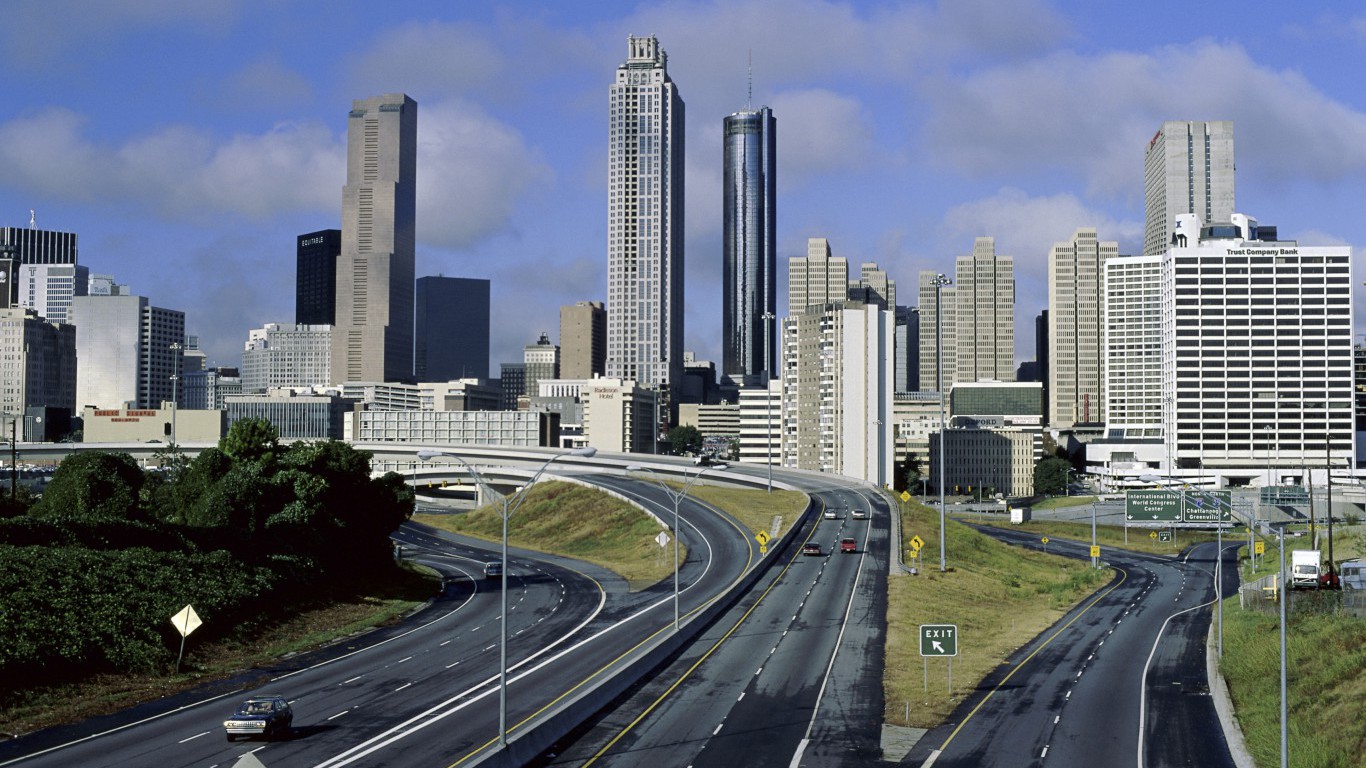
49. Georgia
>All-hazards preparedness funding for FY 2015: $21,954,511
> Pct. change in hazard preparedness funding FY 2014-FY 2015: -0.3%
> EMTs per 100,000 residents: 90.4 (18th highest)
> Most common natural disasters: Hurricanes, flooding
[recirclink id=330273]
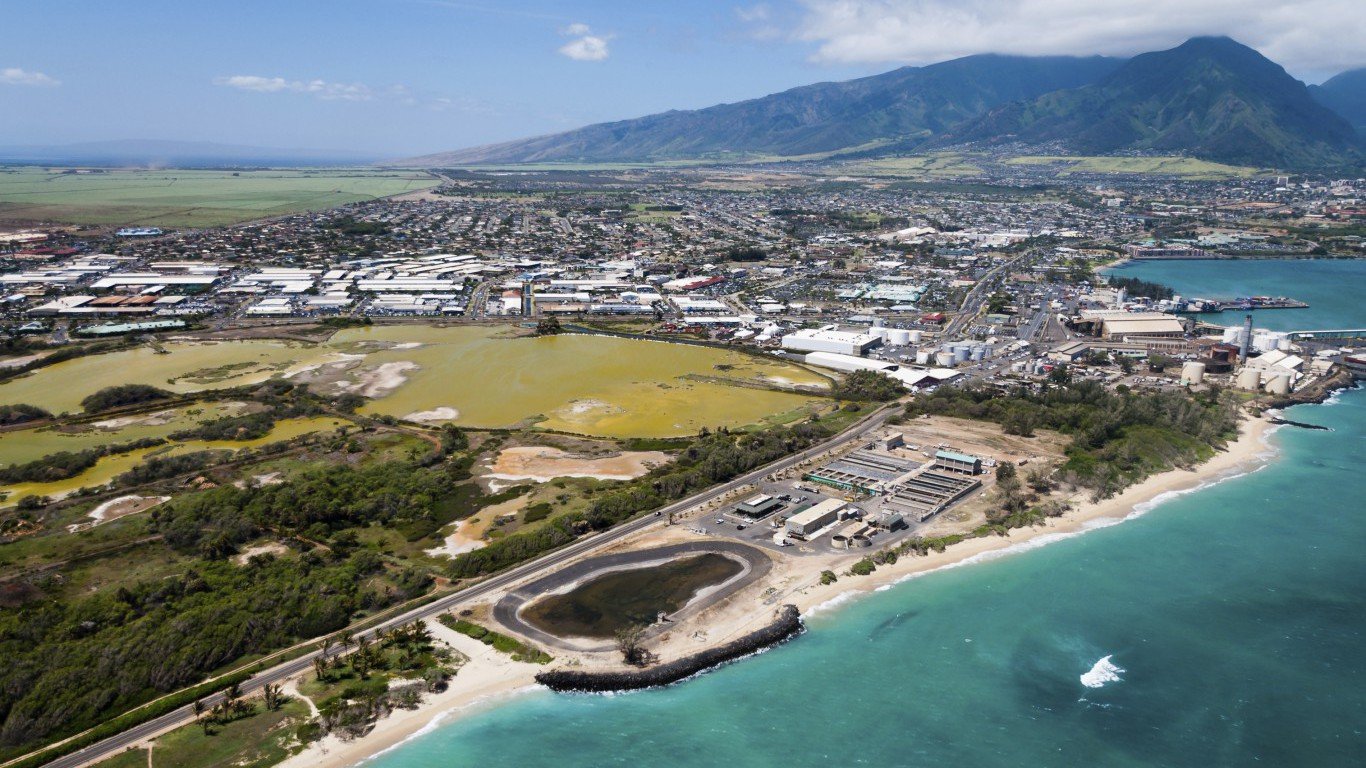
50. Hawaii
>All-hazards preparedness funding for FY 2015: $6,111,177
> Pct. change in hazard preparedness funding FY 2014-FY 2015: 0.1%
> EMTs per 100,000 residents: N/A
> Most common natural disasters: Tidal waves, tropical storms
Methodology
To determine the states most and least prepared for disaster, 24/7 Wall St compiled an index of 16 measures related to disaster preparedness. The measures were culled from two model studies, the Trust for America’s Health 2012 Ready or Not? Protecting the Public’s Health from Diseases, Disasters, and Bioterrorism report and the National Health Security Preparedness Index, both programs of the Robert Wood Johnson Foundation. In every case, data were extracted from the original source, and updated to reflect the most recent available data. The level of funding for public health services for fiscal years 2014 and 2015, the number of minutes for public health staff to report for duty, and the share of 19 to 35 month olds vaccinated against pertussis came from the Center for Disease Control. Data on whether or not a state requires Medicaid coverage to include flu shots with no co-pay for beneficiaries under the age of 65 came from the Kaiser Family Foundation. Data on whether or not a state has a complete climate change adaptation plan came from the Center for Climate and Energy Solutions. Data on whether or not a state mandates its child-care centers to have a multi-hazard written evacuation and relocation plan came from the Readiness and Emergency Management for Schools Technical Assistance Center. Data on a state accreditation came from the Emergency Management Accreditation Program. Data on Nurse Licensure Compacts came from the Nurse Licensing Map website. Self-reporting from states on their capacity to respond to a disease outbreak and maintenance of LRN-C chemical capability came from the Trust For America’s Health 2012 report. The number of staffed beds came from the American Hospital Directory, and was adjusted for population using data from the Census Bureau. The number of emergency management directors, emergency medical technicians, physicians, and surgeons came from the Bureau of Labor Statistics and were adjusted for population with Census Bureau data. Data on biosafety training came from the Trust for America’s Health 2015 Outbreaks: Protecting Americans from Infectious Diseases report. The most common natural disasters in a state, which were not included in the index, came from the Federal Emergency Management Agency, and other sources.
Click here to see the states least prepared for disasters.
Contact [email protected] for any questions or corrections.