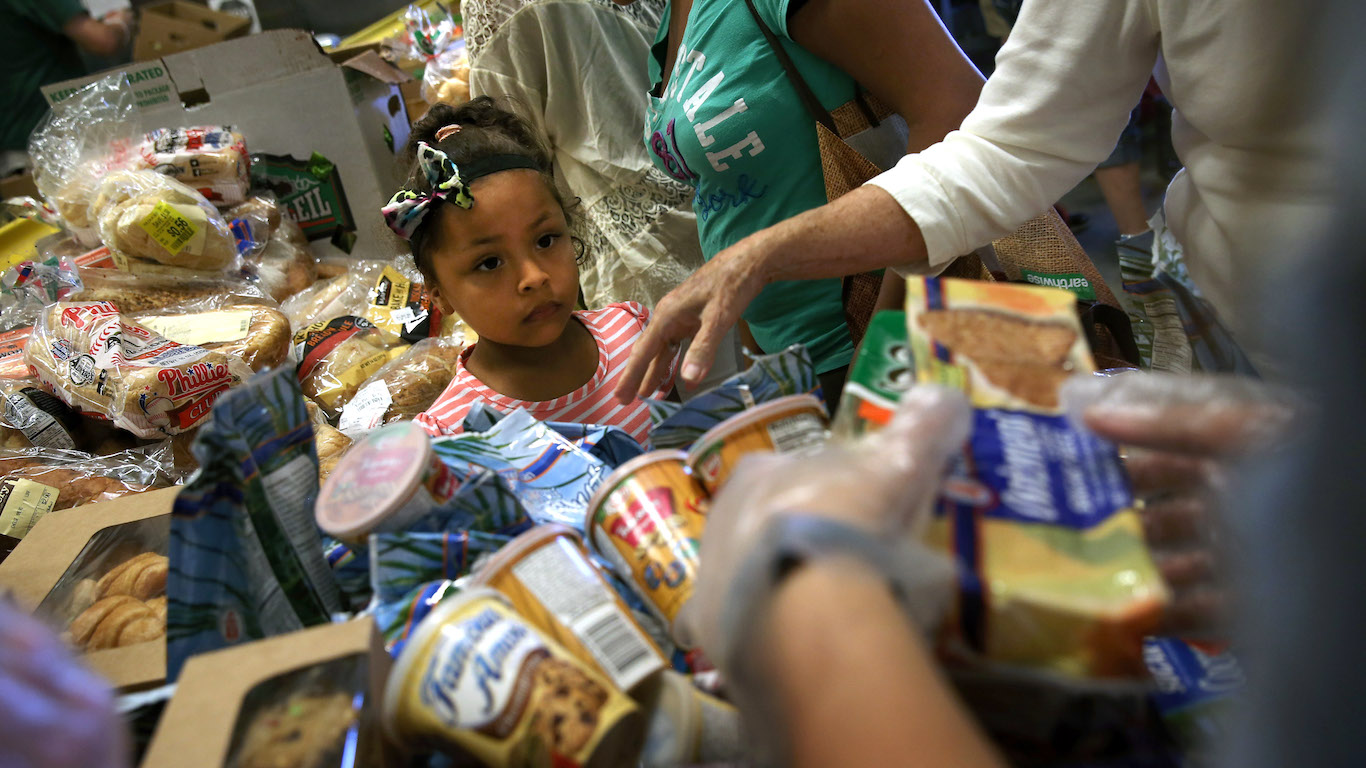
[cnxvideo id=”655236″ placement=”ros”]Most agree the poor deserve public help. But where should the line dividing poor from non-poor be set? The U.S. government answered this question in 1963 by by setting official poverty thresholds according to an estimate of basic need. This figure is updated every year for price changes. Today, the annual poverty level income is $12,060 for an individual, and $24,600 for a family of four.
Poverty thresholds are the same nationwide, with no separate guidance for different states or cities and the varied conditions within those areas. Poverty thresholds do not account for differences in cost of living, taxes, and government assistance programs — all of which can be different not only by state but sometimes even by city.
To help address the limitations of the official poverty threshold and to help gauge the effectiveness of anti-poverty programs, Census researchers developed the supplemental poverty measure. The SPM extends the official measure by taking assistance programs and additional cost factors into account. The SPM revealed that Social Security and refundable tax credits helped raise 26.1 million and 8.2 million people, respectively, out of poverty last year. When these factors are added to the calculation there is a reduction in poverty overall of 8.2% and 2.5%. The alternative measure also shows greater variation in poverty between states. In some states, poverty is much worse than the official measure suggests, while in others it is better.
24/7 Wall St. reviewed states where the difference between the supplemental poverty rate and the official poverty rate was the largest. We also reviewed states where the SPM was lower than the official rate. While the supplemental poverty rate is far lower than the official rate in some states like Louisiana or Mississippi, both remain among the poorest in the nation by either measure. Others, like West Virginia or Missouri have supplemental poverty rates below the nationwide rate. Using the alternative measure, high-income states like New York and California have among the highest poverty rates in the country.
Click here to see the states where poverty is worse than you think.
Click here to see the states where poverty is not as bad as you think.
Click here to see our detailed findings and methodology.
States Where Poverty is Worse Than You Think

13. Colorado
> Supplemental poverty rate: 11.2% (14th lowest)
> Official poverty rate: 10.2% (9th lowest)
> Cost of living: 3.2% more than national avg. (11th highest)
> Uninsured rate: 7.5% (23rd lowest)
After accounting for a wide range of factors not considered in the official poverty rate — including the tax code, nondiscretionary spending, and cost of living — some 11.2% of Colorado residents live in poverty. In comparison, 10.2% of state residents live below the official poverty threshold. The supplemental poverty measure is often used to gauge the efficacy of government tax breaks and programs aimed at relieving poverty. In Colorado, goods and services cost an average of 3% more than they do nationwide, and the state does not appear to be doing enough to offset those costs for its poorest residents.
Colorado is one of 13 states with a supplemental poverty rate at least 1 percentage point higher than its official poverty rate.
[in-text-ad]
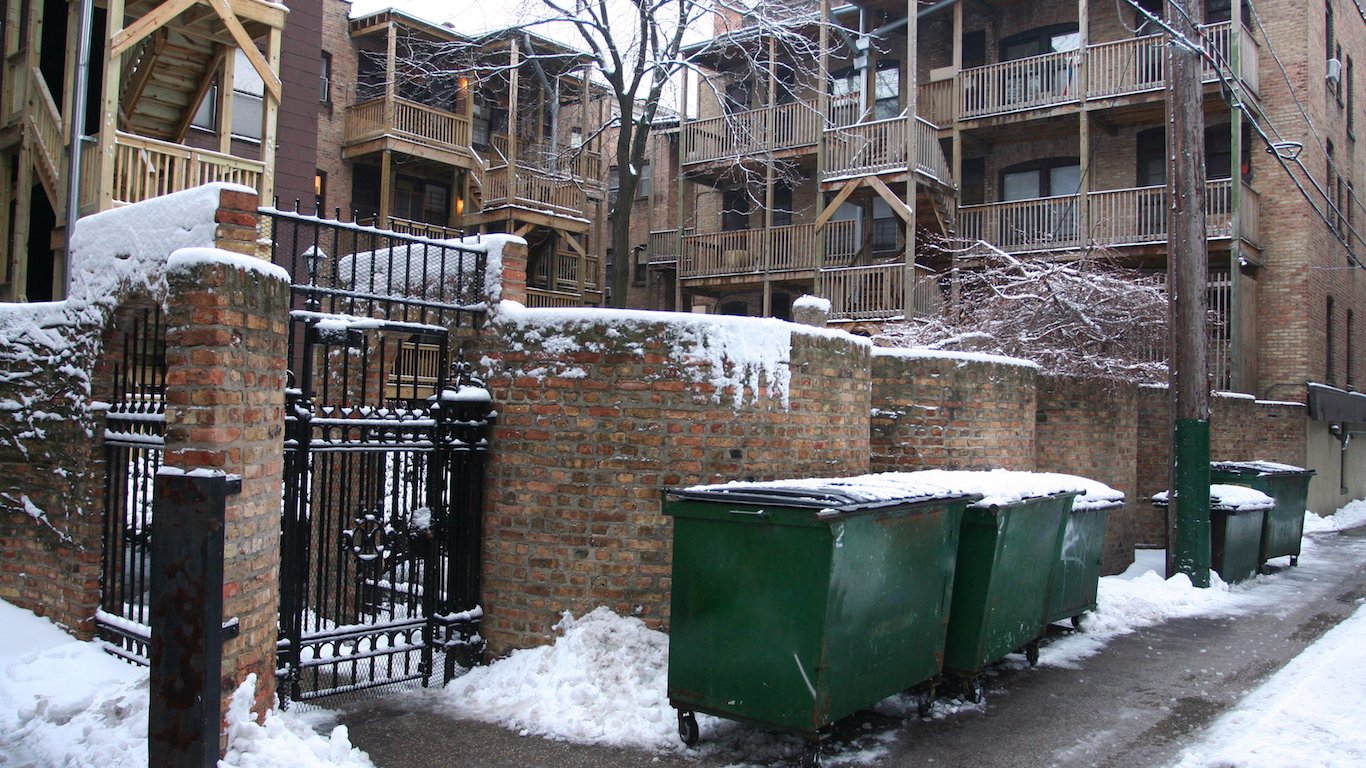
12. Illinois
> Supplemental poverty rate: 13.4% (23rd highest)
> Official poverty rate: 12.2% (25th lowest)
> Cost of living: 0.3% less than national avg. (15th highest)
> Uninsured rate: 6.5% (20th lowest)
The supplemental poverty rate in Illinois of 13.4% is higher than the state’s 12.2% official poverty rate. Unlike the traditional poverty measure, the supplemental poverty rate accounts for tax burdens, and some Illinois residents are heavily taxed. The amount Illinois residents pay in property taxes is more than in all but four other states — and real estate taxes affect homeowners and renters alike.
While a significant portion of people in poverty work full-time, poverty is usually a consequence of unemployment. In Illinois, some 5.9% of the labor force was out of work in 2016, a full percentage point higher than the U.S. unemployment rate that year.
[recirclink id=420229]
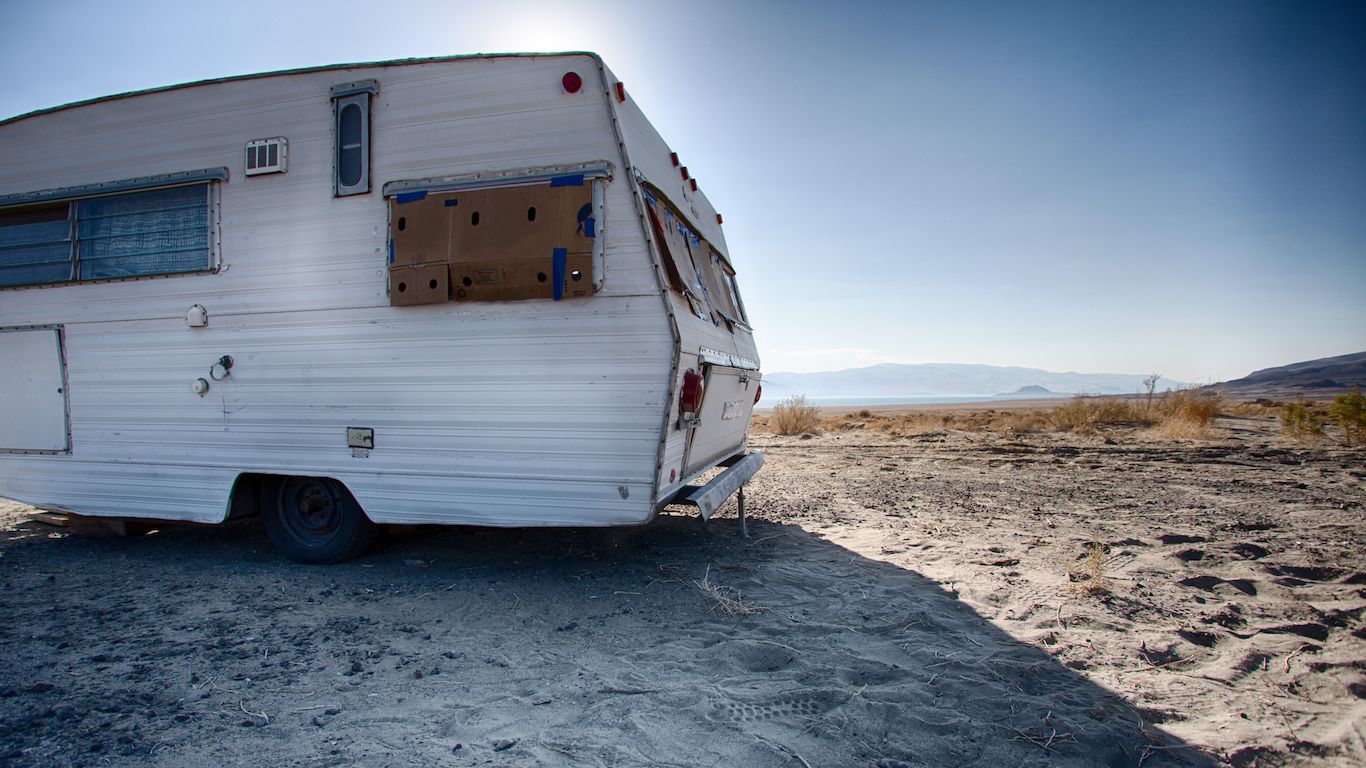
11. Nevada
> Supplemental poverty rate: 14.8% (12th highest)
> Official poverty rate: 13.3% (20th highest)
> Cost of living: 2.0% less than national avg. (19th highest)
> Uninsured rate: 11.4% (8th highest)
Out-of-pocket medical expenses can be a considerable financial burden for anyone who makes regular doctor visits — and especially for those without health insurance. In Nevada, some 11.4% of the population lacks health insurance, one of the largest shares of any state and far more than the 8.6% national uninsured rate. While out-of-pocket medical expenses are not factored into the official poverty rate, they are considered in the supplemental poverty measure. Considering the state’s large uninsured population, medical expenses may help explain why more people may live below the poverty line in Nevada than is reflected by the state’s official poverty rate.
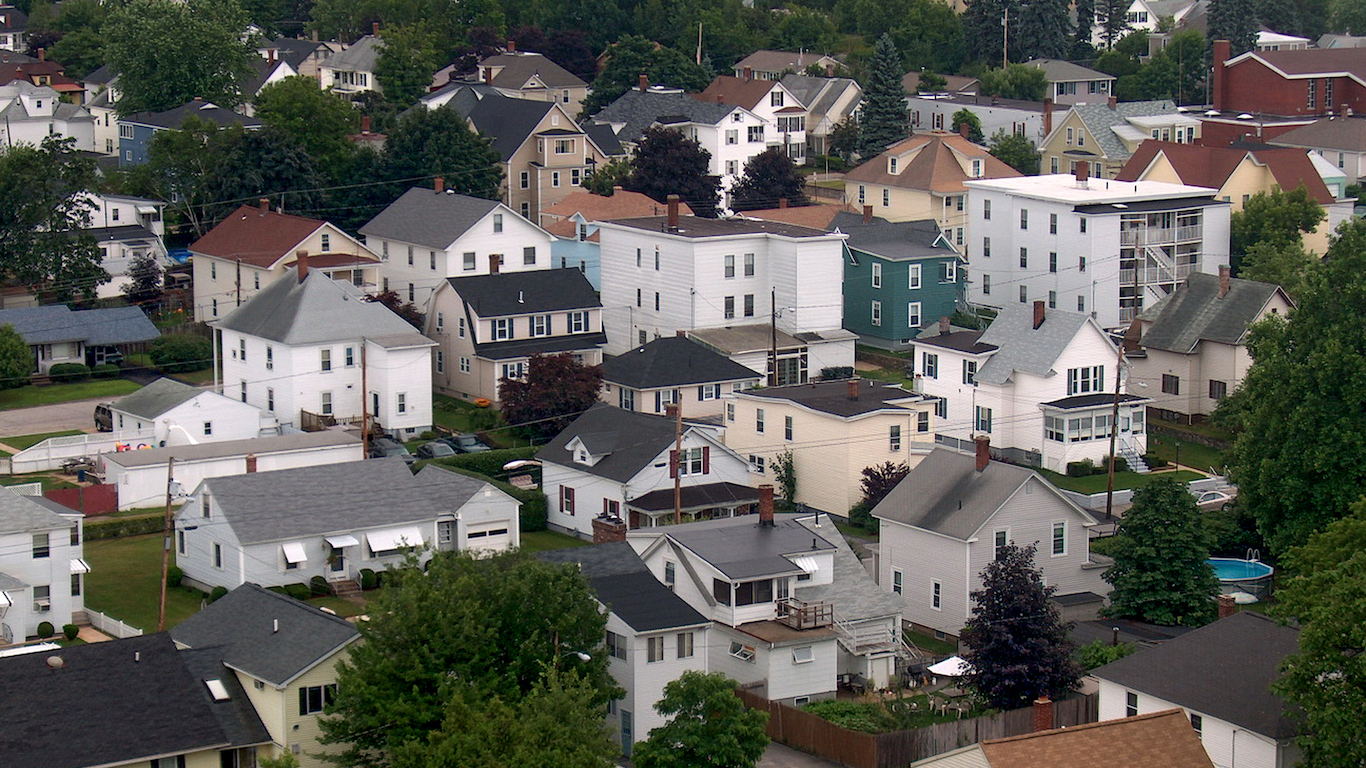
10. New Hampshire
> Supplemental poverty rate: 8.8% (4th lowest)
> Official poverty rate: 6.9% (the lowest)
> Cost of living: 5.0% more than national avg. (9th highest)
> Uninsured rate: 5.9% (15th lowest)
Despite differences between the state’s official and supplemental poverty rates, relatively few New Hampshire residents are facing serious financial hardship. The state’s 6.9% poverty rate and 8.8% supplemental poverty rate are respectively the lowest and fourth lowest among states.
The age demographics of New Hampshire’s population may help explain why the gap in poverty measures. Partly because many low income families with children are eligible for tax refunds such as the earned income tax credit (EITC) that are not accounted for in the poverty threshold, fewer children under 18 live in poverty than the official rate would suggest. Meanwhile, elderly populations have higher supplemental poverty rates than the official poverty rates, due in part to higher out-of-pocket medical costs. Only 19.5% of New Hampshire residents are 18 and under compared to 22.8% of the U.S. population. Similarly, 17.0% of state residents are 65 and older compared to only 15.2% of the nation as a whole.
[in-text-ad-2]
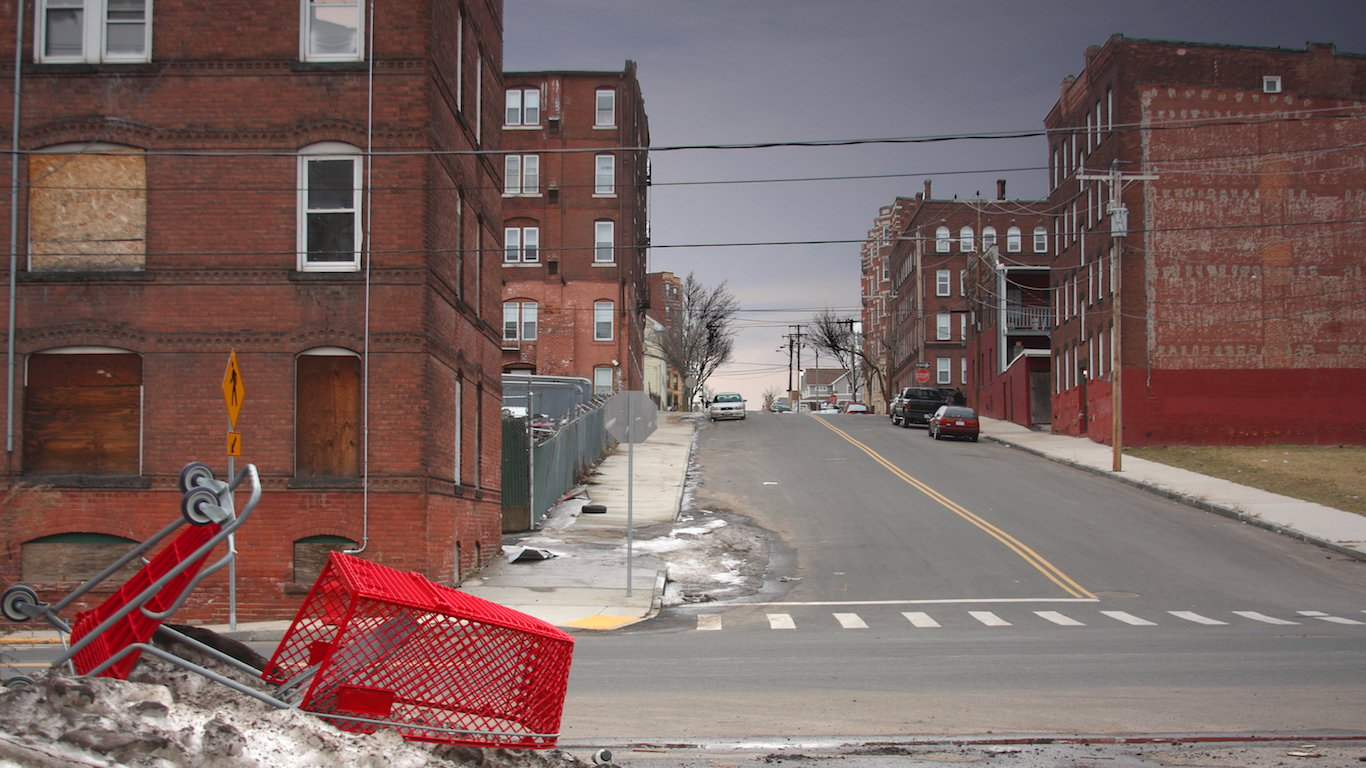
9. Massachusetts
> Supplemental poverty rate: 13.7% (20th highest)
> Official poverty rate: 11.6% (21st lowest)
> Cost of living: 6.9% more than national avg. (7th highest)
> Uninsured rate: 2.5% (the lowest)
The typical Massachusetts household earns $75,297 a year, about $18,000 more than the typical American household and more than the median income in all but three other states. Despite the high incomes, a far higher share of Bay State residents face serious financial hardship than the official poverty rate of 11.6% suggests.
Goods and services in Massachusetts cost about 7% more on average than they do nationwide. Housing is particularly expensive in Massachusetts. Rent costs are about 23% higher in the state than they are on average nationwide. Massachusetts’ higher cost of living likely pushes some lower income residents below the poverty line and may partially explain why the state’s 13.7% supplemental poverty rate is 2.1 percentage points above its official poverty rate.
8. New York
> Supplemental poverty rate: 16.0% (7th highest)
> Official poverty rate: 13.4% (19th highest)
> Cost of living: 15.3% more than national avg. (2nd highest)
> Uninsured rate: 6.1% (18th lowest)
Driven by high rent costs — particularly in New York City — goods and services cost 15.3% more on average in New York state than they do nationwide. The higher cost of living means state residents need to spend more to meet their basic needs — a factor not incorporated in the official state poverty rate of 13.4%. In addition to a range of other important factors not included in the official poverty rate, this may help explain why New York’s supplemental poverty rate is 2.6 percentage points higher than the official rate.
Both New York’s official and supplemental poverty rates are higher than those in most states. This may be tied to the state’s lagging job market. Some 4.9% of New York’s labor force are out of work, well above the U.S. September unemployment rate of 4.2%.
[in-text-ad]
7. Connecticut
> Supplemental poverty rate: 12.0% (24th lowest)
> Official poverty rate: 9.2% (4th lowest)
> Cost of living: 8.7% more than national avg. (6th highest)
> Uninsured rate: 4.9% (7th lowest)
The typical Connecticut household earns $73,433 a year, more than in all but five other states and about $16,000 more than the typical American household. Further, Connecticut is one of only six states in which fewer than 1 in 10 residents live below the official poverty line.
However, living in Connecticut is not cheap, and the state’s high cost of living makes it harder for lower earners to afford their basic needs. For example, the typical homeowner with a mortgage in the state pays $5,803 a year in property taxes, the second most of any state in the country. High real estate taxes are passed down to renters as well, as rent costs in Connecticut are about 17% higher than they are nationwide on average. Overall, the cost of living in Connecticut is higher than in all but five other states and nearly 9% higher than the average cost of living nationwide. Accounting for a range of factors, including cost of living, the share of Connecticut residents living in poverty is closer to 12.0%.
[recirclink id=419340]
6. Florida
> Supplemental poverty rate: 18.8% (2nd highest)
> Official poverty rate: 15.2% (13th highest)
> Cost of living: 0.5% less than national avg. (16th highest)
> Uninsured rate: 12.5% (5th highest)
Out-of-pocket medical costs are one of the biggest expenses the supplemental poverty measure accounts for. Medical bills are typically far higher for both the elderly and the uninsured. In Florida, about 1 in every 5 residents are 65 or older, and 12.5% of the population lacks health insurance, the highest and fifth highest shares of any state, respectively. High medical expenses among specific segments of Florida’s population partly explain why the state’s supplemental poverty measure of 18.8% is higher than its official poverty rate of 15.2%.
Unlike most states where poverty is worse than it seems, the cost of living in Florida is slightly lower than it is nationwide on average.

5. Virginia
> Supplemental poverty rate: 15.0% (10th highest)
> Official poverty rate: 10.8% (14th lowest)
> Cost of living: 2.5% more than national avg. (12th highest)
> Uninsured rate: 8.7% (19th highest)
Virginia is one of only five states where the supplemental poverty rate is at least 4 percentage points higher than the official poverty rate. Officially, 10.8% of Virginia residents live in poverty compared to 13.7% of all Americans. However, after accounting for the state’s high cost of living, residents’ out-of-pocket medical expenses, and taxes, Virginia’s supplemental poverty rate is 15.0%, compared the 14.7% U.S. poverty rate.
One of the supplemental poverty rates’ primary purposes is to gauge the efficacy of anti-poverty programs. Like the other states on this list, Virginia’s system has not offset the state’s high cost of living for many of its lower earning residents.
[in-text-ad-2]
4. Hawaii
> Supplemental poverty rate: 14.8% (12th highest)
> Official poverty rate: 10.3% (10th lowest)
> Cost of living: 18.8% more than national avg. (the highest)
> Uninsured rate: 3.5% (2nd lowest)
Americans age 65 and older are the most likely age group to live in poverty but not be included in the official poverty rate. This is largely because older Americans, who typically need more frequent medical care, face higher out-of-pocket medical costs. The near nation-leading difference between Hawaii’s 10.3% official poverty rate and 14.8% supplemental poverty rate may be partially the result of its sizable elderly population. Some 17.0% of Hawaiians are 65 and older compared to only 15.2% of the U.S. population.
Hawaii’s high cost of living also likely contributes to higher poverty than the official rate implies. With goods and services in the state nearly 19% more expensive on average than they are nationwide, the state is the most expensive in the country.

3. Maryland
> Supplemental poverty rate: 13.5% (22nd highest)
> Official poverty rate: 8.9% (3rd lowest)
> Cost of living: 9.6% more than national avg. (5th highest)
> Uninsured rate: 6.1% (18th lowest)
The typical household in Maryland earns nearly $79,000 a year, the highest median income of any state. As is often the case in high income areas, Maryland’s 8.9% official poverty rate is far lower than the nationwide rate and nearly the lowest of any state. However, also similar to other wealthy areas, Maryland has a high cost of living. Goods and services in the state are nearly 10% more expensive than they are nationwide, on average. Unlike the supplemental poverty rate, the official poverty rate does not account for variances in cost of living within the continental United States. Due in part to the high cost of living, over a quarter million of Maryland residents are effectively living in poverty and are not included in the state’s official poverty rate. The discrepancy between the state’s official and supplemental poverty rates is third largest.
[in-text-ad]
2. New Jersey
> Supplemental poverty rate: 15.3% (9th highest)
> Official poverty rate: 10.7% (13th lowest)
> Cost of living: 13.4% more than national avg. (3rd highest)
> Uninsured rate: 8.0% (25th highest)
While the official poverty rate considers only income levels, the supplemental rate take into account taxes. New Jersey’s relatively high taxes partially contribute to more residents facing serious financial hardship than the official rate implies. Some 15.3% of Garden State residents live in poverty according to the supplemental rate, nearly 5 percentage points above the official rate of just 10.7%. The median monthly housing costs for New Jersey homeowners with a mortgage is $2,343, the highest in the country. The nation-leading housing costs are driven in large part by high taxes, as homeowners with a mortgage in the state pay the most per year in real estate taxes among states, and over three times more than the average nationwide.
Pushed up in part by housing costs, the cost of living in New Jersey is nearly the highest of any state. Goods and services in New Jersey are 13.4% more expensive than they are nationwide on average. Accounting for factors such as taxes and cost of living, some 416,000 New Jersey residents live in poverty and are not included in the official poverty rate.
[recirclink id=419684]

1. California
> Supplemental poverty rate: 20.4% (the highest)
> Official poverty rate: 14.5% (16th highest)
> Cost of living: 13.4% more than national avg. (3rd highest)
> Uninsured rate: 7.3% (22nd lowest)
An estimated 2.3 million Californians live in poverty and are not counted in the state’s official poverty rate. When accounting for taxes, out-of-pocket medical costs, and overall cost of living, California’s poverty rate climbs from 14.5%, which is only slightly higher than average, to 20.4%, which is the highest supplemental poverty rate of any state.
A dearth of jobs compounded by a high cost of living are partially to blame. Housing costs are 47% higher in California than they are on average nationwide, and the overall cost of living in the state is 13% higher than it is on average nationwide. Meanwhile, some 5.1% of California’s workforce are out of a job, the sixth highest unemployment rate among states and well above the 4.2% U.S. unemployment rate.
States Where Poverty is Not As Bad As You Thought
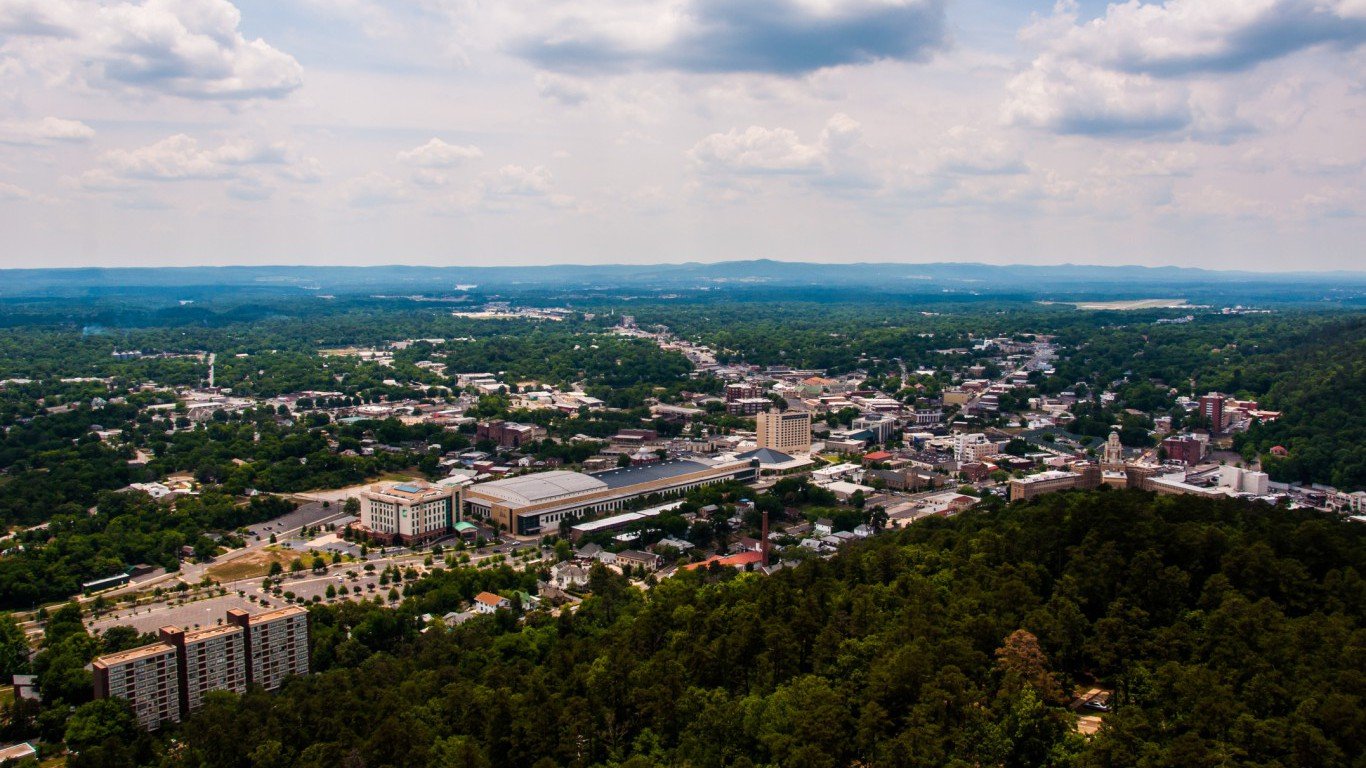
11. Arkansas
> Supplemental poverty rate: 14.7% (14th highest)
> Official poverty rate: 16.8% (7th highest)
> Cost of living: 12.6% less than national avg. (3rd lowest)
> Uninsured rate: 7.9% (24th lowest)
The official poverty rate in the continental United States does not account for regional differences in cost of living. As a result, states that are relatively inexpensive places to live often have less poverty than the official rate suggests. In Arkansas, housing costs are 36.1% less expensive than they are nationwide, on average, and the overall cost of living is 12.6% less expensive. Accounting for the lower cost of living, including housing, as well as a range of other factors like tax benefits, 14.7% of people in Arkansas live in poverty, versus the state’s 16.8% official poverty rate.
While the Arkansas’ official poverty rate is among the highest of all states, its supplemental poverty rate is in line with the nationwide poverty rate.
[in-text-ad]

10. Louisiana
> Supplemental poverty rate: 18.4% (3rd highest)
> Official poverty rate: 20.6% (2nd highest)
> Cost of living: 9.4% less than national avg. (15th lowest)
> Uninsured rate: 10.3% (10th highest)
According to Louisiana’s official poverty rate, more than 1 in every 5 state residents face serious financial hardship, the second highest poverty rate of any state. However, the state’s low cost of living and tax benefits, among other factors, help lower the poverty threshold, effectively reducing by 100,000 the number of of residents living in poverty.
Despite the lower supplemental poverty rate, Louisiana remains one of the poorest states in the country. The state’s supplemental poverty rate of 18.4% is well above the U.S. rate of 14.7%, and higher than the supplemental rate in all but two other states.
[recirclink id=419763]
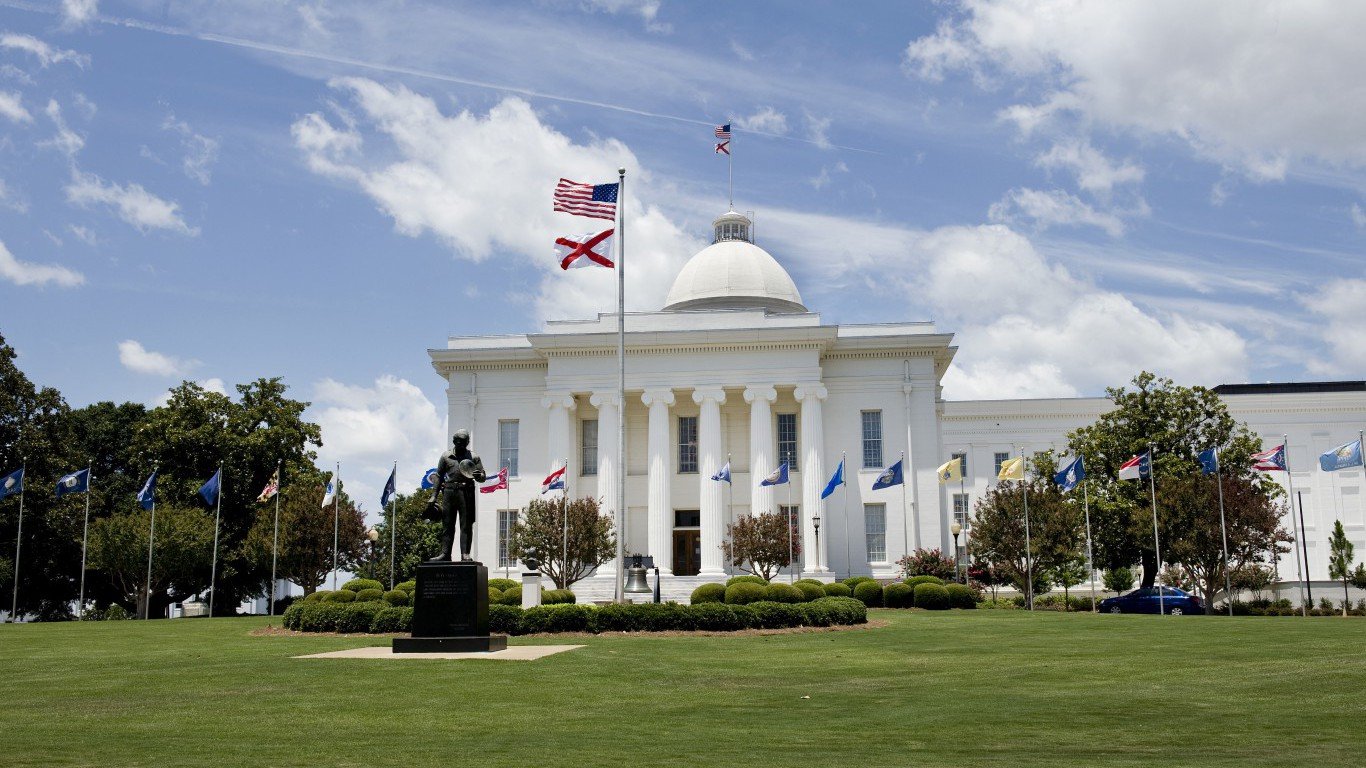
9. Alabama
> Supplemental poverty rate: 14.5% (16th highest)
> Official poverty rate: 16.8% (7th highest)
> Cost of living: 13.2% less than national avg. (2nd lowest)
> Uninsured rate: 9.1% (15th highest)
Regional differences in cost of living are not factored into the official poverty rate. As a result, poverty may be less common in states with lower living costs than the official poverty rate might suggest. Alabama is one such state. The state has the least expensive housing costs of any state — 37% lower than they are nationwide. Overall, goods and services in Alabama are the second cheapest of any state — 13.2% lower than they are nationwide on average.
Accounting for the state’s low cost of living, in addition to tax refund programs such as EITC, about 110,000 fewer people in Alabama live in poverty than the state’s 16.8% official poverty rate suggests.
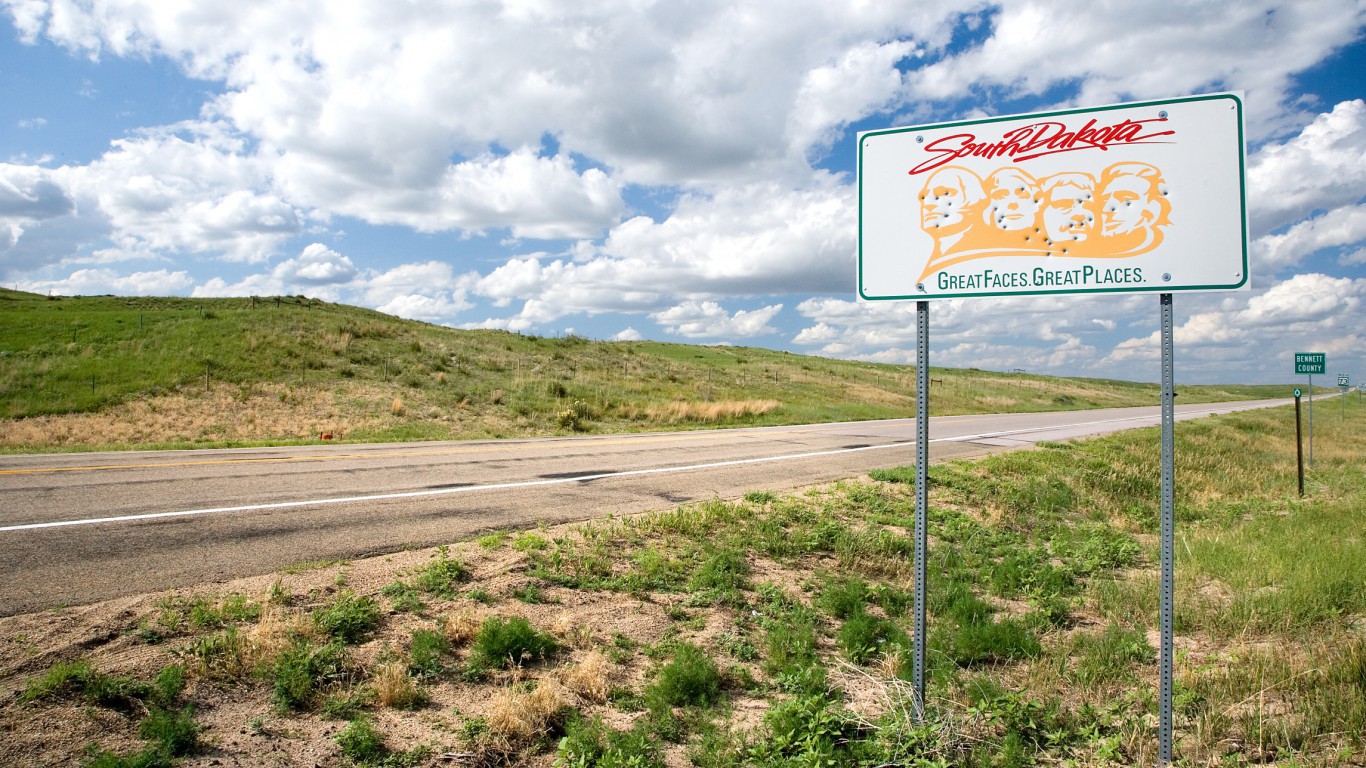
8. South Dakota
> Supplemental poverty rate: 11.4% (16th lowest)
> Official poverty rate: 13.7% (18th highest)
> Cost of living: 11.8% less than national avg. (4th lowest)
> Uninsured rate: 8.7% (19th highest)
Largely because families with children receive tax breaks — and taxes are not factored into official poverty rates — children under 18 have lower supplemental poverty rates than their official poverty rate. In South Dakota, about 1 in every 5 residents are 18 or younger, one of the largest young populations of any state. The relatively young population may partially explain why the state’s 11.4% supplemental poverty rate is well below its 13.7% official poverty rate.
By raising the threshold of poverty income, a low cost of living in the state also helps lift many residents over the federal poverty line. Goods and services in South Dakota are about 12% less expensive than they are on average nationwide.
[in-text-ad-2]
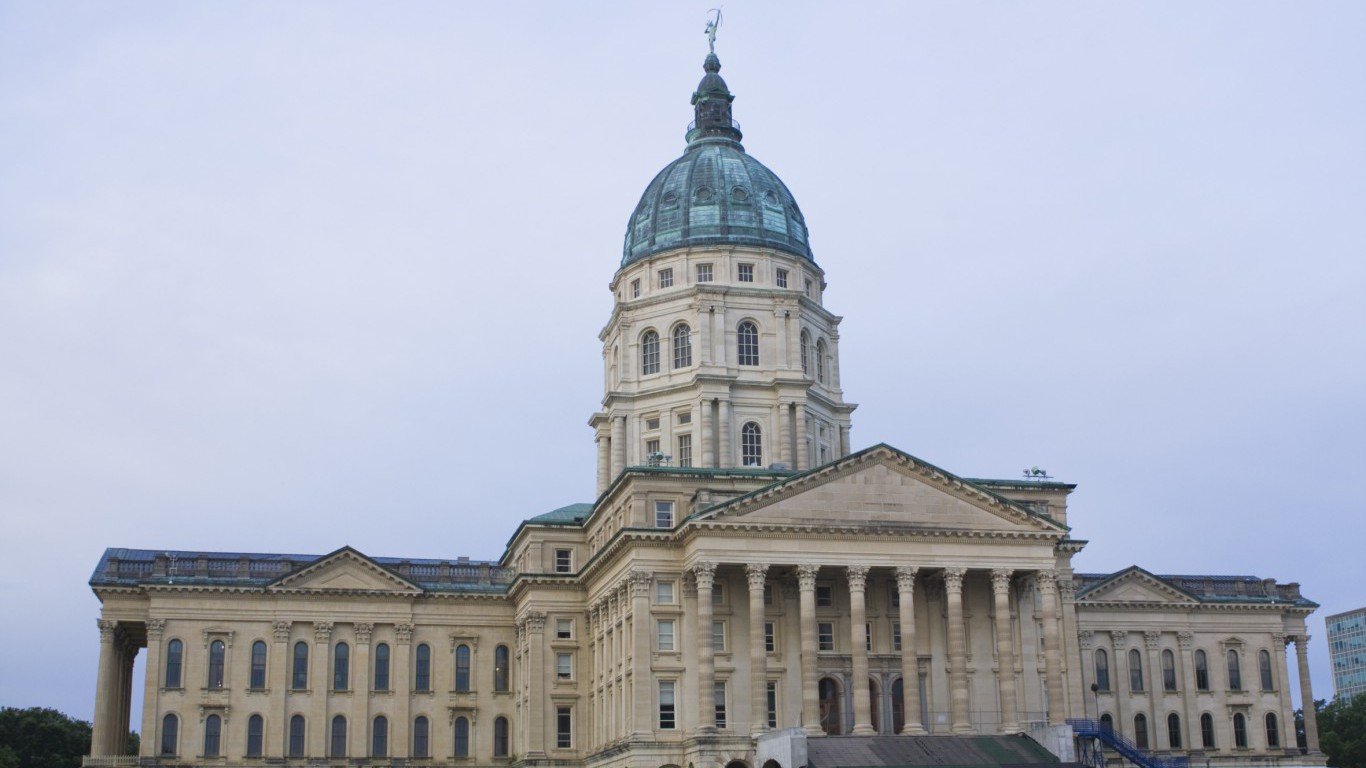
7. Kansas
> Supplemental poverty rate: 10.0% (9th lowest)
> Official poverty rate: 12.5% (25th highest)
> Cost of living: 9.6% less than national avg. (13th lowest)
> Uninsured rate: 8.7% (19th highest)
Americans under age 18 are the most likely age group to live below the poverty line. The under 18 population In Kansas, nearly 25% of residents, is one of the largest shares of all states. However, young Kansas residents are not as likely to be in poverty as in other states, even by the official measure. The state’s child poverty rate of 14.1% is one of the few on this list that does not exceed the national percentage of 19.5%. Still, the rate likely drops even lower when refundable tax credits are added into the poverty calculation. As is generally the case among states where poverty is not quite as bad as it seems, low living expenses in Kansas raise the poverty threshold.
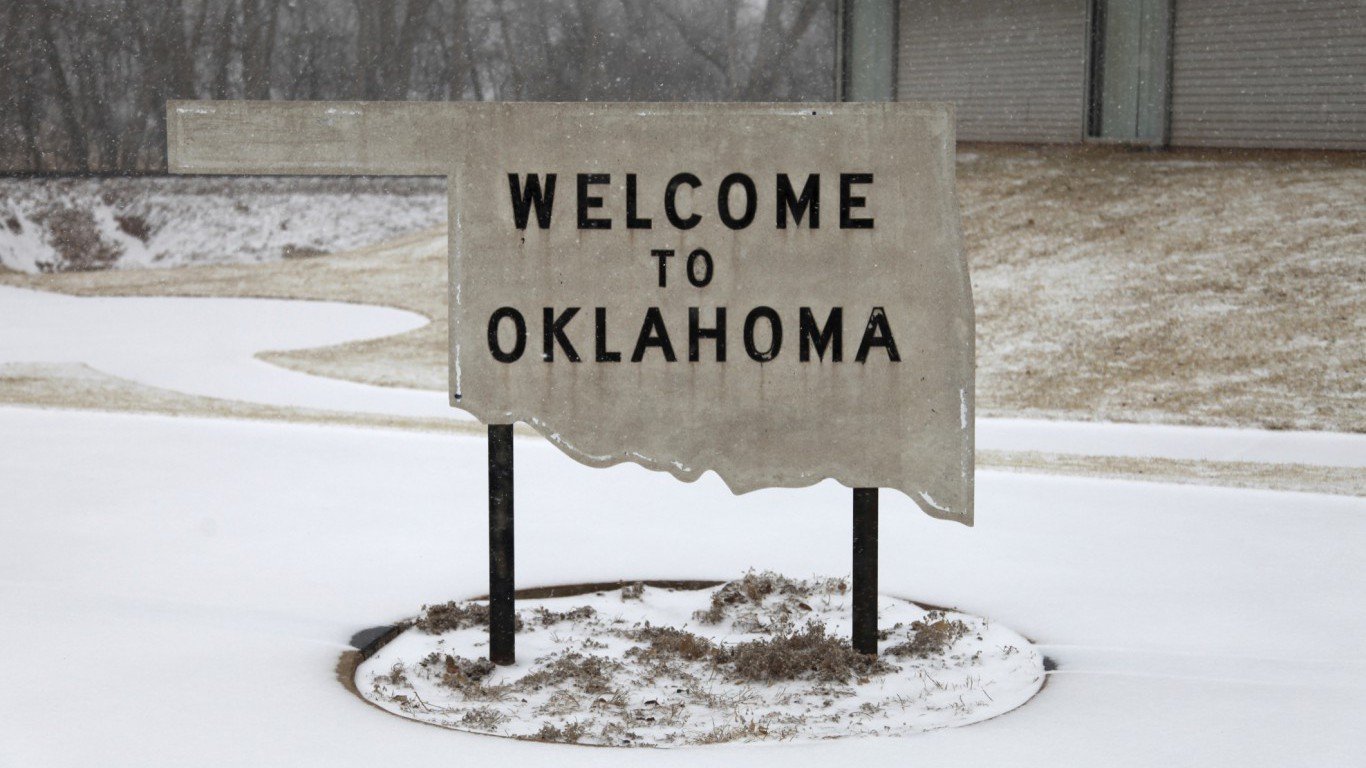
6. Oklahoma
> Supplemental poverty rate: 12.8% (25th highest)
> Official poverty rate: 15.3% (11th highest)
> Cost of living: 10.1% less than national avg. (10th lowest)
> Uninsured rate: 13.8% (3rd highest)
Low income families with young children are eligible for tax refunds such as the EITC, which are not considered in official poverty rates. So large shares of young people, together with a high child poverty rate, can help explain a state’s gap in official and supplemental poverty rates. In Oklahoma, nearly 1 in every 5 residents are 18 and younger, one of the larger shares of children among all states. Approximately 23% of residents under 18 are in poverty by the official measure, the 10th highest of all states.
Regional differences in cost of living are also not factored into official poverty rates. In Oklahoma, goods and services are 10% less expensive than they are on average nationwide, which also helps reduce the state’s supplemental poverty rate.

5. Ohio
> Supplemental poverty rate: 11.8% (23rd lowest)
> Official poverty rate: 14.3% (17th highest)
> Cost of living: 10.8% less than national avg. (7th lowest)
> Uninsured rate: 5.6% (13th lowest)
Ohio’s official poverty rate of 14.3% includes some 294,000 residents that may not actually be in poverty. The supplemental poverty measure factors in a range of considerations not included in the official poverty rate. Chief among them are out-of-pocket medical expenses and cost of living.
In Ohio, only 5.6% of residents do not have health insurance, a smaller share than the nationwide insurance coverage rate of 8.6% of Americans. The low uninsured rate greatly reduces out-of-pocket medical costs. Additionally, goods and services are 10.8% less expensive in Ohio than they are nationwide. These factors help push the Buckeye State’s supplemental poverty rate 2.6 percentage points below the official poverty rate.
[in-text-ad]

4. Kentucky
> Supplemental poverty rate: 15.0% (10th highest)
> Official poverty rate: 18.2% (4th highest)
> Cost of living: 11.4% less than national avg. (5th lowest)
> Uninsured rate: 5.1% (8th lowest)
About 142,000 fewer people in Kentucky live in poverty than the state’s 18.2% official poverty rate suggests. Like many states with lower supplemental poverty rates, living in Kentucky is not particularly expensive. Basic needs like food, clothing, shelter, and utilities cost about 11.4% less in the state than they do on average nationwide. After factoring in Kentucky’s low cost of living, the state’s fourth highest 18.2% poverty rate falls to the 10th highest supplemental poverty rate of 15.0%.
A stronger economy would likely go further in alleviating poverty in Kentucky, as joblessness is more of a problem in the state than it is nationwide. Some 5.2% of the state’s labor force is out of work, the fourth highest unemployment rate among states and a full percentage point above the U.S. unemployment rate.
[recirclink id=419362]
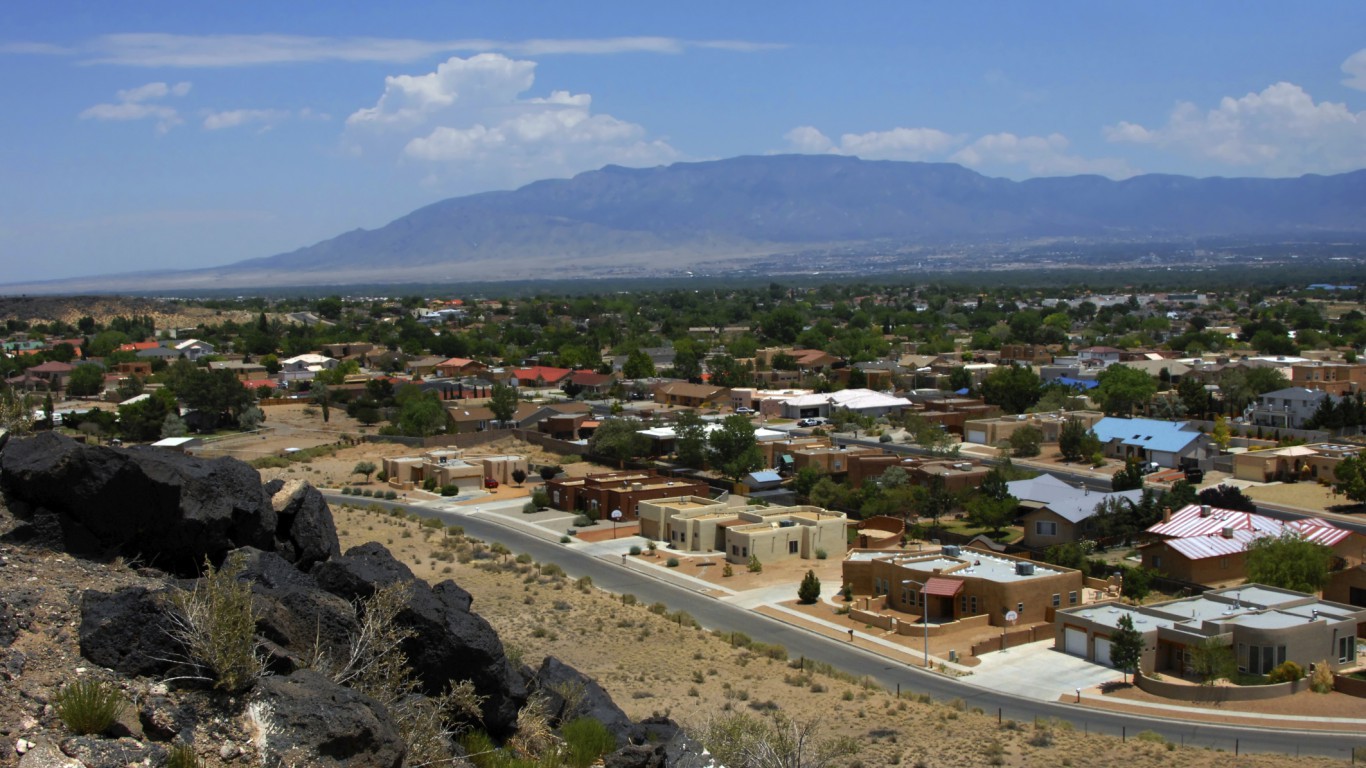
3. New Mexico
> Supplemental poverty rate: 15.7% (8th highest)
> Official poverty rate: 19.2% (3rd highest)
> Cost of living: 5.6% less than national avg. (23rd lowest)
> Uninsured rate: 9.2% (14th highest)
New Mexico has far fewer residents facing serious financial hardship than its official poverty rate suggests. Considering the state’s low cost of living, low taxes, and noncash benefits issued by the state, the share of New Mexicans living on poverty level income is actually 15.7% — well below its official poverty rate of 19.2%. Refundable tax credits in particular, which disproportionately benefit children, account for a large portion of the difference. One quarter of children in New Mexico are in poverty according to the official measure, the fourth highest rate of all states.
While the tax structure and other state programs appear to be effective in reducing poverty, a better job market would likely be even more beneficial. New Mexico’s 2016 unemployment rate of 6.7% is the highest of any state and well above the U.S. unemployment rate of 4.9%.

2. West Virginia
> Supplemental poverty rate: 14.1% (18th highest)
> Official poverty rate: 17.7% (6th highest)
> Cost of living: 11.1% less than national avg. (6th lowest)
> Uninsured rate: 5.3% (10th lowest)
West Virginia’s official poverty rate of 17.7% is well above the U.S. poverty rate. However, poverty may be less of a problem in the state that it is nationwide. Accounting for taxes, cost of living, medical expenses, and various noncash benefits, only 14.1% of West Virginians live in poverty compared to 14.7% of Americans.
The lower supplemental poverty rate does not suggest economic conditions are satisfactory in West Virginia, however. Some 6.0% of the state’s labor force was out of work in 2016, the fourth highest annual unemployment rate among states. Additionally, while many may not be living in poverty, a large share of West Virginians are relatively poor. The typical household in the state earns only $43,385 a year, the second lowest median income of any state.
[in-text-ad-2]
1. Mississippi
> Supplemental poverty rate: 16.9% (5th highest)
> Official poverty rate: 20.8% (the highest)
> Cost of living: 13.8% less than national avg. (the lowest)
> Uninsured rate: 11.8% (6th highest)
Mississippi leads the nation in both measures of poverty. Still, 114,000 state residents are lifted out of poverty by the state’s tax policies, various noncash benefits, and a low cost of living. The state’s supplemental poverty rate of 16.9% is nearly 4 percentage points below its official rate.
Mississippi’s low cost of living largely explains the difference. With goods and services in the state 13.8% less expensive than they are on average nationwide, the state is the least expensive to live in in the country. Refundable tax credits like EITC, designed to assist working families with children, also likely contributes substantially to the relatively low supplemental poverty rate. According to the official measure, nearly 30% of children in Mississippi are in poverty, the second highest rate in the nation.
Detailed Findings
Based on food comprising about a third of the average family’s budget, the U.S. government set the poverty threshold in 1963 by multiplying the cost of an economy or nutritionally adequate food plan by three.
Dozens of government programs use that figure, adjusted for inflation, to help determine eligibility for services to low-income families. The poverty line guides access to the Supplemental Nutrition Assistance Program (formerly Food Stamps), the National School Lunch Program, certain parts of Medicaid, and some prescription drug coverage under Medicaid.
In an interview with 24/7 Wall St., Elise Gould, senior economist with Economic Policy Institute, said that one of the biggest weaknesses of the U.S. system is “that [the official poverty rate] is one threshold across the entire country when we know that the cost of living does vary greatly.”
The supplemental poverty measure, which is not used to determine government program eligibility, takes into account the effects of anti-poverty programs like these. The measure also accounts for local housing costs and other expenses such as out-of-pocket medical expenses.
The states where the supplemental poverty rates are highest compared to the official rate therefore tend to have varying combinations of higher housing costs, higher medical expenses, and other generally high costs of living. On the other end of the spectrum, in cases where the supplemental poverty rates are lower than the official rate, there tend to be low housing costs and greater portions of the population benefiting from the earned income tax credit (EITC), for example.
Even with the relatively flawed official poverty rate, anti-poverty programs in the United States remain extremely successful. Social Security keeps millions of elderly Americans and plenty of prime age adults and children out of poverty every year. But as Gould noted, even the SPM leaves out of the equation certain costs such as childcare, and conditions in the United States are not exactly improving. With the ongoing long-term rise of income inequality and continued wage stagnation, “the safety net has had to work even harder.”
Using data from historical tax returns, Economists Emmanuel Saez and Thomas Piketty revealed in 2013 that the accumulation of income at the top in the United States was higher than at any time since the Gilded Age.
Methodology
To identify the states where poverty is worse and better than you think, 24/7 Wall St. reviewed states where the supplemental poverty rate (SPM) was highest compared to the official poverty rate. We also reviewed states where the SPM was lower than the official rate. These data are three year averages through 2016 from the U.S. Census Bureau’s Current Population Survey. The Supplemental Poverty Measure extends the official poverty measure by taking into account the effects of many of the government programs designed to assist low-income families and individuals that are not included in the official poverty measure.
We also reviewed various data from the Census’ 2016 American Community Survey, including median household income, poverty rates, health insurance coverage rates, and the percentages of each state’s population 65 years and over. 2015 Regional price parities, or cost of living, came from the Bureau of Economic Analysis. September and 2016 annual average unemployment rates came from the Bureau of Economic Analysis.
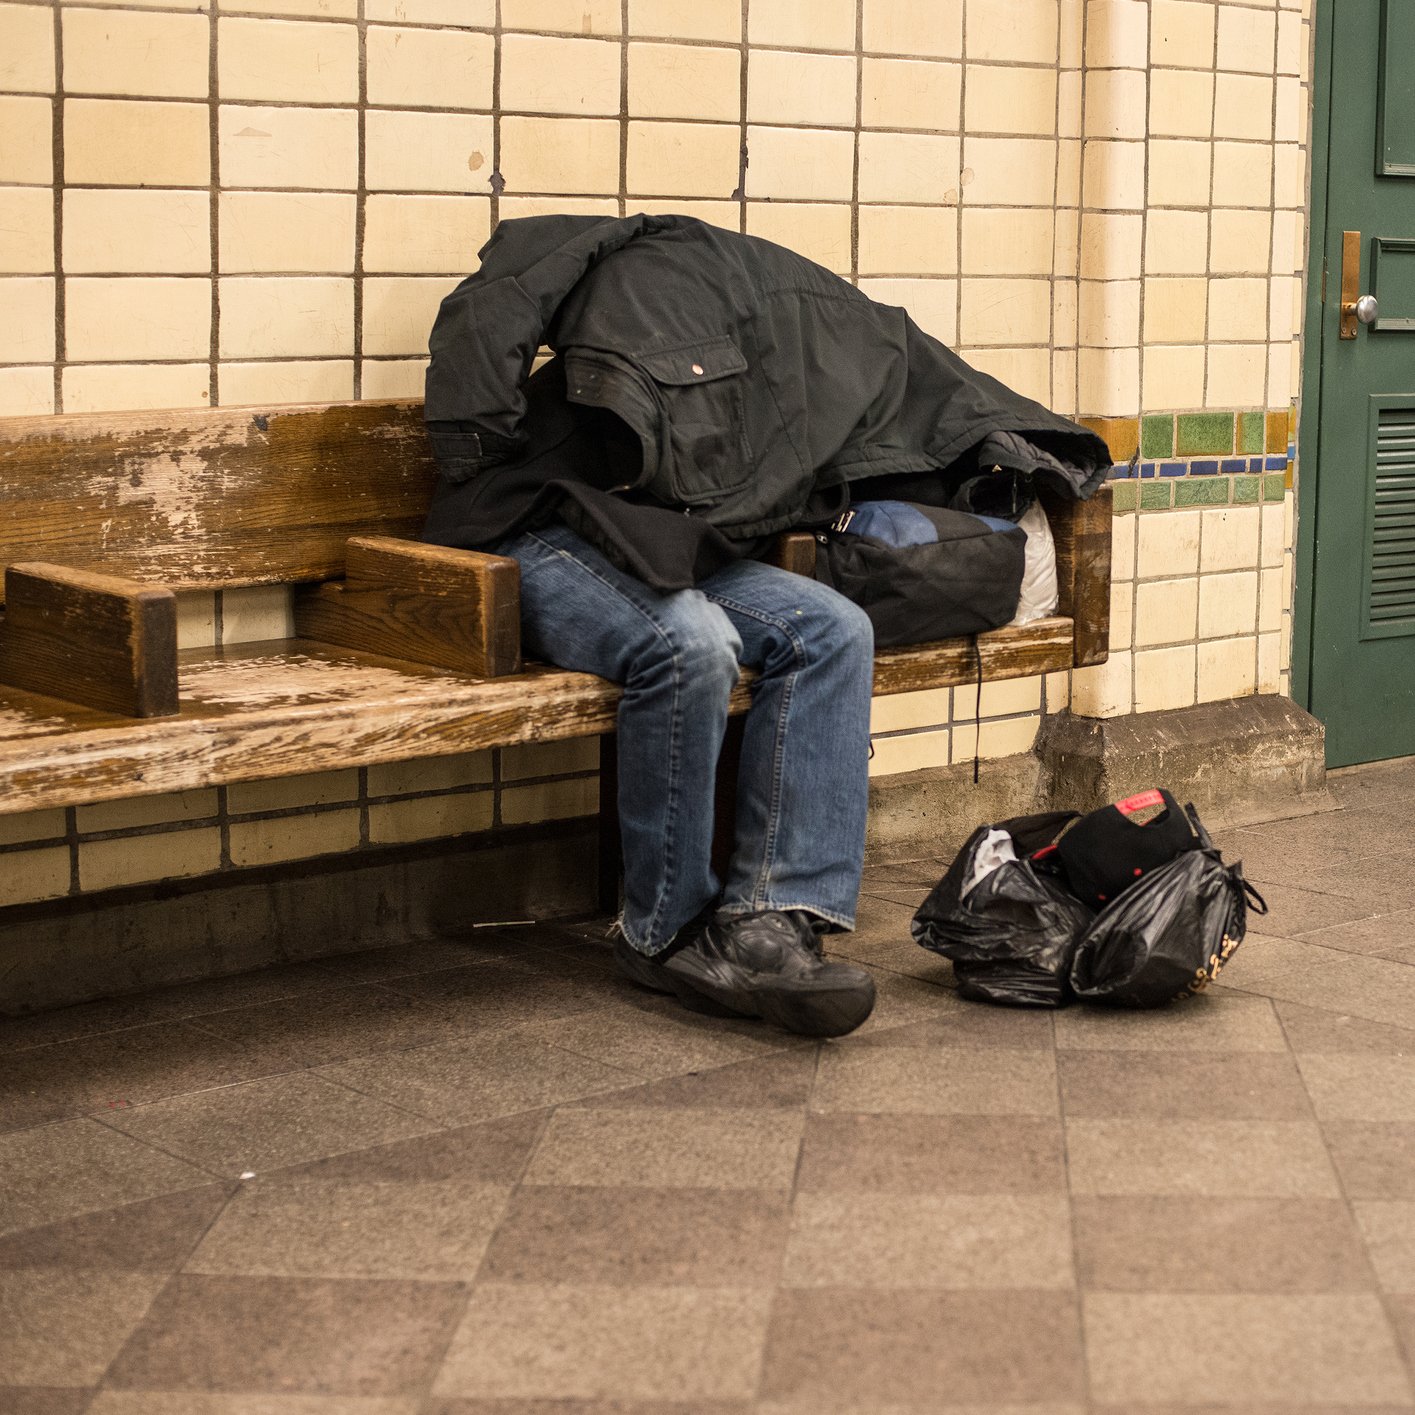
The sample used in both measures excludes many individuals who might otherwise be considered in poverty. For example, people who are homeless and not living in shelters, and people in prisons, long-term care hospitals, nursing homes and other institutions are not counted.
Contact [email protected] for any questions or corrections.