[cnxvideo id=”625472″ placement=”ros”]American consumers have spent $130.6 trillion so far in 2017, a 2.7% increase compared to this point in 2016. Personal expenditure by U.S. consumers accounts for two-thirds of all spending in the United States and is the primary driver of economic growth.
As the U.S. economy experiences steady growth, consumer spending continues to rise. Spending on luxury goods such as yachts and private planes has risen over the past year, as well as on necessary expenses such as housing, food, and health care. Additionally, due to improvements in technology more Americans are able to afford televisions, internet access, and other consumer electronics. Changes in technology have also led some Americans to abandon certain outdated products and services altogether, as spending on postal services and video rentals declines to a fraction of what it was one decade ago.
To determine what Americans spent in 2017, 24/7 Wall St. analyzed real personal consumption expenditures from January to November 2017 from the Bureau of Economic Analysis. We chose 50 consumer categories that best represent what Americans spent in 2017, and how consumer spending patterns have changed from previous years. Money continues to circulate over the course of the year once it is spent. So it is important to note that while personal consumption is a good reflection of how Americans spend their money, it far outweighs the total value of goods and services in the economy.
Click here to see the full list of what Americans spent in 2017.
Click here to see our detailed findings and methodology.

1. Bicycles and accessories
> 2017 spending: $53.28 billion
> Share of total expenditure: 0.04%
> 1-year change: -2.33%
> 10-year change: +18.21%
[in-text-ad]

2. Video media rental
> 2017 spending: $59.36 billion
> Share of total expenditure: 0.05%
> 1-year change: +6.79%
> 10-year change: -41.65%
[recirclink id=429078]

3. Museums and libraries
> 2017 spending: $73.19 billion
> Share of total expenditure: 0.06%
> 1-year change: +3.60%
> 10-year change: +3.95%

4. Postal services
> 2017 spending: $86.64 billion
> Share of total expenditure: 0.07%
> 1-year change: -5.17%
> 10-year change: -38.89%
[in-text-ad-2]
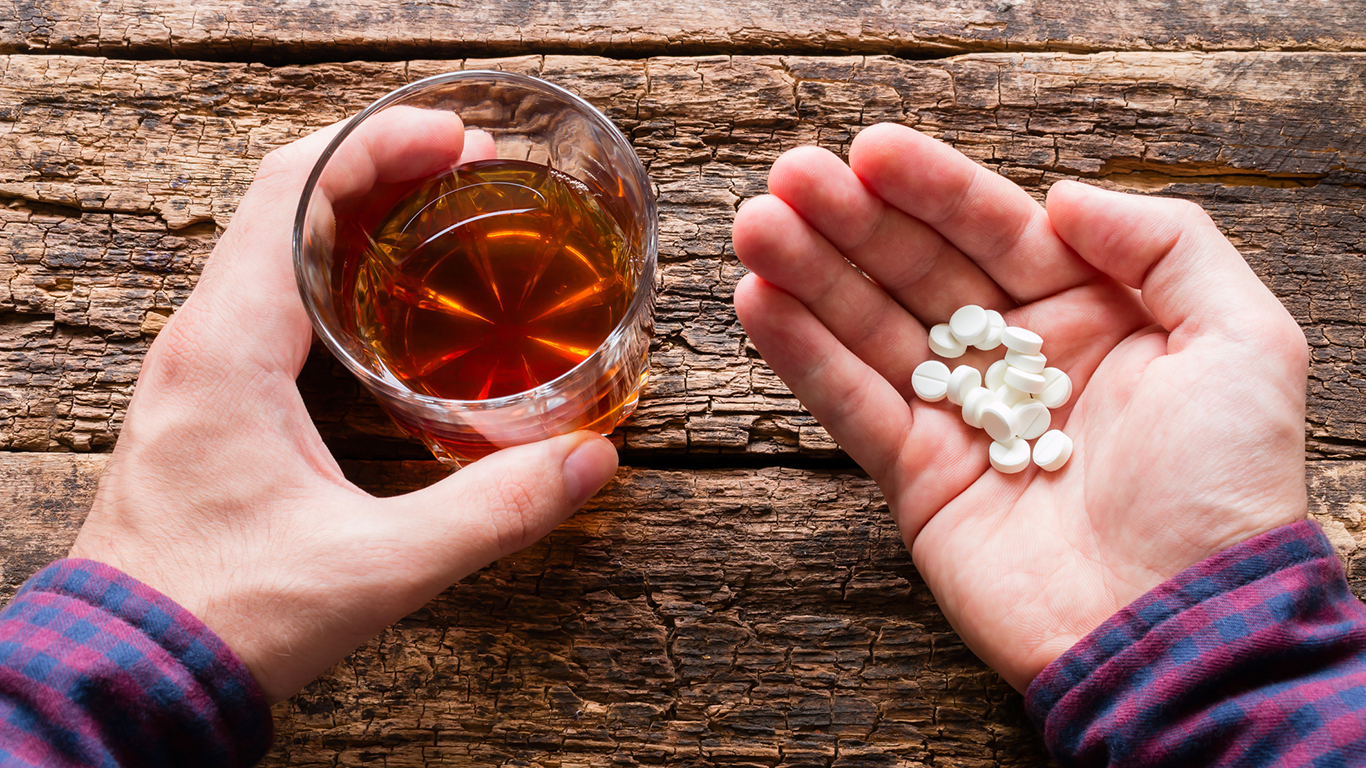
5. Residential mental health and substance abuse treatment
> 2017 spending: $94.81 billion
> Share of total expenditure: 0.07%
> 1-year change: -1.30%
> 10-year change: +34.79%

6. Motorcycles
> 2017 spending: $112.96 billion
> Share of total expenditure: 0.09%
> 1-year change: +2.46%
> 10-year change: -21.07%
[in-text-ad]

7. Laundry and drycleaning services
> 2017 spending: $117.28 billion
> Share of total expenditure: 0.09%
> 1-year change: +1.82%
> 10-year change: -13.70%
[recirclink id=429326]

8. Labor organization dues
> 2017 spending: $133.49 billion
> Share of total expenditure: 0.10%
> 1-year change: +5.89%
> 10-year change: -0.30%

9. Moving, storage, and freight services
> 2017 spending: $156.47 billion
> Share of total expenditure: 0.12%
> 1-year change: +5.71%
> 10-year change: -4.37%
[in-text-ad-2]

10. Parking fees and tolls
> 2017 spending: $203.12 billion
> Share of total expenditure: 0.16%
> 1-year change: -0.22%
> 10-year change: -2.12%
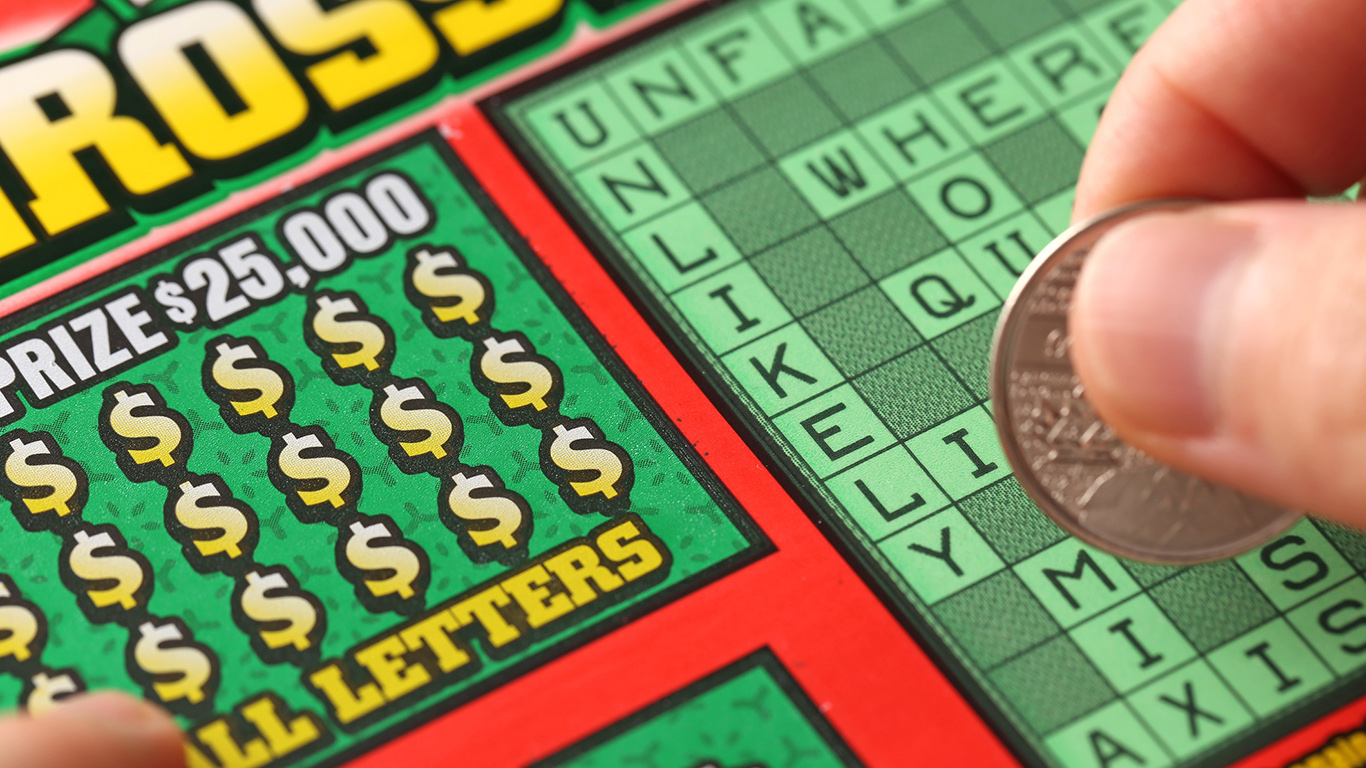
11. Lottery tickets
> 2017 spending: $269.79 billion
> Share of total expenditure: 0.21%
> 1-year change: +1.71%
> 10-year change: +12.27%
[in-text-ad]

12. Funeral and burial services
> 2017 spending: $282.40 billion
> Share of total expenditure: 0.22%
> 1-year change: +2.72%
> 10-year change: -2.09%
[recirclink id=428335]
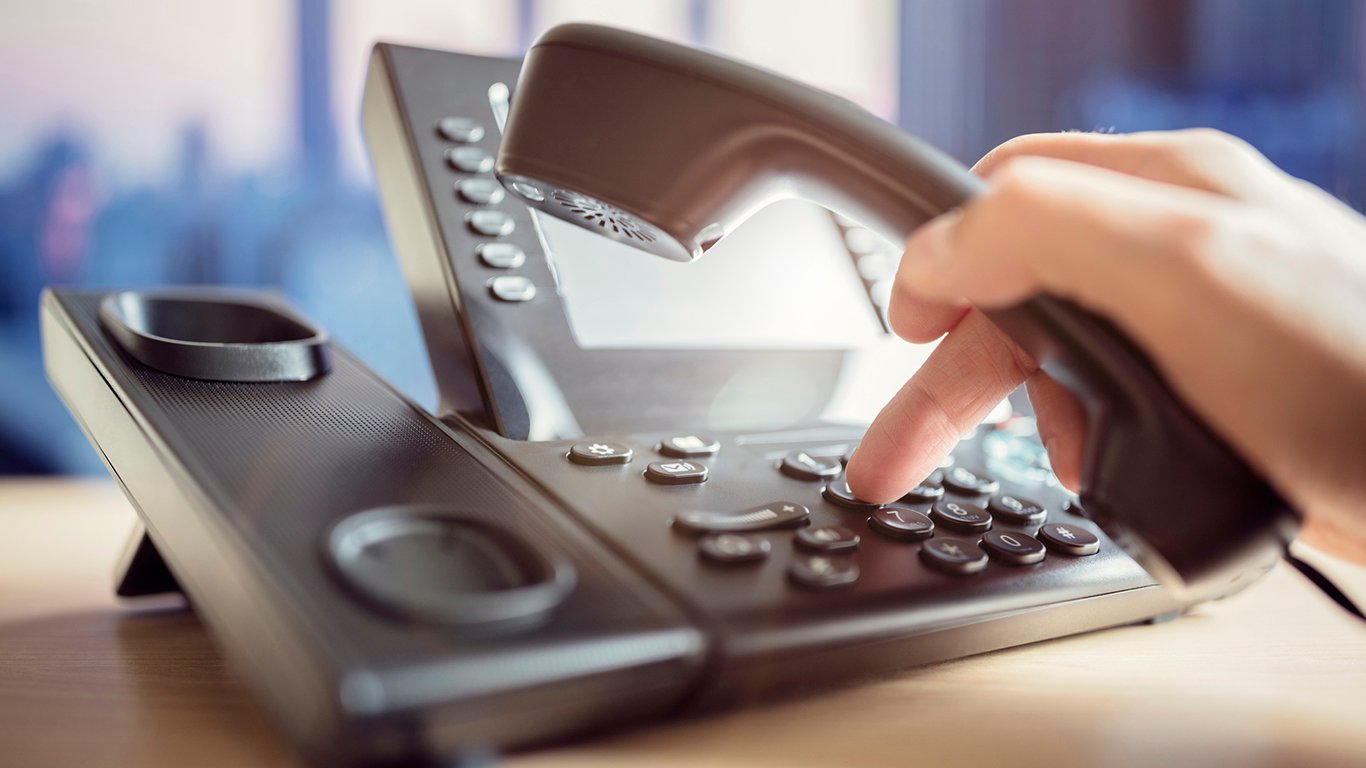
13. Landline telephone services
> 2017 spending: $360.85 billion
> Share of total expenditure: 0.28%
> 1-year change: -11.78%
> 10-year change: -53.03%

14. Child care
> 2017 spending: $363.93 billion
> Share of total expenditure: 0.28%
> 1-year change: +5.59%
> 10-year change: +8.29%
[in-text-ad-2]

15. Flowers, seeds, and potted plants
> 2017 spending: $366.29 billion
> Share of total expenditure: 0.28%
> 1-year change: +9.06%
> 10-year change: +6.27%

16. Books
> 2017 spending: $396.03 billion
> Share of total expenditure: 0.30%
> 1-year change: +9.69%
> 10-year change: +29.73%
[in-text-ad]

17. Boats, aircraft, and other recreational vehicles
> 2017 spending: $443.45 billion
> Share of total expenditure: 0.34%
> 1-year change: +16.71%
> 10-year change: +10.91%
[recirclink id=428885]
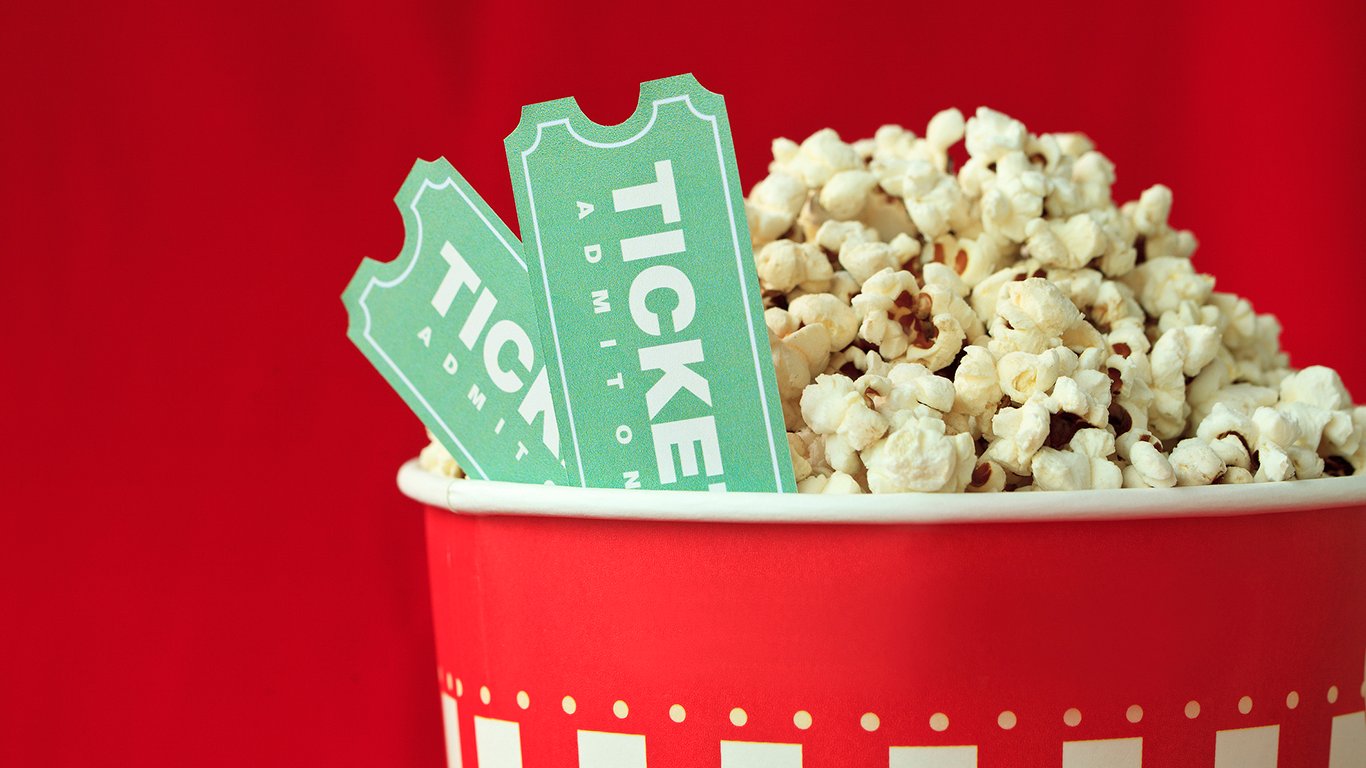
18. Admission to movie theaters, live entertainment, and sports
> 2017 spending: $702.15 billion
> Share of total expenditure: 0.54%
> 1-year change: -0.18%
> 10-year change: +13.40%

19. Pets and related products
> 2017 spending: $725.46 billion
> Share of total expenditure: 0.56%
> 1-year change: +4.70%
> 10-year change: +30.99%
[in-text-ad-2]

20. Hairdressing salons and personal grooming establishments
> 2017 spending: $784.16 billion
> Share of total expenditure: 0.60%
> 1-year change: +6.64%
> 10-year change: +29.05%
21. Glassware, tableware, and household utensils
> 2017 spending: $812.89 billion
> Share of total expenditure: 0.62%
> 1-year change: +7.36%
> 10-year change: +62.49%
[in-text-ad]
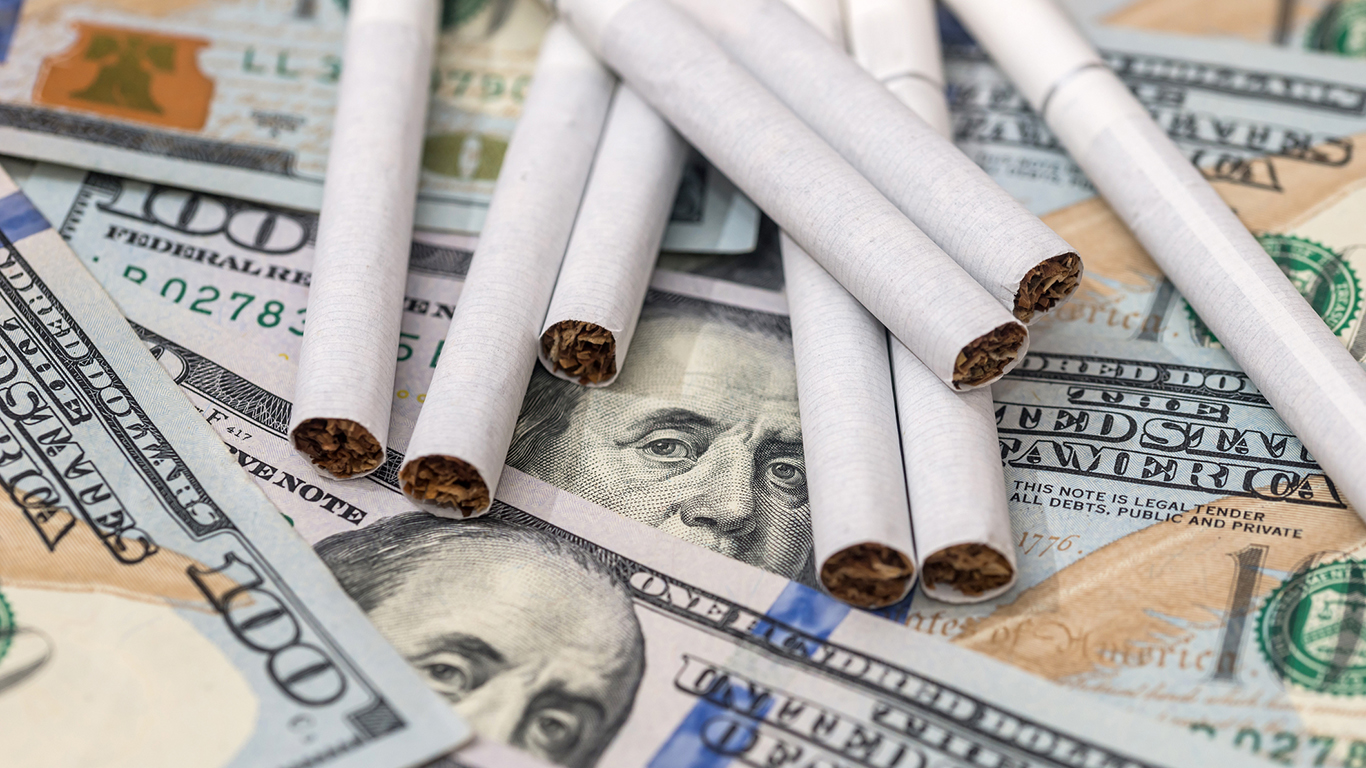
22. Tobacco
> 2017 spending: $863.18 billion
> Share of total expenditure: 0.66%
> 1-year change: -3.09%
> 10-year change: -29.23%
[recirclink id=428851]
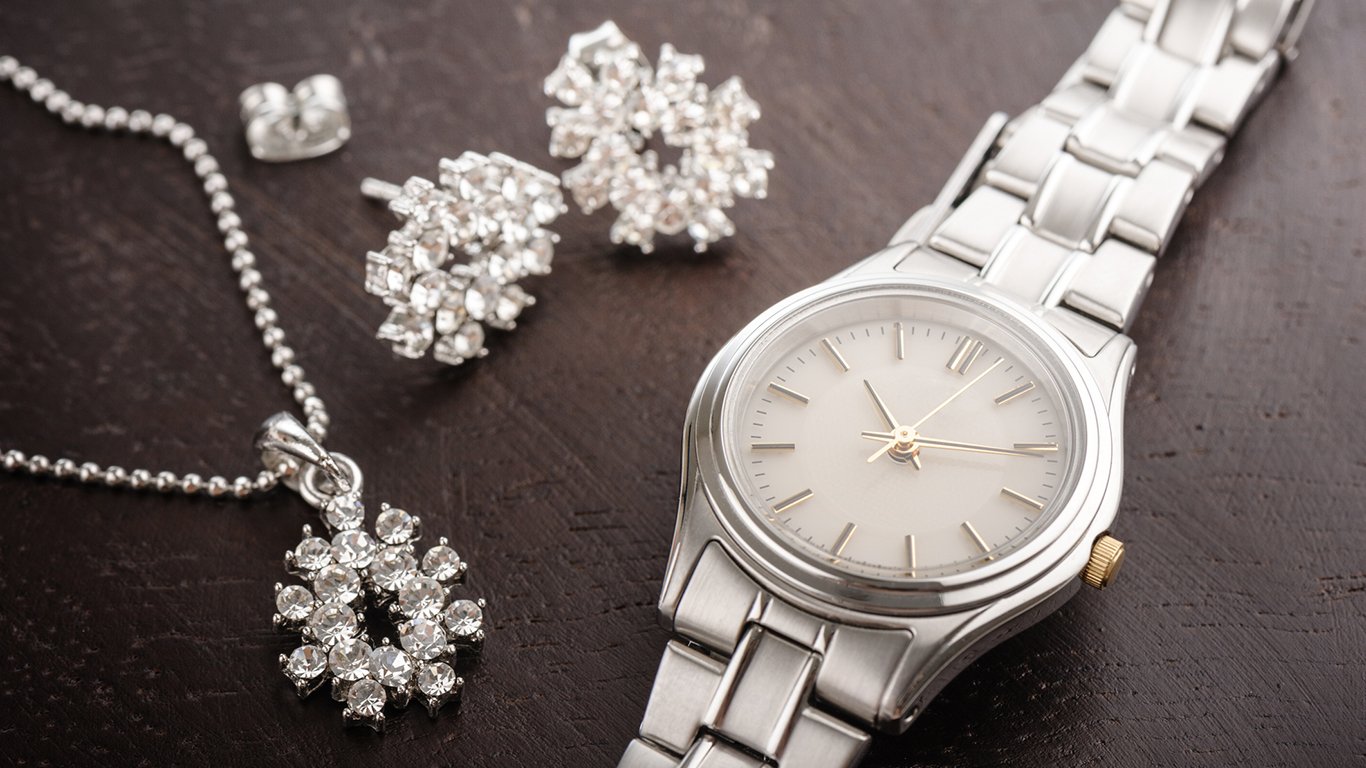
23. Jewelry and watches
> 2017 spending: $875.85 billion
> Share of total expenditure: 0.67%
> 1-year change: +4.50%
> 10-year change: +8.79%

24. Legal services
> 2017 spending: $947.14 billion
> Share of total expenditure: 0.73%
> 1-year change: -0.96%
> 10-year change: -11.15%
[in-text-ad-2]

25. Magazines, newspapers, and stationery
> 2017 spending: $959.42 billion
> Share of total expenditure: 0.73%
> 1-year change: +6.57%
> 10-year change: +42.19%

26. Casinos
> 2017 spending: $976.77 billion
> Share of total expenditure: 0.75%
> 1-year change: +2.53%
> 10-year change: +1.79%
[in-text-ad]

27. Hotels and motels
> 2017 spending: $981.20 billion
> Share of total expenditure: 0.75%
> 1-year change: +4.39%
> 10-year change: +32.34%
[recirclink id=428631]

28. Financial service charges and fees
> 2017 spending: $982.47 billion
> Share of total expenditure: 0.75%
> 1-year change: +4.42%
> 10-year change: -2.12%

29. Public transportation
> 2017 spending: $1.00 trillion
> Share of total expenditure: 0.77%
> 1-year change: +0.35%
> 10-year change: +3.31%
[in-text-ad-2]
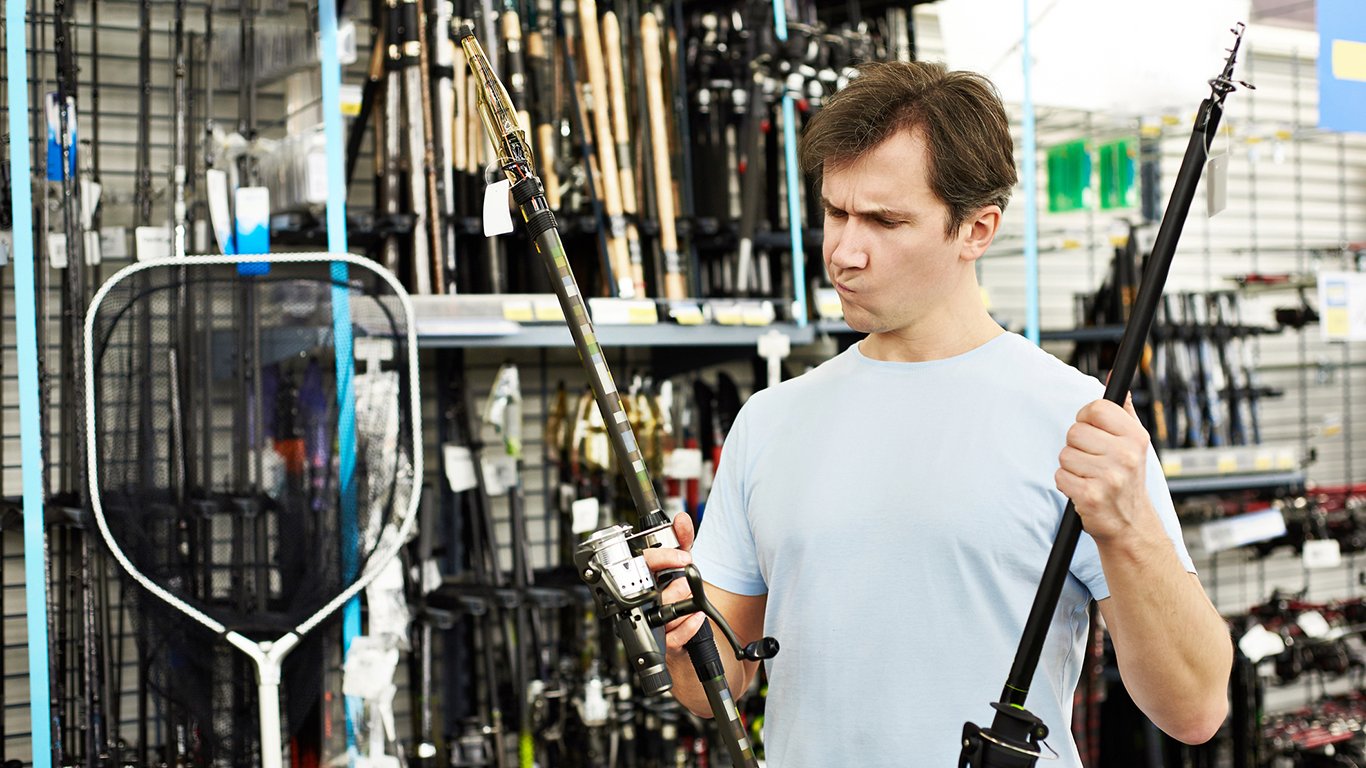
30. Sporting equipment, supplies, guns, and ammunition
> 2017 spending: $1.01 trillion
> Share of total expenditure: 0.77%
> 1-year change: +6.77%
> 10-year change: +58.91%

31. Life and home insurance
> 2017 spending: $1.09 trillion
> Share of total expenditure: 0.83%
> 1-year change: -2.12%
> 10-year change: -8.36%
[in-text-ad]

32. Internet
> 2017 spending: $1.35 trillion
> Share of total expenditure: 1.03%
> 1-year change: +7.78%
> 10-year change: +180.15%
[recirclink id=428770]
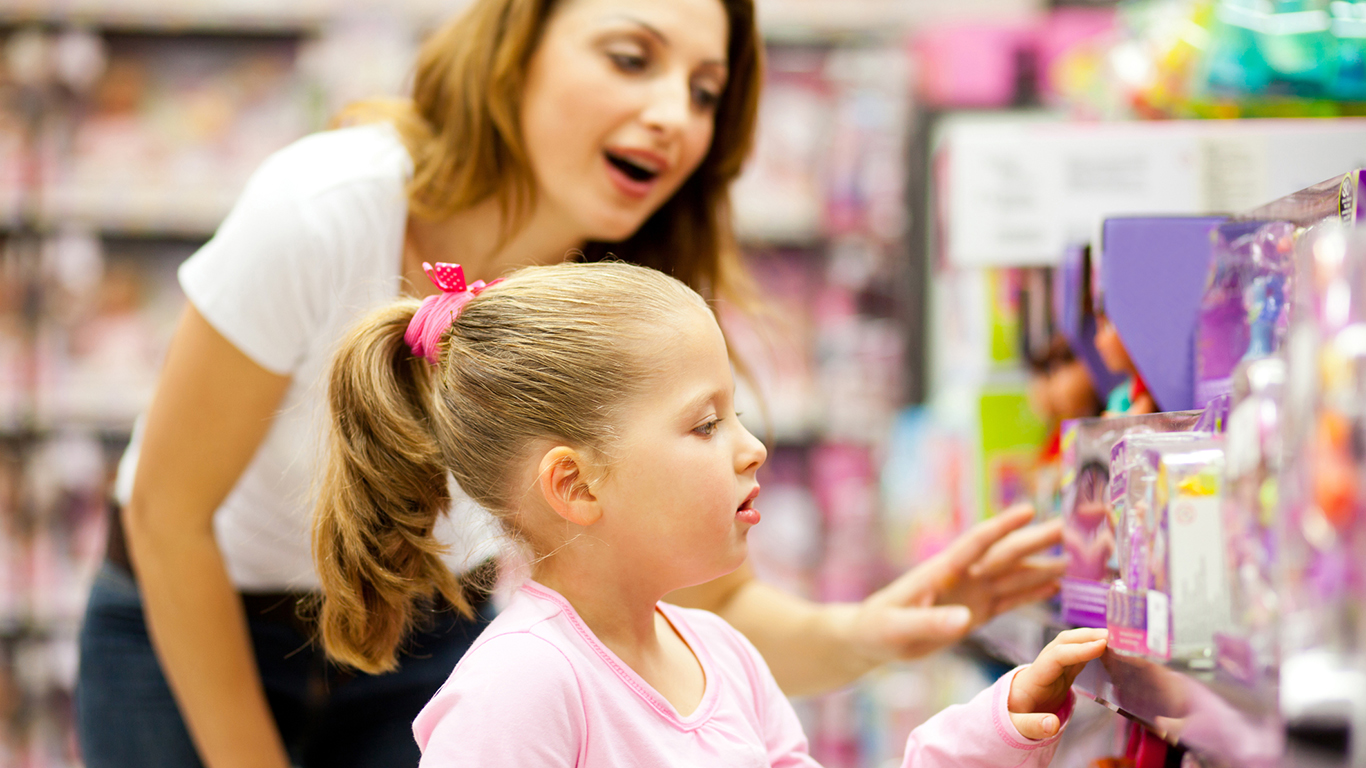
33. Games, toys, and hobbies
> 2017 spending: $1.38 trillion
> Share of total expenditure: 1.06%
> 1-year change: +15.46%
> 10-year change: +185.10%
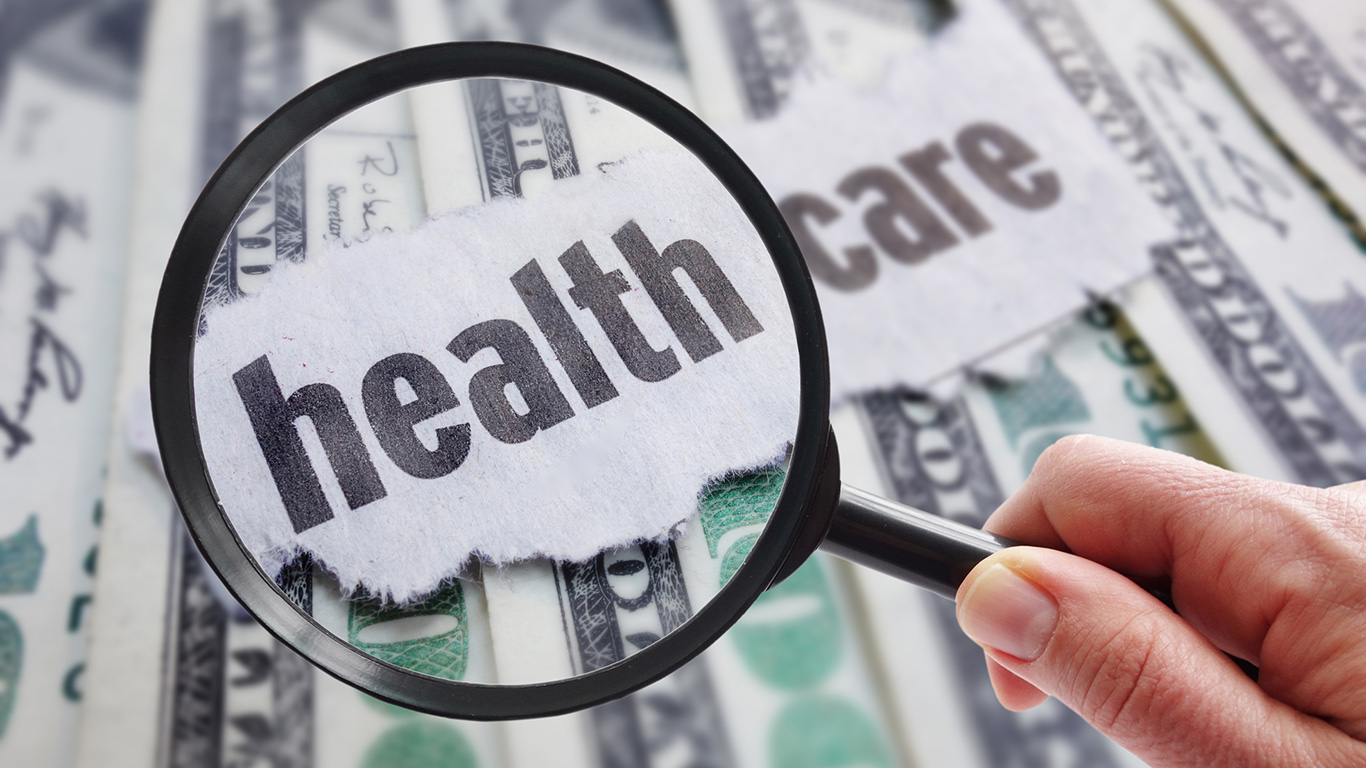
34. Health insurance
> 2017 spending: $1.46 trillion
> Share of total expenditure: 1.12%
> 1-year change: +0.89%
> 10-year change: +15.70%
[in-text-ad-2]

35. Spirits, wine, and beer
> 2017 spending: $1.48 trillion
> Share of total expenditure: 1.14%
> 1-year change: +2.30%
> 10-year change: +24.43%
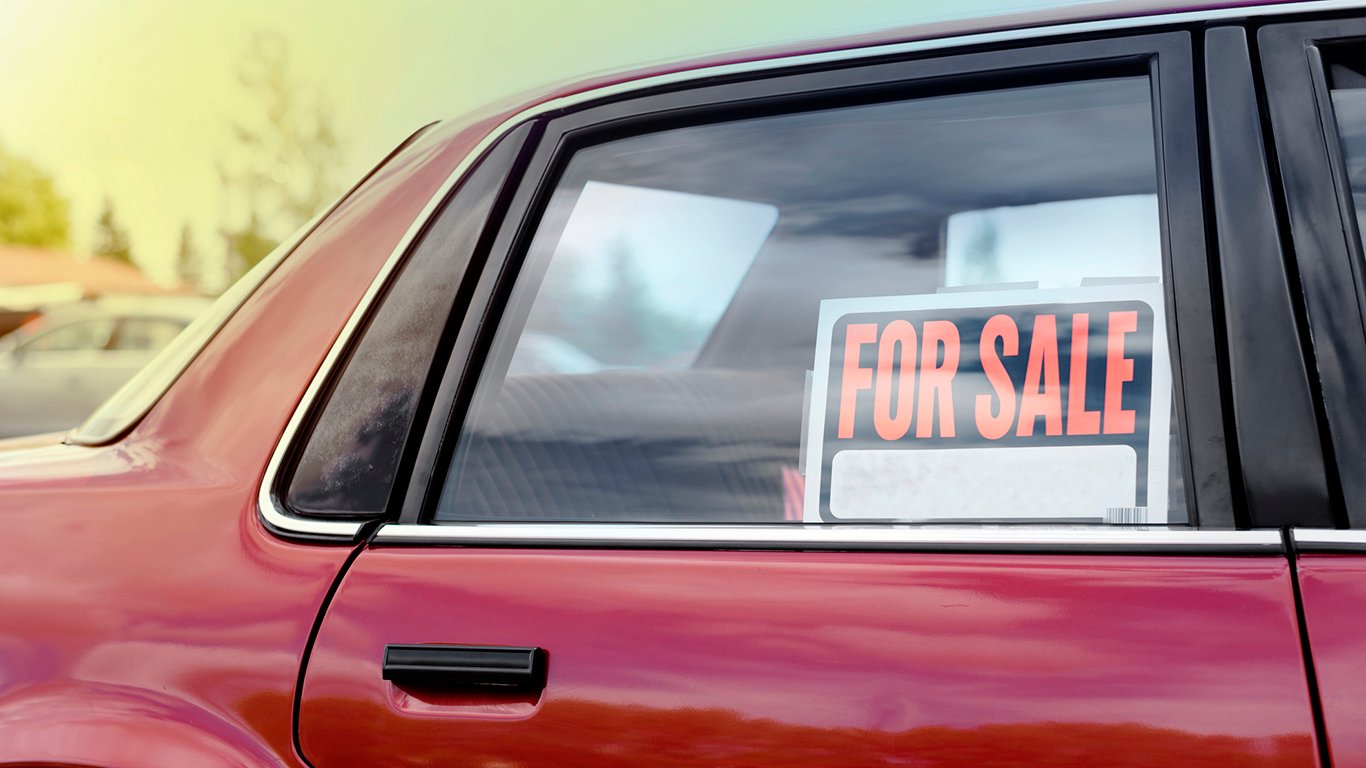
36. Used motor vehicles
> 2017 spending: $1.50 trillion
> Share of total expenditure: 1.15%
> 1-year change: +9.48%
> 10-year change: +36.75%
[in-text-ad]

37. Personal care products
> 2017 spending: $1.56 trillion
> Share of total expenditure: 1.19%
> 1-year change: +3.88%
> 10-year change: +39.47%
[recirclink id=428675]

38. Higher education
> 2017 spending: $1.56 trillion
> Share of total expenditure: 1.19%
> 1-year change: +0.48%
> 10-year change: -1.86%
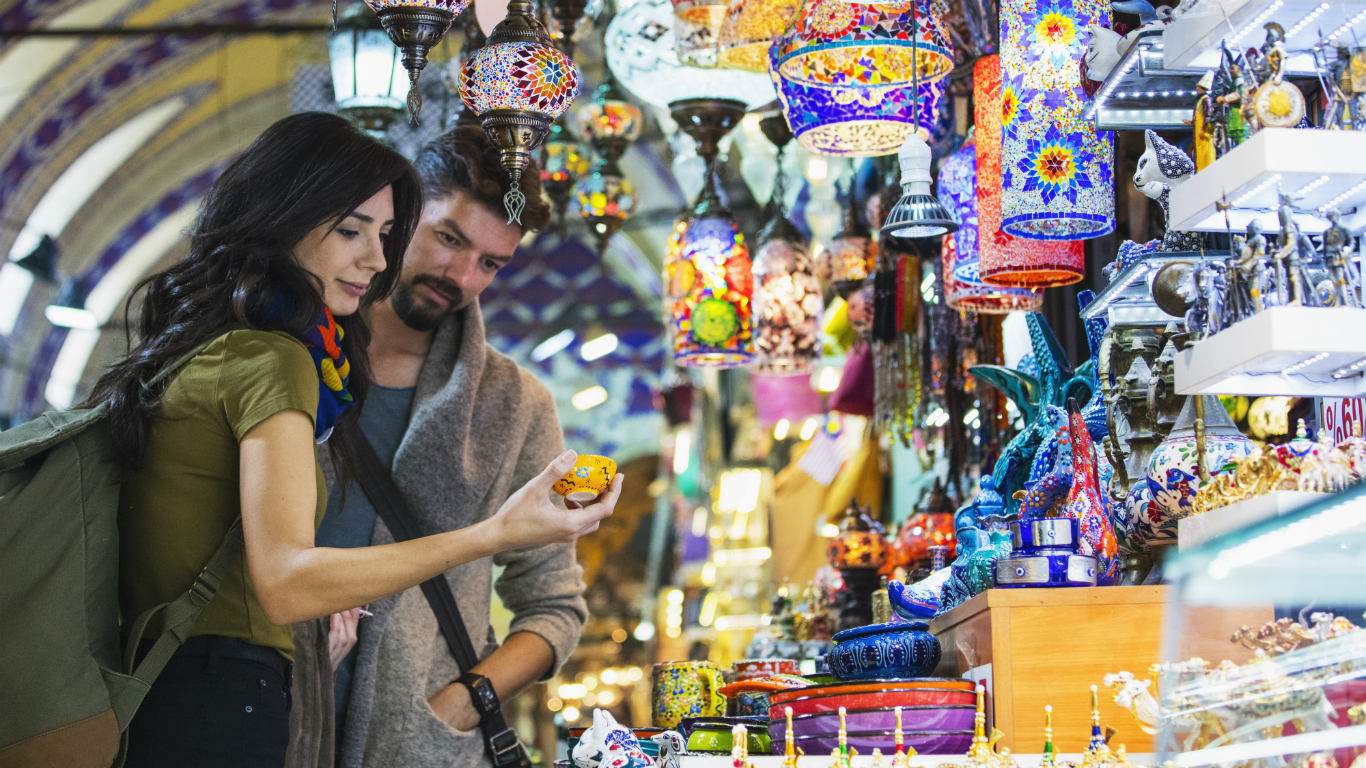
39. Foreign travel and expenditures abroad by U.S. residents
> 2017 spending: $1.77 trillion
> Share of total expenditure: 1.35%
> 1-year change: +4.69%
> 10-year change: +38.97%
[in-text-ad-2]

40. Cellphone plans
> 2017 spending: $1.77 trillion
> Share of total expenditure: 1.36%
> 1-year change: +12.10%
> 10-year change: +92.96%
41. Televisions
> 2017 spending: $1.97 trillion
> Share of total expenditure: 1.51%
> 1-year change: +18.74%
> 10-year change: +686.37%
[in-text-ad]

42. New cars
> 2017 spending: $2.81 trillion
> Share of total expenditure: 2.16%
> 1-year change: +3.01%
> 10-year change: +9.91%
[recirclink id=428583]

43. Gasoline and other motor fuel
> 2017 spending: $2.84 trillion
> Share of total expenditure: 2.17%
> 1-year change: -1.06%
> 10-year change: -2.45%
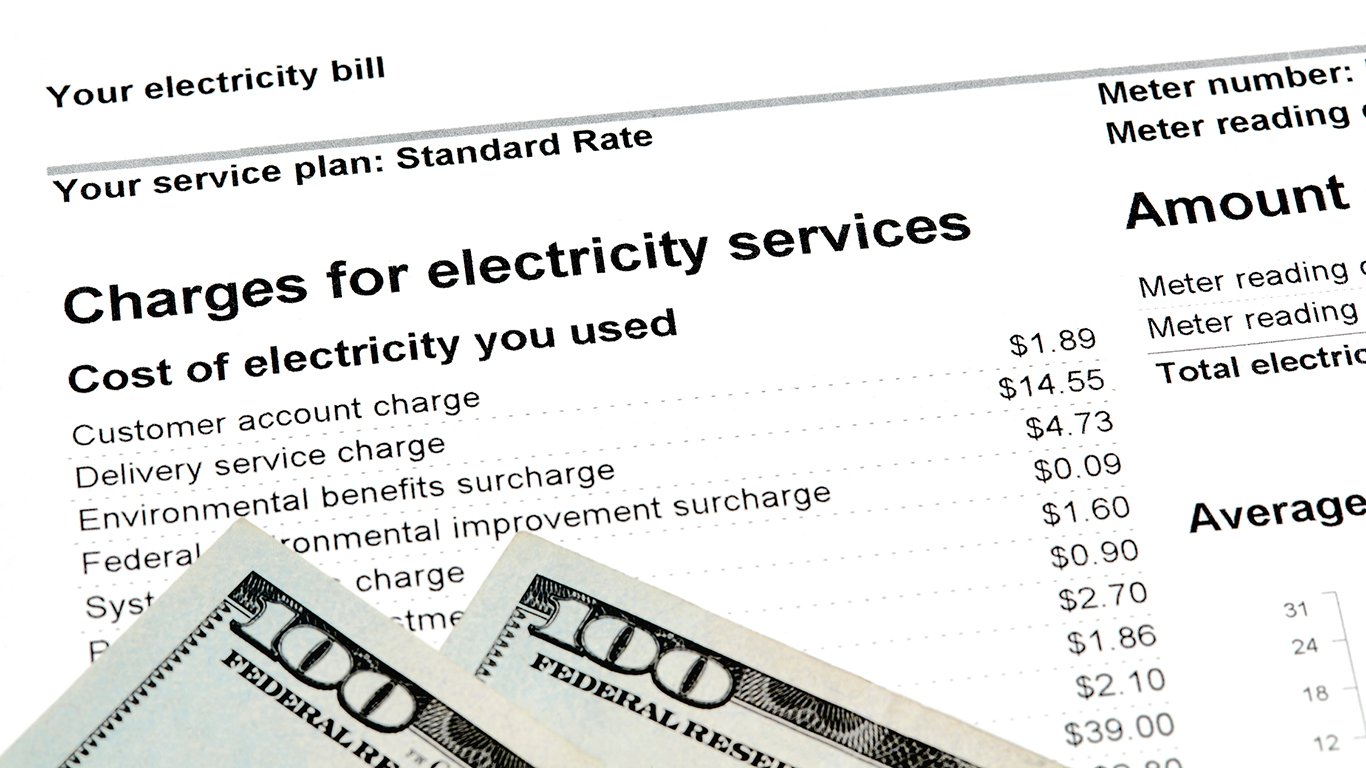
44. Water, garbage collection, electricity and gas utilties
> 2017 spending: $3.07 trillion
> Share of total expenditure: 2.35%
> 1-year change: -1.28%
> 10-year change: -5.22%
[in-text-ad-2]
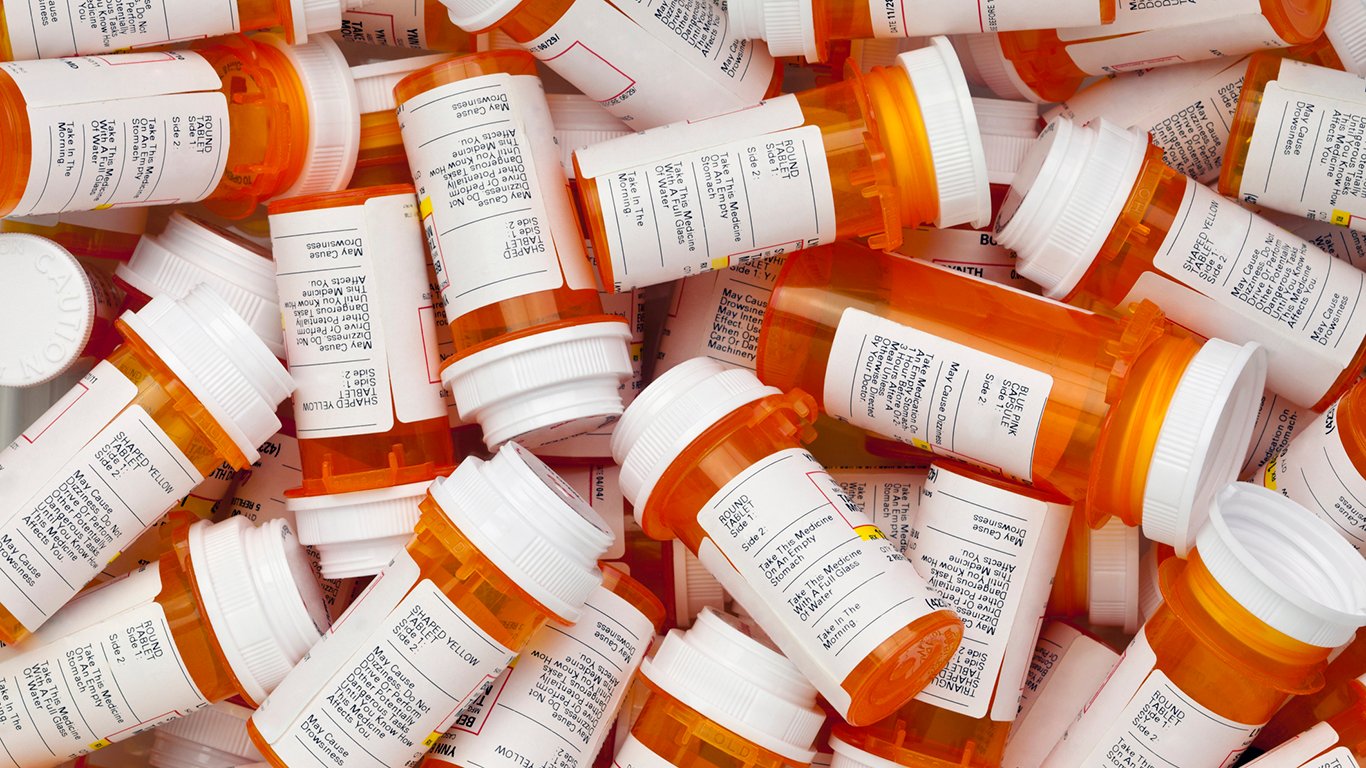
45. Prescription drugs
> 2017 spending: $3.74 trillion
> Share of total expenditure: 2.87%
> 1-year change: +1.49%
> 10-year change: +27.51%

46. Clothing and footwear
> 2017 spending: $4.24 trillion
> Share of total expenditure: 3.25%
> 1-year change: +2.01%
> 10-year change: +19.08%
[in-text-ad]
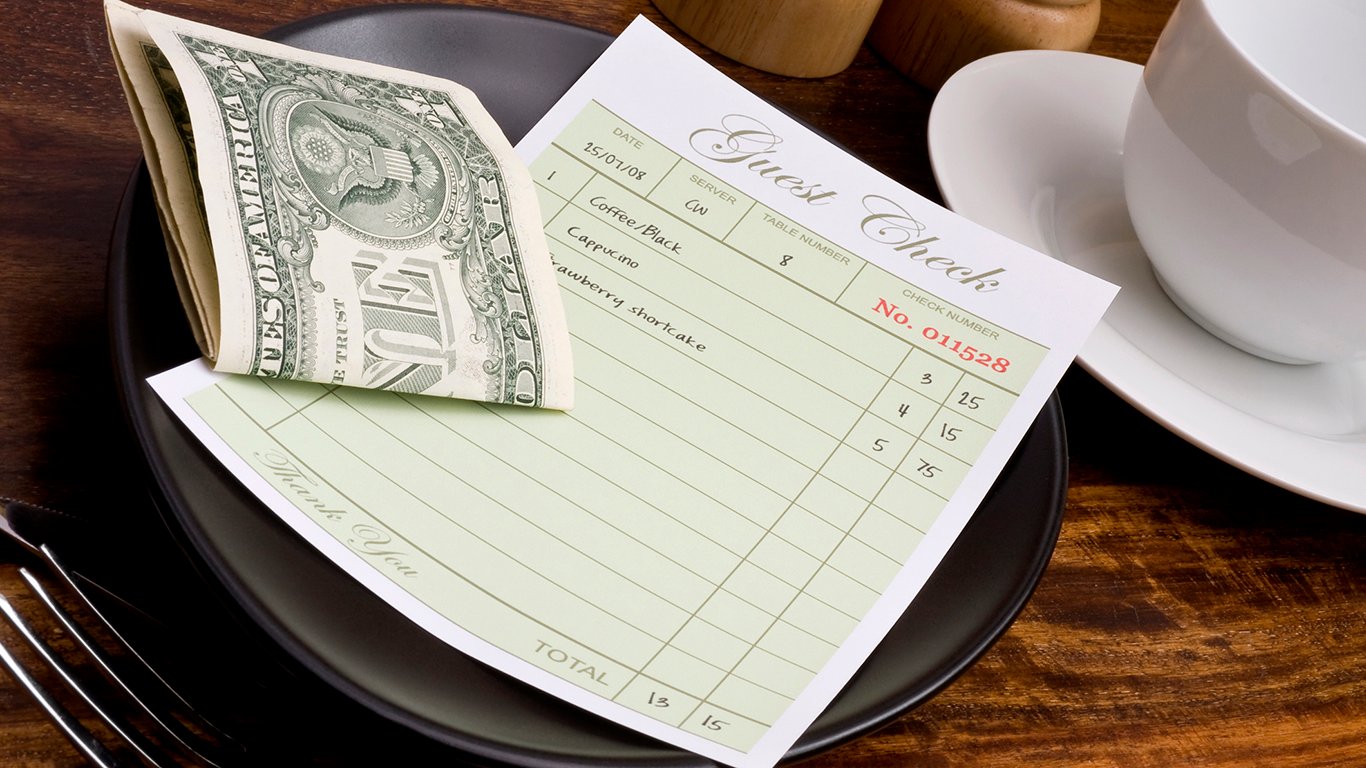
47. Restaurants and bars
> 2017 spending: $5.61 trillion
> Share of total expenditure: 4.30%
> 1-year change: +0.84%
> 10-year change: +15.65%
[recirclink id=428400]

48. Physician and dental visits
> 2017 spending: $6.68 trillion
> Share of total expenditure: 5.12%
> 1-year change: +4.40%
> 10-year change: +25.80%

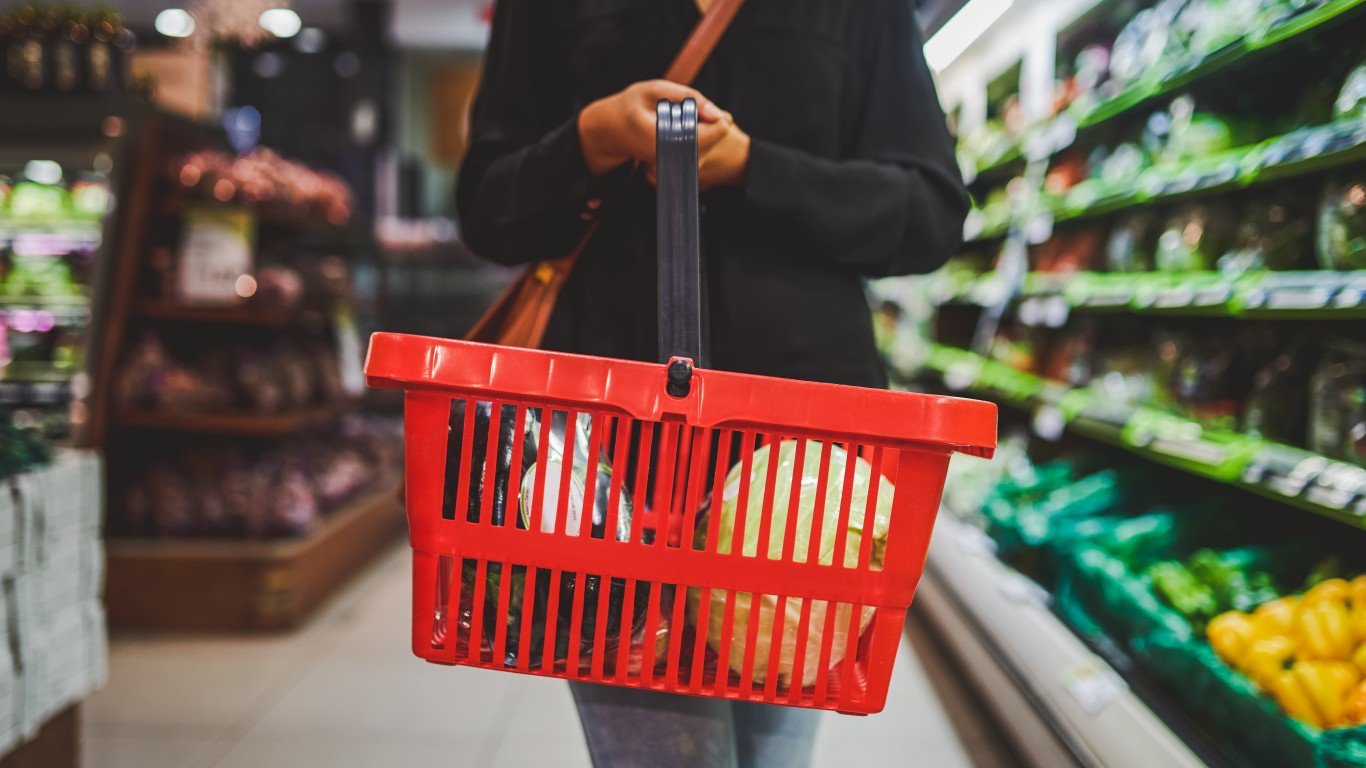
49. Groceries
> 2017 spending: $7.89 trillion
> Share of total expenditure: 6.04%
> 1-year change: +2.49%
> 10-year change: +5.14%
[in-text-ad-2]
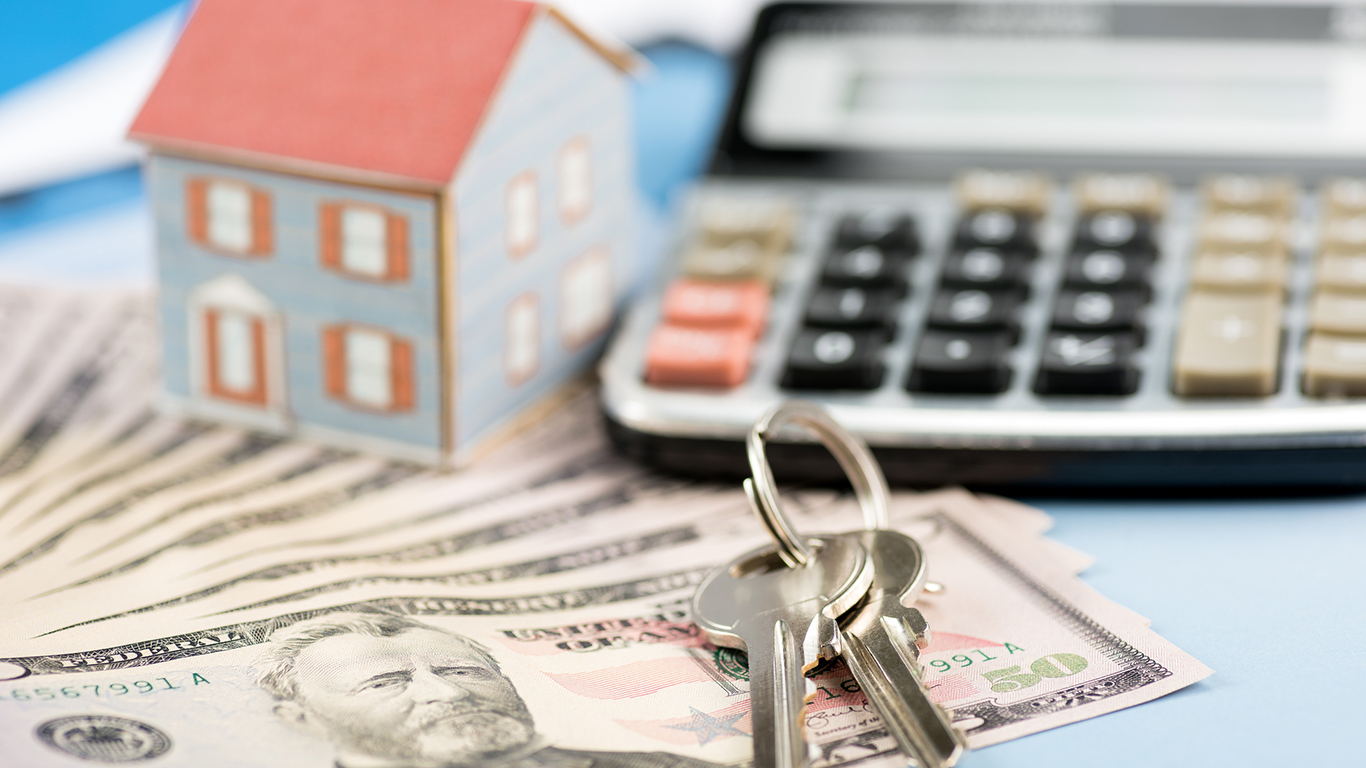
50. Occupied housing payments
> 2017 spending: $19.39 trillion
> Share of total expenditure: 14.85%
> 1-year change: +1.24%
> 10-year change: +14.01%
Detailed Findings & Methodology
Since unemployment peaked at 10.0% in October 2009, the U.S. economy has been on a steady recovery from the Great Recession. The U.S. unemployment rate has since fallen to 4.1%, its lowest point since December of 2001. Monthly consumer spending has increased by 22.6% since its recessionary trough, and it is 51.8% greater than it was at the turn of the millenium.
The largest consumer spending categories consist of necessary expenses. Housing and utilities, health care, and groceries haved accounted for approximately 40% of all consumer spending in 2017. The remaining three-fifths of expenditure categories are largely based on discretionary spending and are more subject to changing consumer tastes, preferences, and disposable income.
Tobacco was one of the only major consumer spending categories to decline over the past year. From 1999 to 2014, the U.S. adult smoking rate fell from 23.5% to 16.8%. Over the same period, spending on tobacco products fell by 44.8% and continues to decline. Americans spent a total $863.2 billion on tobacco in 2017, down 3.1% from 2016.
Changes in consumer spending in 2017 largely reflect the major technological developments of the past decade. For example, spending on cell phone plans, internet, and televisions together rose more than four times as much as overall personal consumption expenditure. Meanwhile, spending on CDs and tapes, landline telephone services, first-class mail, and taxicabs fell more than nearly any other good or service.
Some of the consumer spending categories that grew the most in 2017 are those that often rise in tandem with consumer confidence and income, as well as with falling unemployment. Americans spent $444.5 billion on boats, private planes, and other recreational vehicles in 2017, a 16.7% increase from 2016. Other luxury goods and services Americans spent far more on in 2017 compared to the year before include games, toys, hobbies, books, amusement parks and campgrounds, carpets and other floor coverings, flowers, and bar food.
To determine what Americans spent in 2017, 24/7 Wall St. analyzed real personal consumption expenditures from January to November 2017 from the Bureau of Economic Analysis. We identified some 50 goods and services at varying levels of detail to be representative of the U.S. economy and the trends affecting consumer spending in 2017. We compared consumption expenditure figures for the periods of January to November 2017 and January to November 2016, as well as the periods January to November 2017 and January to November 2007.
Contact [email protected] for any questions or corrections.