[cnxvideo id=”655408″ placement=”ros”]The United States was home to 46 million senior citizens as of 2016 — about 15% of the total population. By 2060, the number of Americans 65 and older is projected to more than double to nearly 100 million and comprise roughly 24% of the total population. As the country ages and the number of retirement-age citizens hits all-time highs, the health and well-being of American seniors is more important than ever.
The quality of life for elderly Americans often depends on the facilities, businesses, and living conditions in their home state. As is the case for Americans of any age, senior citizens are more likely to be happy and healthy if they are financially secure and living in a safe area with a low crime rate. Other factors, including access to public transportation, medical treatment facilities, and social venues, are often far more important for elderly Americans than for other age groups.
As these and other social and environmental factors vary by region, so too does the quality of life of elderly Americans. 24/7 Wall St. created an index of over a dozen measures related to income, health, environment, and access to amenities to identify the best (and worst) states to grow old in. While the best states for the elderly span the country, the worst states are almost exclusively in the South.
Click here to see the best (and worst) states to grow old in.
Click here to see our detailed findings.
Click here to see our methodology.

1. New Hampshire
> Pct. of pop. age 65 and up: 17.0% (9th highest)
> 65 and over poverty rate: 4.6% (2nd lowest)
> 65 and over bachelor’s deg. attainment: 33.3% (5th highest)
> Life expectancy at birth: 80.2 years (9th highest)
Supplemental retirement income can be the difference between poverty and financial security for many elderly Americans. In New Hampshire, 51.1% of households led by adults 65 and older receive some sort of retirement income other than Social Security, one of the larger shares of any state. Only 4.6% of elderly residents in the state live below the poverty line, the second smallest share of any state.
The relative financial security among New Hampshire’s oldest residents means they are more likely to be able to afford healthy lifestyles, preventative medical care, and medical treatment. Partially as a result, life expectancy in the Granite State is 80.2 years, more than a year longer than the national life expectancy of 79.1 years.
[in-text-ad]
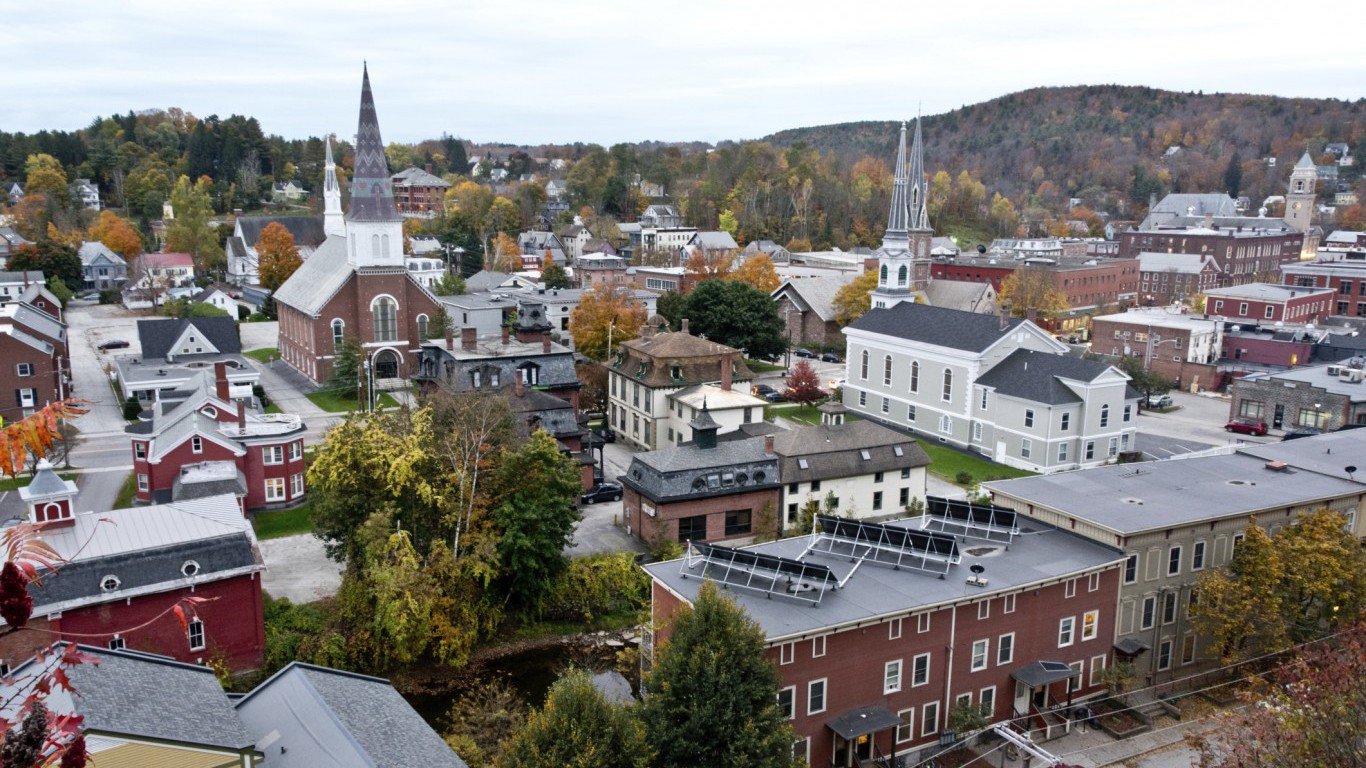
2. Vermont
> Pct. of pop. age 65 and up: 18.2% (4th highest)
> 65 and over poverty rate: 8.7% (23rd highest)
> 65 and over bachelor’s deg. attainment: 34.5% (2nd highest)
> Life expectancy at birth: 80.2 years (7th highest)
Second only to its neighbor to the east, Vermont is one of the best states to grow old in. One of Vermont’s strongest attributes as a liveable state for elderly Americans is the concentration of social venues, as remaining socially connected in retirement can greatly increase overall quality of life for senior citizens. There are about 13 social associations such as civic organizations, bowling centers, golf clubs, fitness centers, and sports organizations for every 10,000 Vermonters, a higher concentration than in all but six other states.
The Green Mountain State is also one of the safest places in the country. There are only 158 violent crimes for every 100,000 state residents, the second lowest violent crime rate among states and well below the nationwide violent crime rate of 397 incidents per 100,000.
[recirclink id=434202]
3. Minnesota
> Pct. of pop. age 65 and up: 15.0% (18th lowest)
> 65 and over poverty rate: 7.2% (7th lowest)
> 65 and over bachelor’s deg. attainment: 27.5% (23rd highest)
> Life expectancy at birth: 80.9 years (2nd highest)
For Americans past working age, supplemental retirement income can be the difference between poverty and financial security. Some 92.2% of 65 and over households in Minnesota receive Social Security benefits, one of the larger shares of any state. Only 7.2% of the 65 and older population lives below the poverty line, well below the 9.2% elderly poverty rate nationwide. Additionally, goods and services are 2.6% cheaper on average across the state than they are nationwide.
Minnesota residents are also more likely to live longer than most Americans. Life expectancy at birth in the state is 80.9 years — nearly two years longer than the average life expectancy nationwide. A high concentration of hospitals across the state may be one factor contributing to positive health outcomes. There are approximately 16 hospitals for every 100,000 elderly Minnesota residents, well above the nationwide concentration of 10 per 100,000.

4. Virginia
> Pct. of pop. age 65 and up: 14.6% (10th lowest)
> 65 and over poverty rate: 7.8% (15th lowest)
> 65 and over bachelor’s deg. attainment: 31.3% (9th highest)
> Life expectancy at birth: 79.2 years (24th highest)
Low crime rates not only suggest residents are relatively safe, but also that they have a higher quality of life, as a high crime rate can have psychological impacts and other effects on a population. In Virginia, there are only 218 violent crimes for every 100,000 residents, nearly the fewest of any state and well below the U.S. violent crime rate of 397 incidents per 100,000 people.
Along with safety, financial security can be a critical factor in post-retirement life. In Virginia, the typical elderly household earns $49,755 a year — over $7,500 more than the national median income among the age group.
[in-text-ad-2]

5. Massachusetts
> Pct. of pop. age 65 and up: 15.8% (24th highest)
> 65 and over poverty rate: 8.5% (24th lowest)
> 65 and over bachelor’s deg. attainment: 34.1% (3rd highest)
> Life expectancy at birth: 80.4 years (5th highest)
Driving is either not an option or can be relatively dangerous for many elderly Americans, as reaction time and vision can begin to deteriorate in older age. For many Massachusetts residents, however, driving is not a necessity. Indicative of walkable communities and effective transit infrastructure, some 14.9% of the state’s working population commutes by either walking or using public transit, the second largest share of any state.
Massachusetts also boasts one of the highest average life expectancies in the country. Life expectancy at birth is 80.4 years, over a year longer than the national life expectancy of 79.1 years.
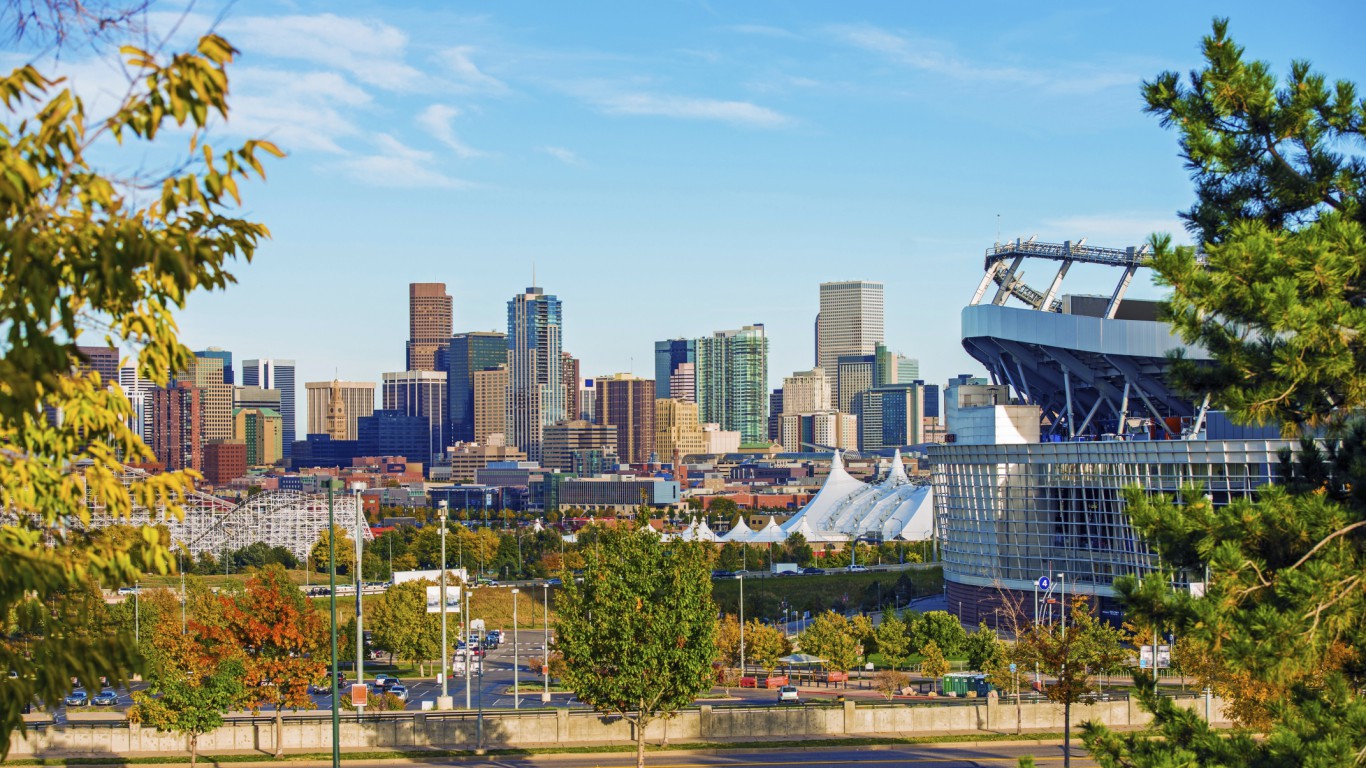
6. Colorado
> Pct. of pop. age 65 and up: 13.4% (5th lowest)
> 65 and over poverty rate: 7.6% (11th lowest)
> 65 and over bachelor’s deg. attainment: 37.3% (the highest)
> Life expectancy at birth: 80.2 years (8th highest)
Better-educated Americans tend to report higher incomes and live longer lives. In Colorado, 37.3% of residents age 65 and up have a bachelor’s degree or higher, the largest share of any state. The state’s higher educational attainment has likely led to a higher degree of financial security among retirement-age residents. The typical 65 year and older household in the state earns $48,285 a year, nearly $6,200 more than the typical American elderly household.
Colorado’s residents are also more likely to live longer lives than most Americans. Life expectancy at birth in the state is 80.2 years, about a year longer than the average life expectancy nationwide of 79.1 years.
[in-text-ad]
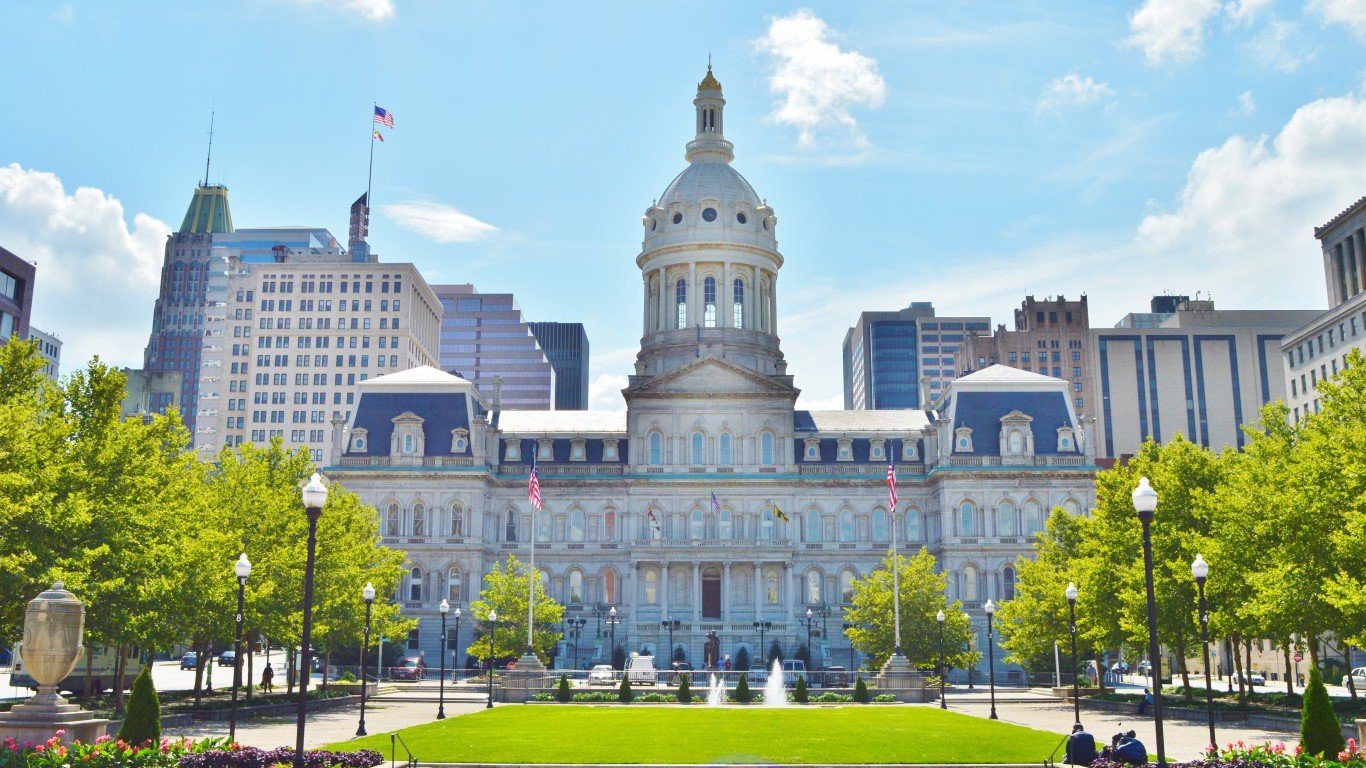
7. Maryland
> Pct. of pop. age 65 and up: 14.6% (9th lowest)
> 65 and over poverty rate: 8.2% (21st lowest)
> 65 and over bachelor’s deg. attainment: 34.0% (4th highest)
> Life expectancy at birth: 79.2 years (25th highest)
Many American retirees rely only on their savings for income, which can leave them unprepared for unanticipated expenses. In Maryland, some 56.6% of households headed by someone 65 or older have some form of supplemental retirement income other than Social Security, the third largest share among states and well above the 48.8% of elderly households nationwide.
Better-educated populations tend to live longer, healthier lives, and in Maryland, 34.0% of residents age 65 and older have a bachelor’s degree — the fourth largest share among states.
[recirclink id=434095]
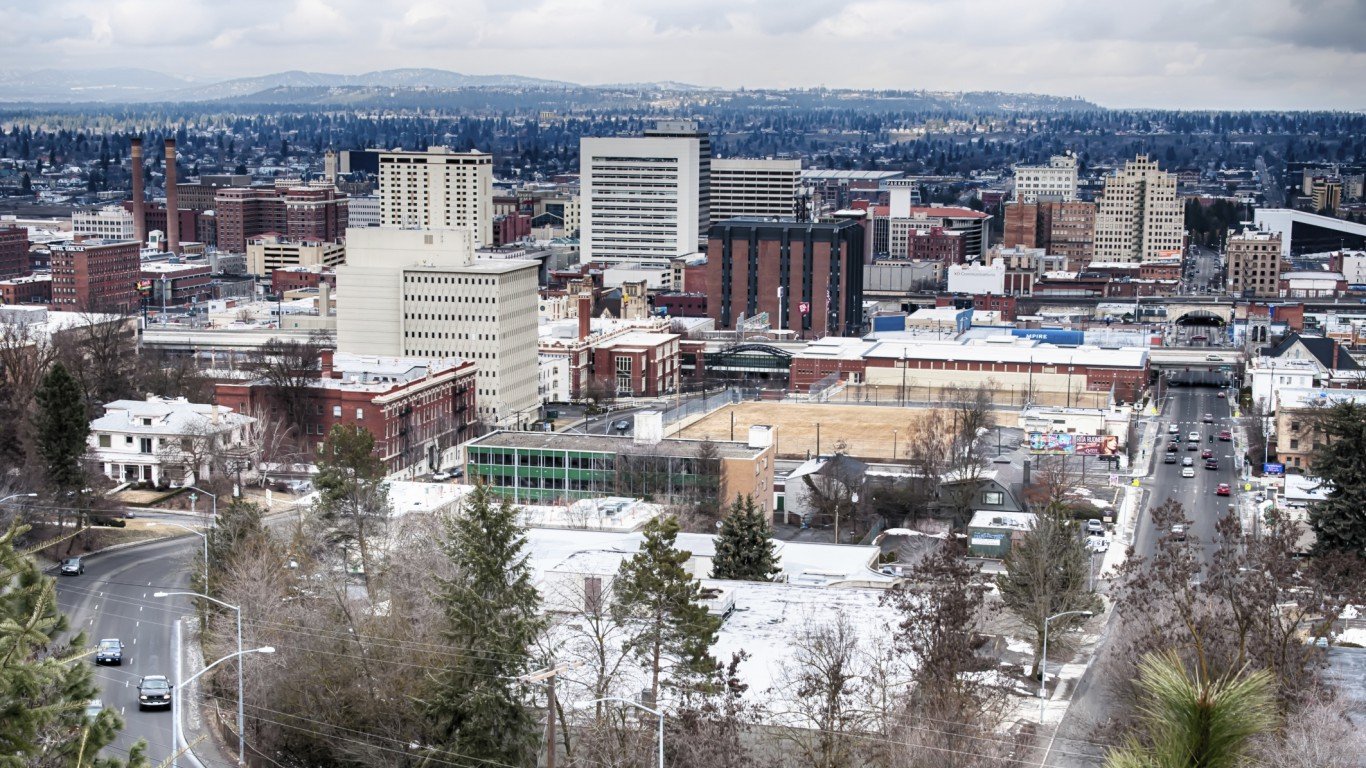
8. Washington
> Pct. of pop. age 65 and up: 14.8% (12th lowest)
> 65 and over poverty rate: 7.6% (11th lowest)
> 65 and over bachelor’s deg. attainment: 32.4% (6th highest)
> Life expectancy at birth: 80.0 years (11th highest)
Reaction times and vision can begin to deteriorate in older age. As a result, driving is either not an option or relatively dangerous for many elderly Americans. For many Washington state residents, however, driving is not a necessity. Indicative of walkable communities and effective transit infrastructure, some 10.1% of the state’s working population commutes either by walking or using public transit, one of the largest shares of any state.
Washington is also a relatively safe state, a positive factor for residents of all ages. There are only 302 violent crimes for every 100,000 state residents annually, below the national violent crime rate of 397 incidents per 100,000 Americans.
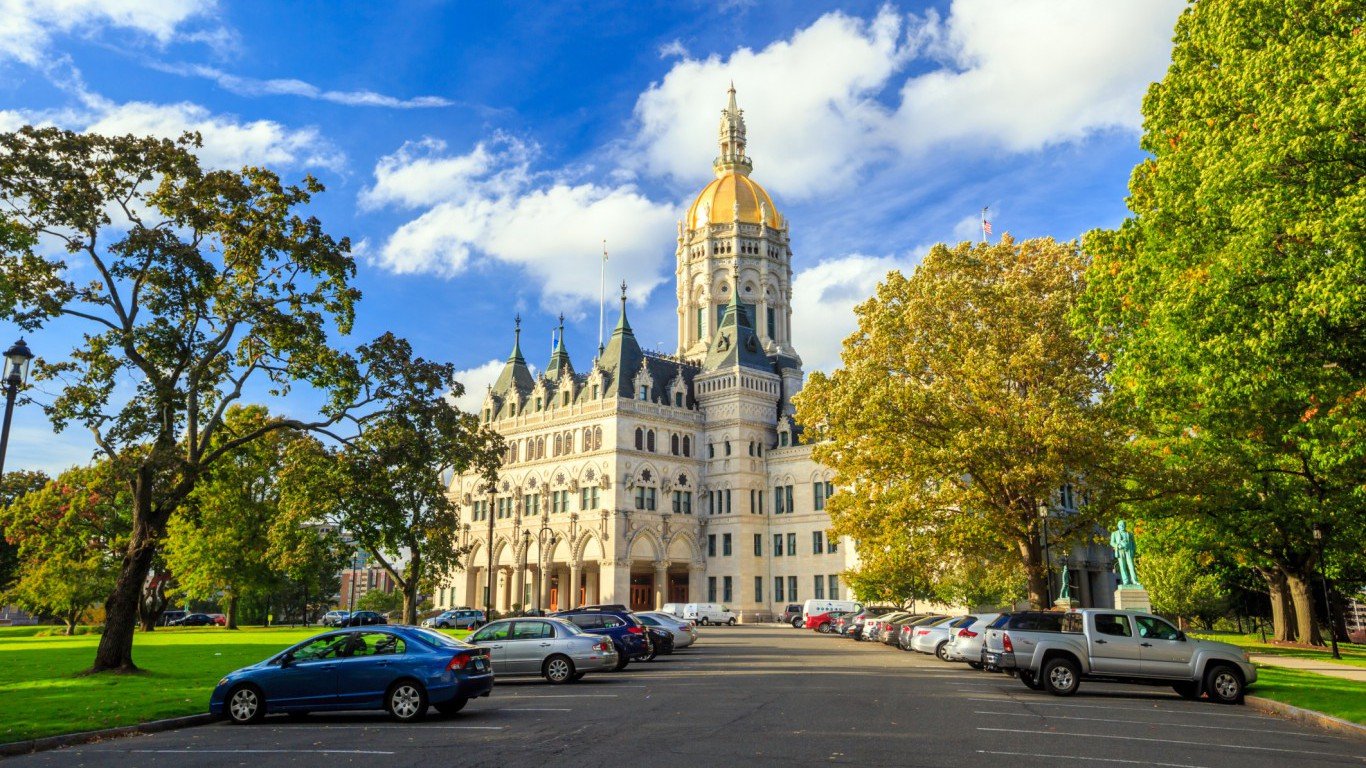
9. Connecticut
> Pct. of pop. age 65 and up: 16.1% (19th highest)
> 65 and over poverty rate: 6.5% (3rd lowest)
> 65 and over bachelor’s deg. attainment: 31.4% (8th highest)
> Life expectancy at birth: 80.6 years (4th highest)
Connecticut is one of four New England states to rank among the best places for elderly Americans to live. Life expectancy at birth in the state is 80.6 years, about a year and a half longer than the average life expectancy nationwide. Financial security can greatly improve quality of life during retirement, and only 6.5% of Connecticut’s 65 and older population live below the poverty line, the third smallest share of any state.
Not only are elderly Connecticut residents generally financially secure, but also they are largely safe from physical harm. There are only 227 violent crimes for every 100,000 people in the state, the fifth lowest violent crime rate of all states.
[in-text-ad-2]
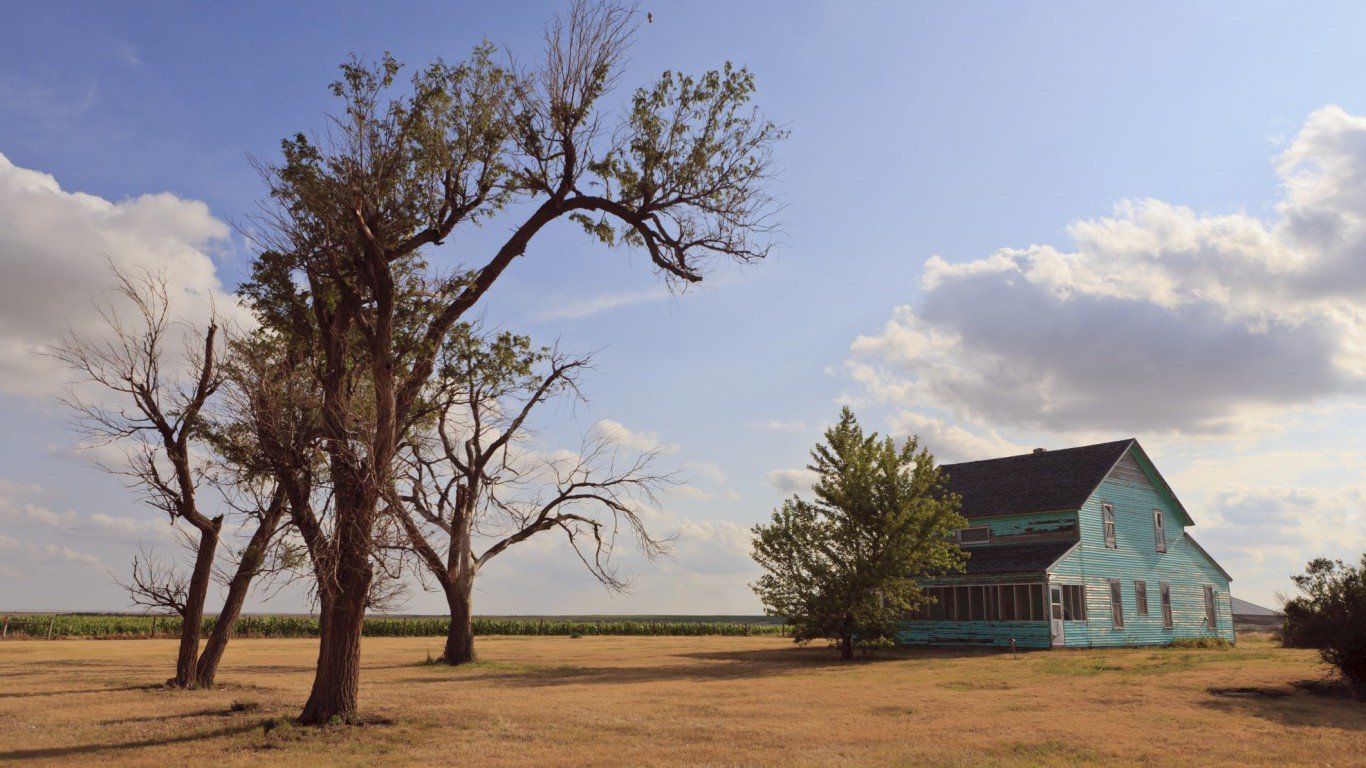
10. Kansas
> Pct. of pop. age 65 and up: 15.1% (20th lowest)
> 65 and over poverty rate: 8.0% (17th lowest)
> 65 and over bachelor’s deg. attainment: 27.0% (24th highest)
> Life expectancy at birth: 78.7 years (22nd lowest)
By a number of measures assessing income, poverty, and access to health care for elderly Americans, Kansas ranks as one of the best states to grow old in. Some 92.2% of Kansas households led by adults 65 and older receive Social Security benefits, one of the larger shares of any state. Social Security can be the difference between poverty and financial security for many elderly residents, and just 8.0% of Kansas residents age 65 and over live in poverty — less than the 9.2% national poverty rate for age group and the one of the smaller shares of any state.
Kansas’ elderly population may also have more access to health care than the average senior citizen. There are approximately 31 hospitals per 100,000 senior citizens in the state, more than three times the national figure and the fifth highest concentration of any state.
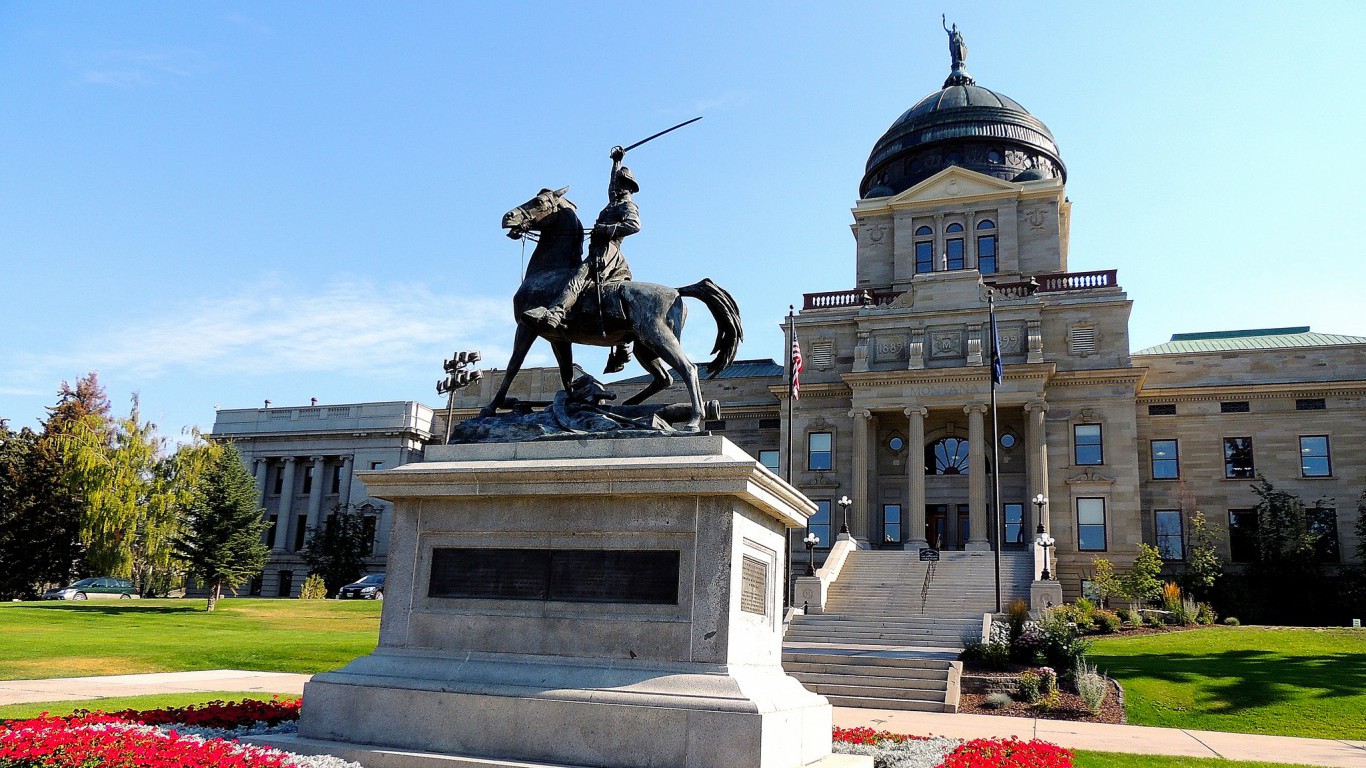
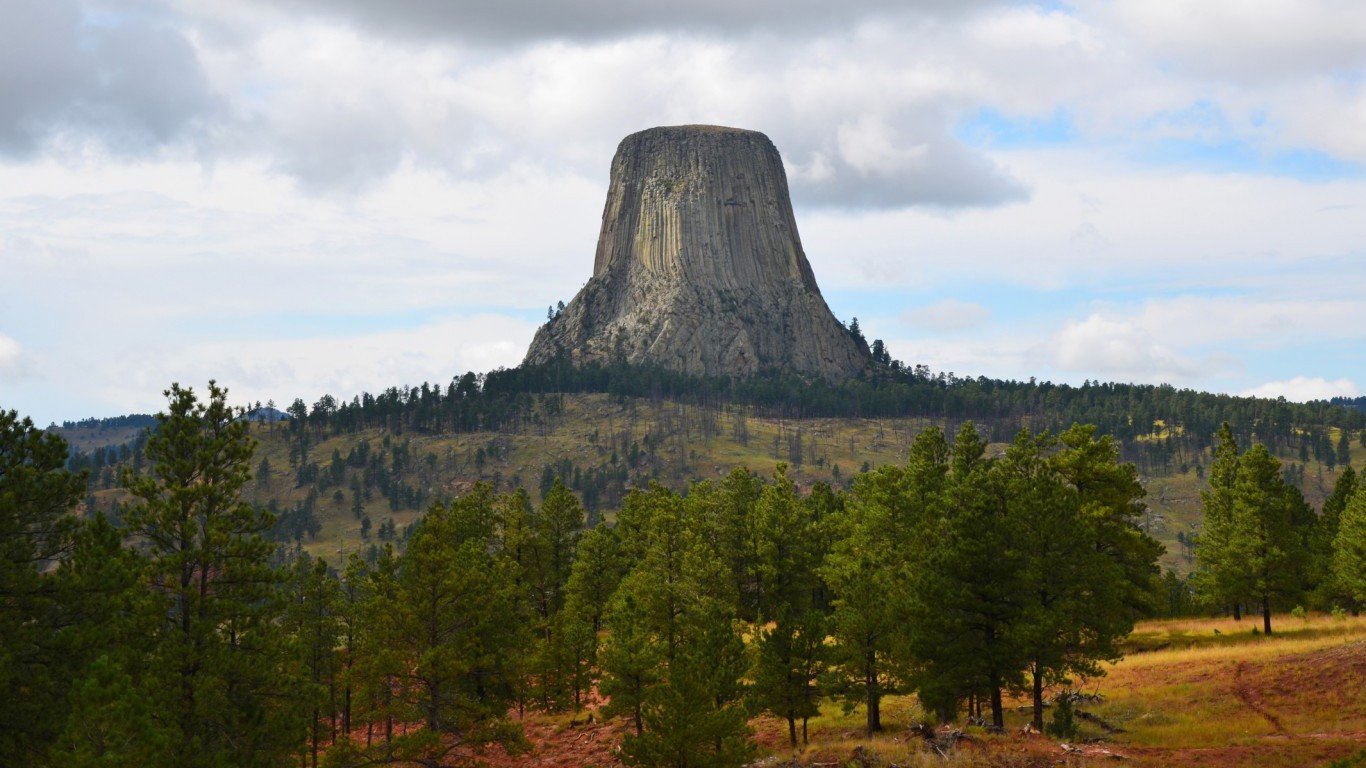
11. Montana
> Pct. of pop. age 65 and up: 17.6% (5th highest)
> 65 and over poverty rate: 8.9% (20th highest)
> 65 and over bachelor’s deg. attainment: 29.0% (16th highest)
> Life expectancy at birth: 78.9 years (24th lowest)
Relative to its total population, Montana has one of the larger elderly populations. An estimated 17.6% of residents in the state are 65 and older, the fifth largest share in the country. Montana senior citizens are more likely to have a college education and receive Social Security income than the average elderly American. Some 29.0% of adults 65 and over have a bachelor’s degree, slightly more than the 26.7% national college attainment rate for the age group. Additionally, 92.5% of households led by a senior citizen receive Social Security benefits, the eighth largest share of any state. Despite the income supplement, the typical elderly household earns just $37,616 a year, nearly $4,500 less than the comparable U.S. median.
Montana’s senior population may also have better access to health care than the majority of elderly Americans. There are 34 hospitals in the state per 100,000 residents age 65 and over, the most of any state other than North and South Dakota.
[in-text-ad]
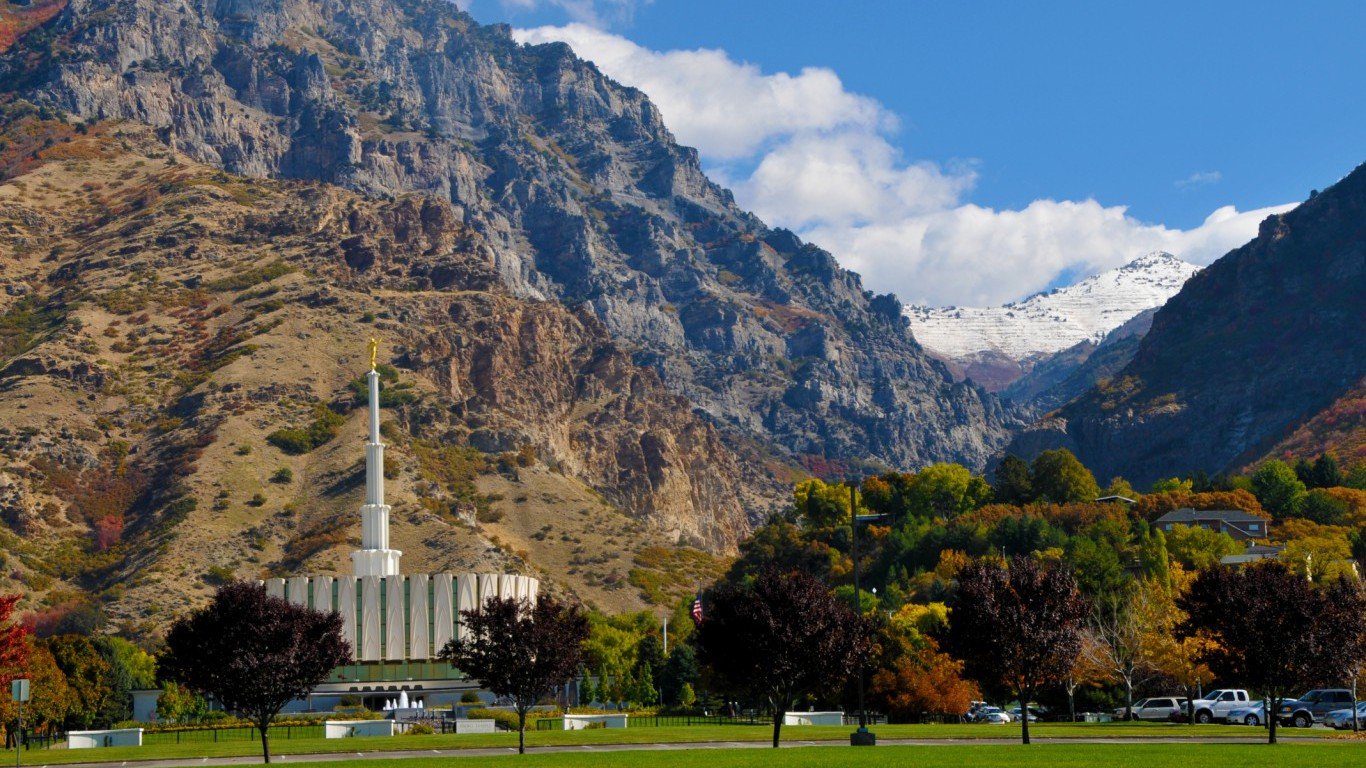
12. Utah
> Pct. of pop. age 65 and up: 10.5% (2nd lowest)
> 65 and over poverty rate: 6.7% (4th lowest)
> 65 and over bachelor’s deg. attainment: 31.6% (7th highest)
> Life expectancy at birth: 79.9 years (13th highest)
By a number of measures assessing the education, income, and health of elderly Americans, Utah ranks as one of the better states to grow old in. A college education can help preserve cognitive ability in old age, and 31.6% of adults 65 and over in the state have a bachelor’s degree — the seventh largest share of any state. College-educated adults are also more likely to earn high incomes. The typical household led by a senior citizen in Utah earns $49,308 a year, over $7,000 more than the U.S. median. Just 6.7% of residents 65 and over live in poverty, the fourth smallest share of any state.
Wealth and education are some of the primary factors that can lead to a long, healthy life. The life expectancy at birth in Utah is 79.9 years, about 10 months longer than the U.S. life expectancy and the 13th longest of any state. Approximately 3,955 in every 100,000 senior citizens dies annually, one of the lower elderly mortality rates in the country.
[recirclink id=433891]

13. Oregon
> Pct. of pop. age 65 and up: 16.8% (11th highest)
> 65 and over poverty rate: 7.5% (8th lowest)
> 65 and over bachelor’s deg. attainment: 30.2% (12th highest)
> Life expectancy at birth: 79.4 years (22nd highest)
The typical household led by a resident age 65 and over in Oregon earns $42,779 a year, roughly $700 more than the national median income among elderly households. Just 7.5% of Oregon seniors live in poverty, the eighth smallest share of any state. High incomes are often associated with high educational attainment, and 30.2% of residents 65 and over in Oregon have a bachelor’s degree — higher than the 26.7% national college attainment rate for seniors.
One factor that contributes to well-being in old age is freedom of movement. Walkable areas with access to public transportation allow residents a greater degree of mobility and physical activity, particularly for senior citizens. Indicative of the state’s walkability and effective transit infrastructure, some 8.0% of commuters in Oregon walk or take public transportation to work, the 10th largest share of any state.
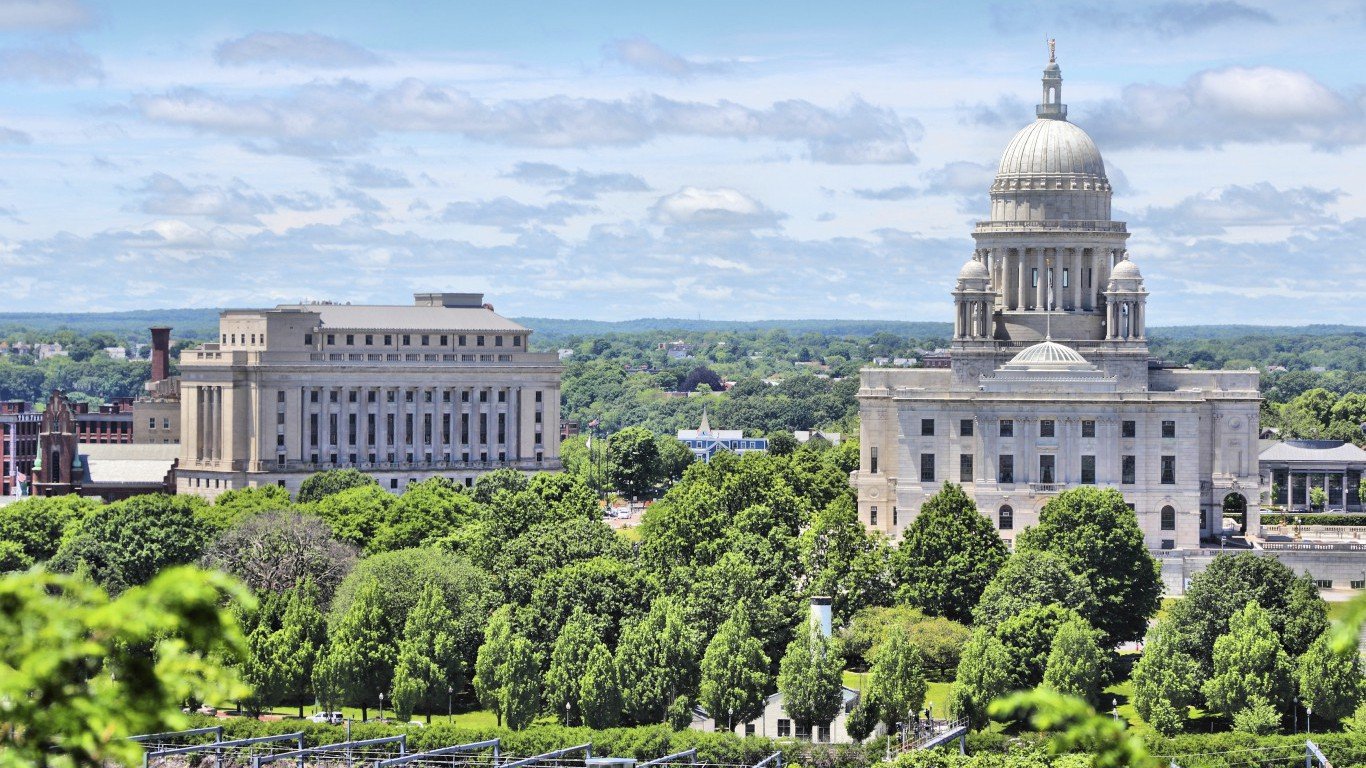
14. Rhode Island
> Pct. of pop. age 65 and up: 16.5% (13th highest)
> 65 and over poverty rate: 9.1% (17th highest)
> 65 and over bachelor’s deg. attainment: 28.8% (18th highest)
> Life expectancy at birth: 79.8 years (15th highest)
Rhode Island has one of the healthiest older populations in the country. Just 31.6% of residents 65 and older have a disability, the seventh smallest share in the country. The life expectancy at birth in the state is 79.8 years, about eight months longer than the national life expectancy and longer than a majority of states. One factor contributing to longevity in Rhode Island may be high college attainment among the state’s elderly population. Adults with college degrees are more likely to retain cognitive ability in old age, and they often live longer, healthier lives. Some 28.8% of residents 65 and over in Rhode Island have a bachelor’s degree, more than the 26.7% national college attainment rate among the elderly.
[in-text-ad-2]
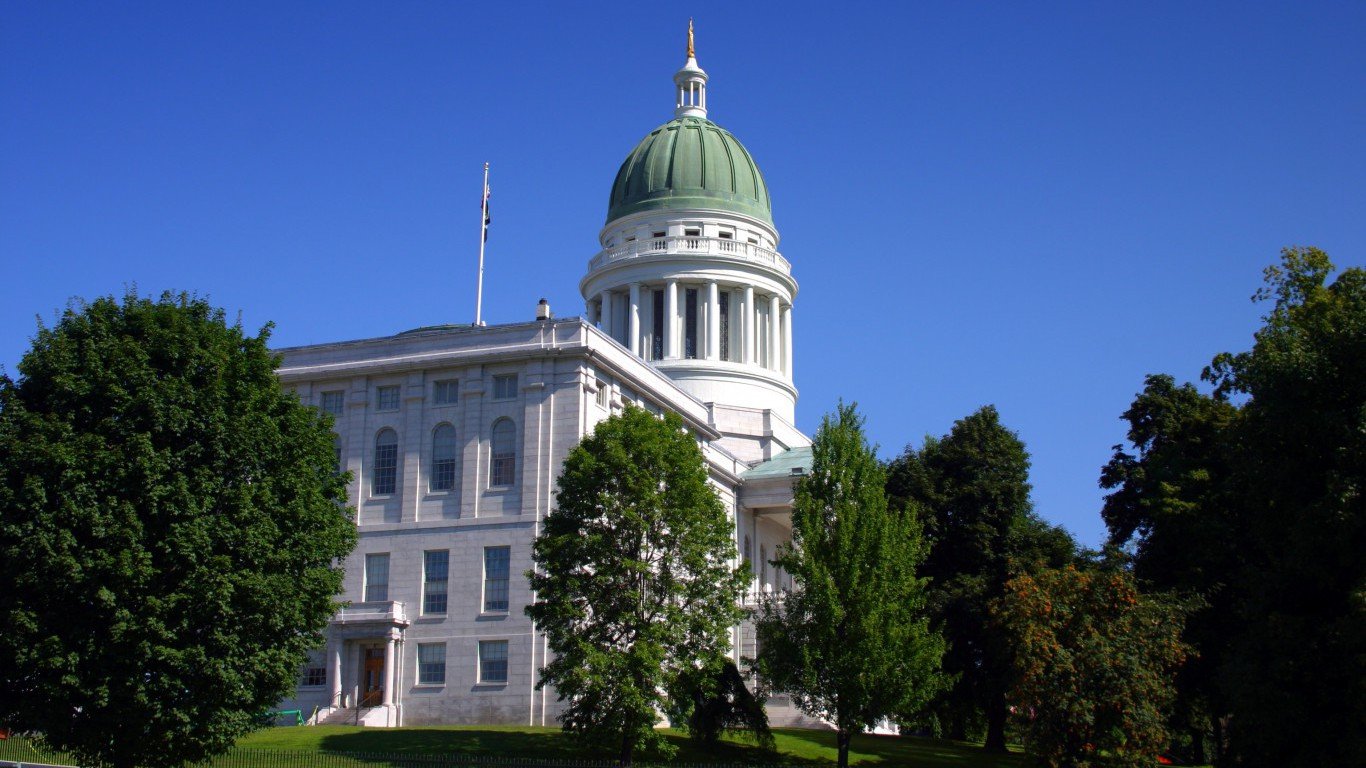
15. Maine
> Pct. of pop. age 65 and up: 19.3% (2nd highest)
> 65 and over poverty rate: 9.1% (17th highest)
> 65 and over bachelor’s deg. attainment: 28.1% (19th highest)
> Life expectancy at birth: 79.3 years (23rd highest)
A college education can help seniors retain cognitive function in old age and can lead to better well-being overall. An estimated 28.1% of adults 65 and older in Maine have a bachelor’s degree, more than the national elderly college attainment rate of 26.7% and more than in a majority of states.
Maine is also one of the safest places in the country, and the senior population may also have better access to health care than a majority of elderly Americans. There were just 124 violent crimes per 100,000 residents in 2016, less than half the national rate of 397 incidents per 100,000 Americans and the lowest violent crime rate of any state. There are also 13 hospitals per 100,000 residents age 65 and over in Maine, more per capita than the United States as a whole.

16. Nebraska
> Pct. of pop. age 65 and up: 15.0% (14th lowest)
> 65 and over poverty rate: 7.8% (15th lowest)
> 65 and over bachelor’s deg. attainment: 24.9% (20th lowest)
> Life expectancy at birth: 79.6 years (17th highest)
Nebraska has one of the healthier populations in the country. The life expectancy at birth in the state is 79.6 years, or about six months longer than the national life expectancy of 79.1 years and more than a majority of states. The median age of the 65 and older population in Nebraska is 73.6 years, the fifth oldest population of any state.
Nebraskan seniors may have better access to health care than the average elderly American. There are 31 hospitals per 100,000 senior citizens, the sixth most of any state. The state also has more social establishments per capita than the average concentration nationwide. There are 14 social associations per 10,000 state residents, more than the national rate of 9 per 100,000 Americans.
[in-text-ad]
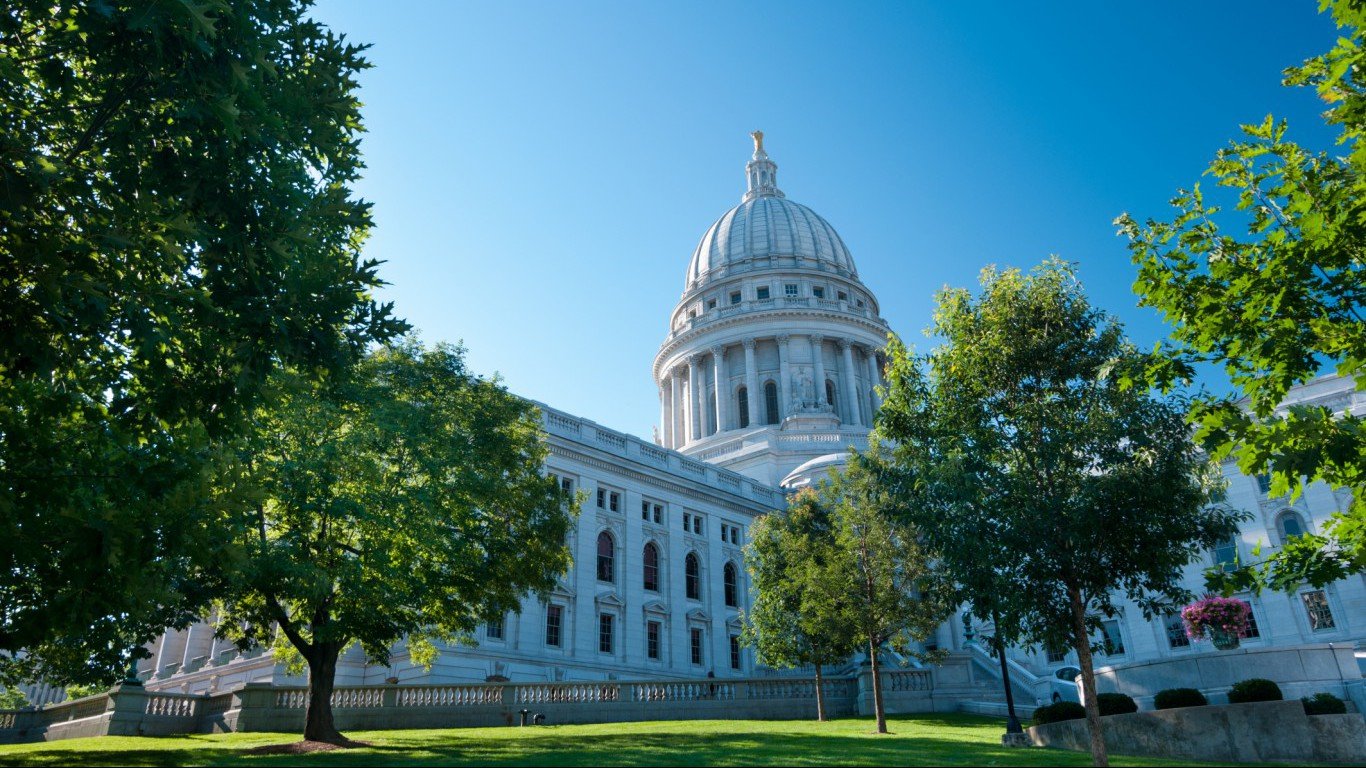
17. Wisconsin
> Pct. of pop. age 65 and up: 16.0% (21st highest)
> 65 and over poverty rate: 7.6% (11th lowest)
> 65 and over bachelor’s deg. attainment: 24.0% (16th lowest)
> Life expectancy at birth: 79.8 years (14th highest)
Wisconsin’s elderly population has better health outcomes than in a majority of states. Just 31.8% of state residents 65 and older have a disability, the ninth smallest share of any state. Life expectancy at birth in Wisconsin is 79.8 years, roughly nine months longer than the U.S. figure. The median age of the 65 and older population is 73.4 years, one of the higher such figures of any state.
In Wisconsin, some 93.2% of senior-led households receive Social Security benefits, nearly the largest share in the country. Despite the income boost, the typical elderly household earns just $38,948 a year, more than $3,000 less than the corresponding national median. One reason for the low incomes may be low college attainment. Just 24.0% of state residents 65 and over have a bachelor’s degree, somewhat less than the national college attainment among the elderly of of 26.7%.
[recirclink id=433818]
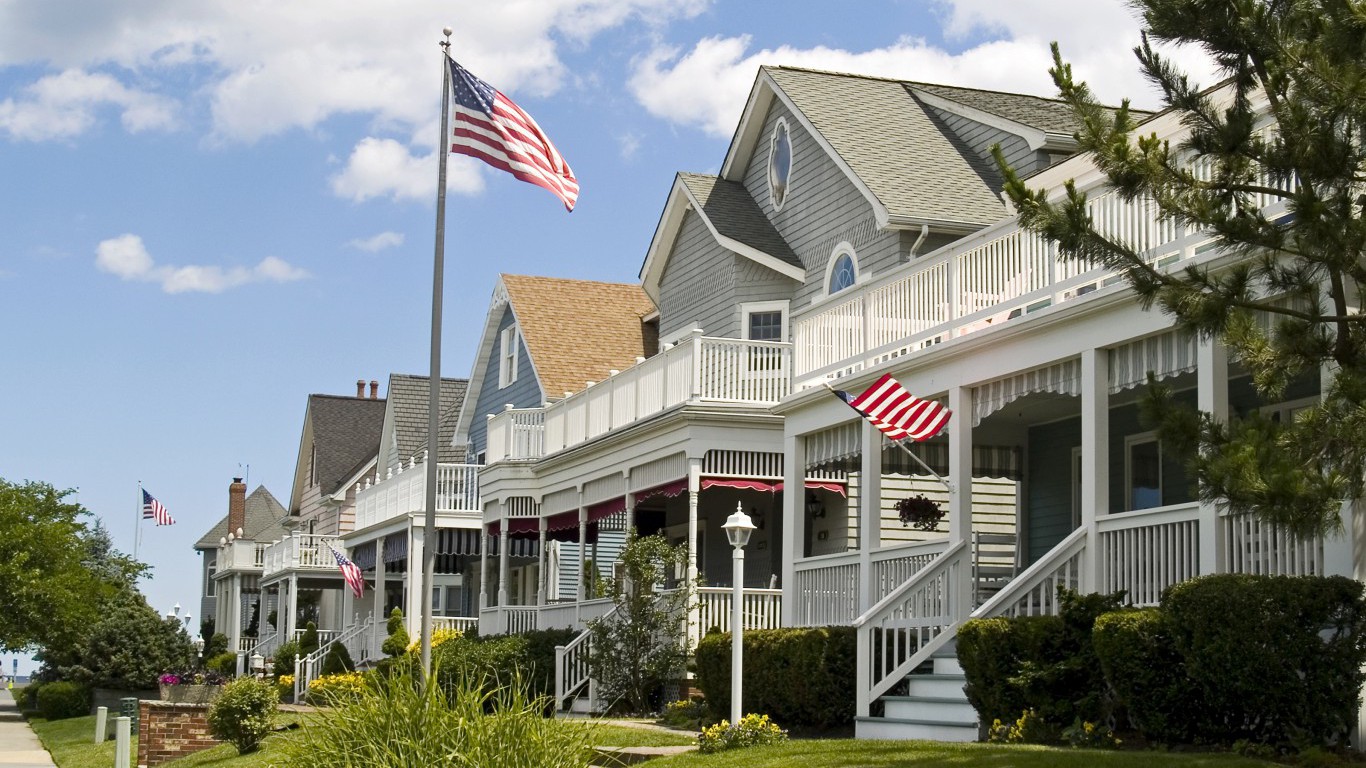
18. New Jersey
> Pct. of pop. age 65 and up: 15.3% (22nd lowest)
> 65 and over poverty rate: 8.3% (22nd lowest)
> 65 and over bachelor’s deg. attainment: 29.6% (14th highest)
> Life expectancy at birth: 80.0 years (10th highest)
New Jersey ranks higher than a majority of states in a number of measures related to the income, education, and health of elderly residents. The median household income among households led by residents 65 and over in the state is $49,656 a year, the sixth highest of any state. The high incomes may partially be the result of high educational attainment. An estimated 29.6% of seniors in the state have a bachelor’s degree, far more than the 26.7% national share. Wealthy, educated adults often lead healthier, longer lives, and in New Jersey the life expectancy is 80 years — the 10th longest of any state.
One factor that also contributes to well-being in old age is mobility. Walkable areas and access to public transportation can provide residents with a greater degree of freedom, which can help seniors continue to lead active, healthy lives. Indicative of the state’s walkability and effective transit infrastructure, some 14.7% of commuters in New Jersey walk or take public transportation to work, the largest share of any state other than New York and Massachusetts.

19. South Dakota
> Pct. of pop. age 65 and up: 15.9% (23rd highest)
> 65 and over poverty rate: 10.9% (6th highest)
> 65 and over bachelor’s deg. attainment: 24.7% (18th lowest)
> Life expectancy at birth: 79.6 years (19th highest)
In South Dakota, the typical senior-led household earns just $39,528 a year, over $2,500 less than the corresponding national median. Some 10.9% of residents 65 and older live in poverty, the sixth largest share in the country. One factor contributing to the low incomes may be the low educational attainment among the state’s senior citizens. Just 24.7% of adults 65 and older have a bachelor’s degree, less than the 26.7% national elderly college attainment rate.
While seniors are less likely to be wealthy and college-educated in South Dakota, they may have better access to health care and social opportunities than the average elderly American, which are important for maintaining a healthy lifestyle in old age. There are 43 hospitals and 168 social associations per 100,000 senior citizens in South Dakota, each the highest such figure of any state.
[in-text-ad-2]
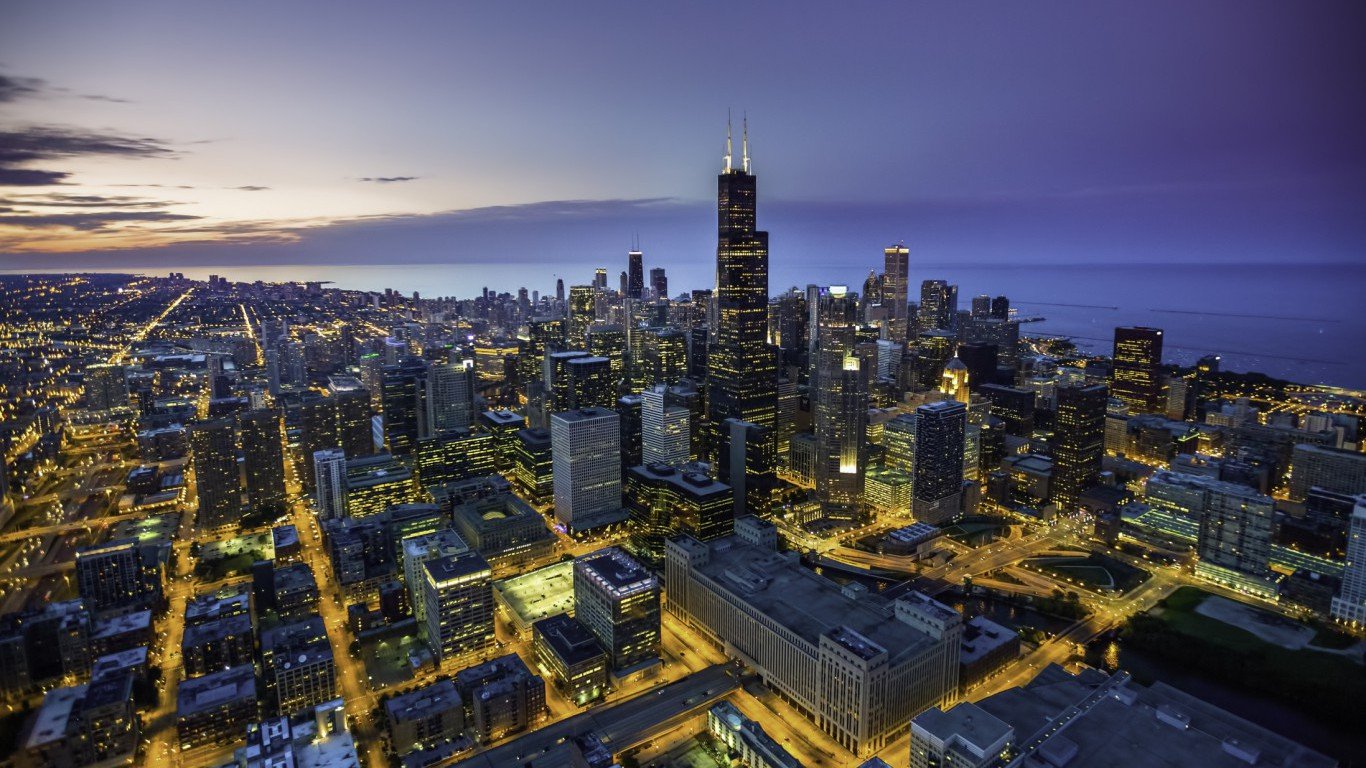
20. Illinois
> Pct. of pop. age 65 and up: 14.6% (11th lowest)
> 65 and over poverty rate: 9.2% (16th highest)
> 65 and over bachelor’s deg. attainment: 25.4% (22nd lowest)
> Life expectancy at birth: 79.0 years (25th lowest)
The median household income among households led by residents 65 and over in Illinois is $41,253 a year, slightly below the corresponding national median of $42,113. Income is closely correlated to educational attainment, and the college attainment rate among senior citizens in the state of 25.4% is also slightly below the 26.7% national figure.
While the Illinois senior population trails the United States as a whole in income and education, the state’s urban environment may be more senior-friendly than that of most of the country. Walkable areas with access to public transportation can grant many senior citizens a greater degree of independence, and help them live active, healthy lives in old age. Indicative of the state’s walkability and effective transit infrastructure, an estimated 12.4% of Illinois workers commute by walking or taking public transit, the fourth largest share in the country.
21. Wyoming
> Pct. of pop. age 65 and up: 15.0% (13th lowest)
> 65 and over poverty rate: 8.5% (24th lowest)
> 65 and over bachelor’s deg. attainment: 26.6% (25th highest)
> Life expectancy at birth: 78.6 years (20th lowest)
Just 43.6% of senior-led households in Wyoming receive retirement income other than Social Security, one of the smallest shares of any state. Similarly, the median household income among households led by residents 65 and over is just $39,806 a year, more than $2,000 less than the $42,113 national median.
Despite the low incomes, Wyoming seniors likely have better access to health care than most elderly Americans, and have better health outcomes. There are 32 hospitals per 100,000 residents 65 and over in Wyoming, the fourth most of any state. Additionally, just 3,826 in every 100,000 senior citizens dies annually, one of the lowest mortality rates among senior citizens nationwide.
[in-text-ad]

22. Iowa
> Pct. of pop. age 65 and up: 16.4% (15th highest)
> 65 and over poverty rate: 6.9% (6th lowest)
> 65 and over bachelor’s deg. attainment: 21.7% (11th lowest)
> Life expectancy at birth: 79.7 years (16th highest)
Iowa’s senior population has better access to health care institutions, and slightly better health outcomes than most elderly Americans. There are 23 hospitals per 100,000 residents 65 and older, the eighth most of any state. Just 31.9% of senior citizens in Iowa have a disability, compared to 35.2% of elderly residents nationwide. Similarly, the life expectancy of Iowa residents is 79.7 years, about eight months longer than the national life expectancy of 79.1 years.
Still, Iowa lags behind the nation as a whole in income and education. Just 21.7% of adults age 65 and above have a bachelor’s degree, and the typical senior-led household earns $39,433 a year. By comparison, the national college attainment rate for senior citizens is 26.7%, and the national median income for senior households is $42,113.
[recirclink id=433549]
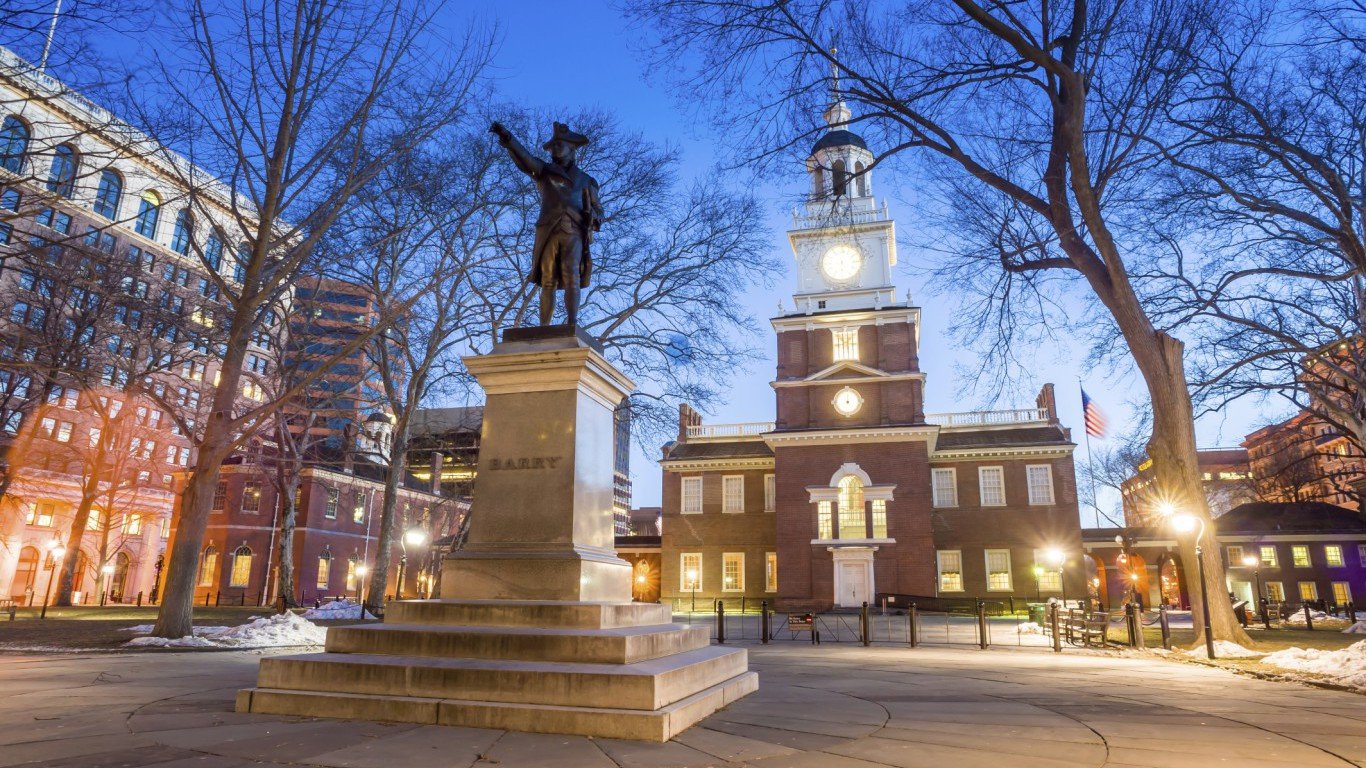
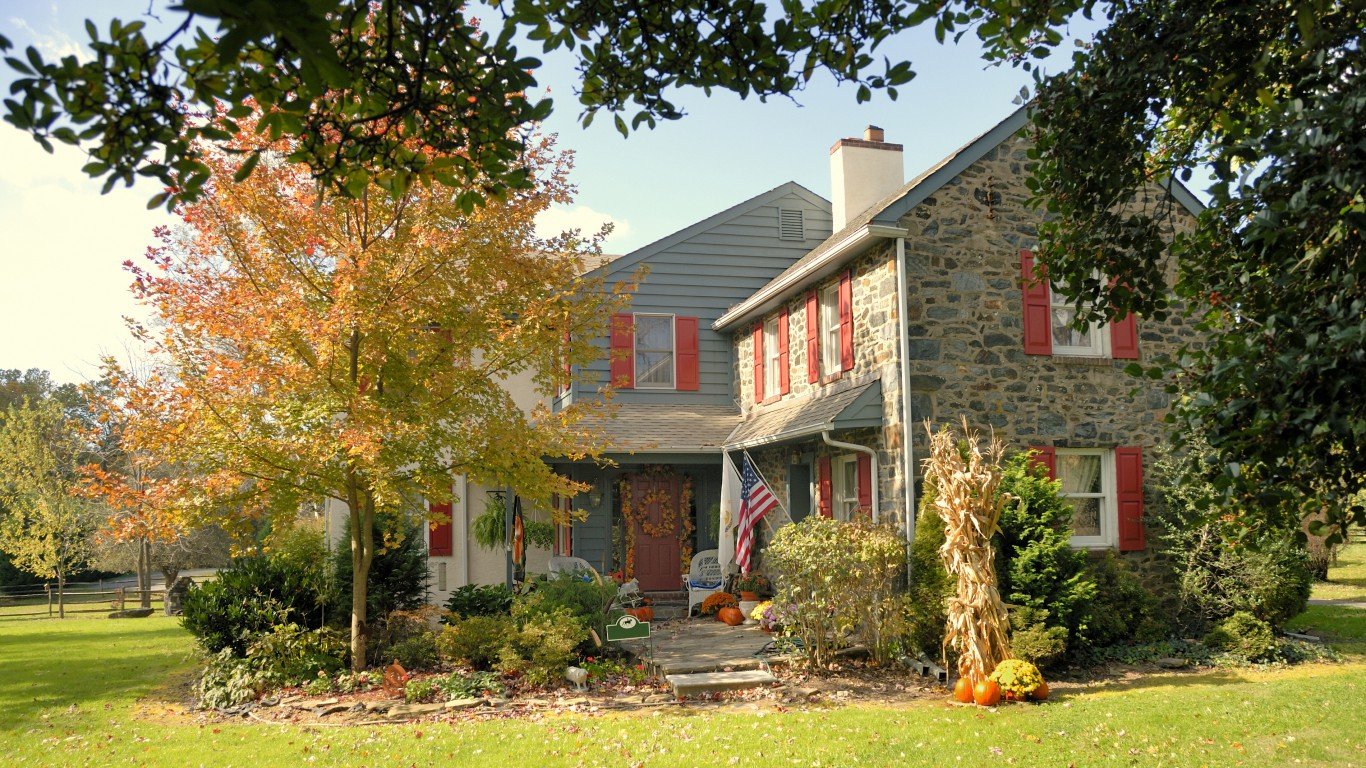
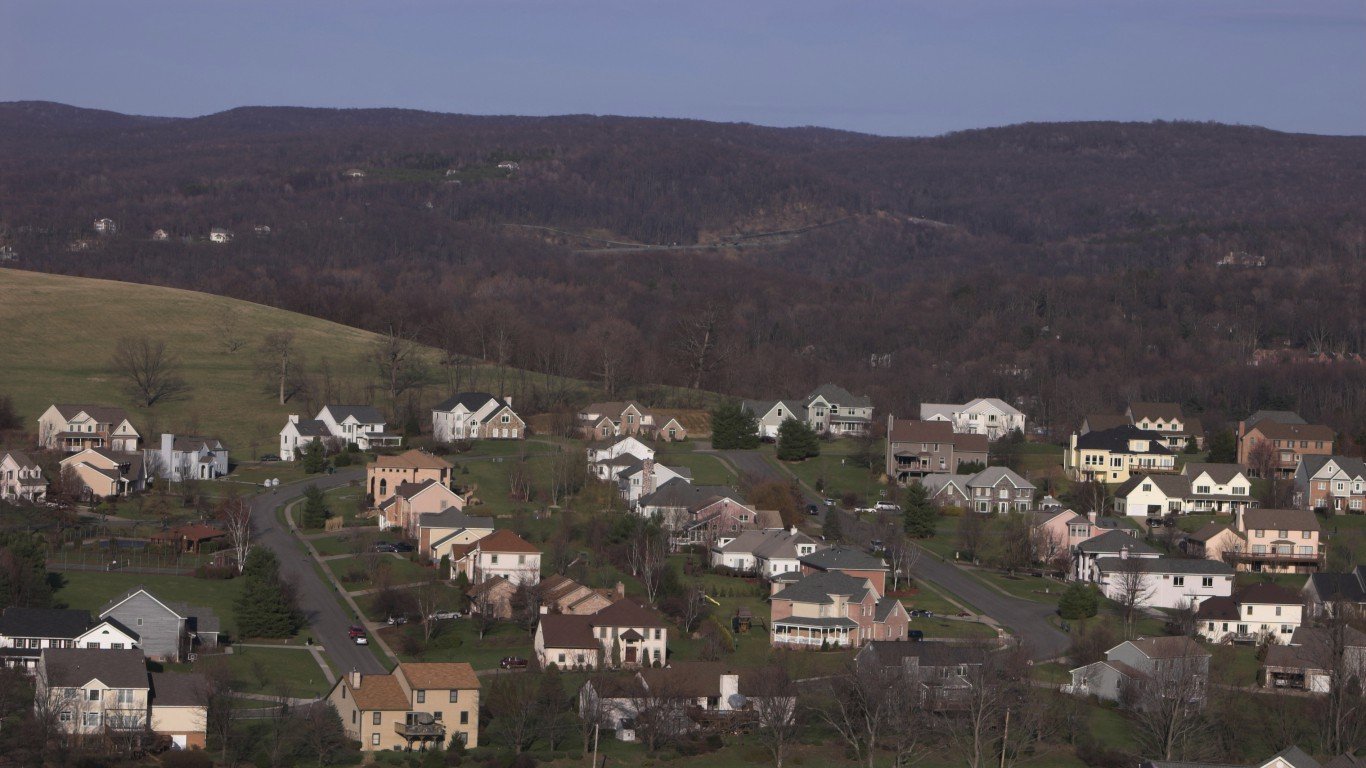
23. Pennsylvania
> Pct. of pop. age 65 and up: 17.4% (7th highest)
> 65 and over poverty rate: 7.8% (15th lowest)
> 65 and over bachelor’s deg. attainment: 22.8% (14th lowest)
> Life expectancy at birth: 78.8 years (23rd lowest)
Pennsylvania has one of the older populations of any state. Some 17.4% of the population is 65 and over, the seventh largest share. Of the 1.4 million households in the state led by senior citizens, 53% receive Social Security benefits, one of the larger shares nationwide. Despite the extra income, the typical senior household earns just $39,780 a year, more than $2,000 less than the national elderly median income.
While Pennsylvania’s elderly population lags behind the nation in wealth, the state has better access to transportation alternatives than most of the country. Walkable areas with public transit can help senior citizens continue to lead active, healthy lifestyles in old age and improve overall well-being. Perhaps indicative of the state’s walkability and effective transit infrastructure, some 9.2% of workers in Pennsylvania commute by walking or taking public transportation, the eighth largest share of any state.
24. Delaware
> Pct. of pop. age 65 and up: 17.5% (6th highest)
> 65 and over poverty rate: 6.9% (6th lowest)
> 65 and over bachelor’s deg. attainment: 28.0% (20th highest)
> Life expectancy at birth: 78.7 years (21st lowest)
Delaware ranks near the middle of states in a number of measures assessing income, education, and health of elderly residents. An estimated 28.0% of seniors in the state have a bachelor’s degree, more than the national elderly college attainment rate of 26.7%. Some 58.1% of senior-led households receive retirement income other than Social Security — the largest share of any state — and the median income among such households is $47,195 a year, more than the $42,113 national median.
While Delaware seniors are slightly more likely to be college-educated and wealthier than the average elderly American, they may have worse access to health care. There are just 4 hospitals per 100,000 state residents aged 65 and over, the least of any state nationwide.
[in-text-ad-2]

25. New York
> Pct. of pop. age 65 and up: 15.3% (23rd lowest)
> 65 and over poverty rate: 11.4% (4th highest)
> 65 and over bachelor’s deg. attainment: 28.0% (20th highest)
> Life expectancy at birth: 80.4 years (6th highest)
Access to public transportation can help senior citizens lead active, healthy lives, and New York has some of the largest public transportation infrastructure in the world. Some 34.6% of workers commute by walking or taking public transit, more than four times the 7.8% national average and the largest share of any state. New York City’s Community Arranged Resident Transportation (C.A.R.T) program provides free transportation for the elderly in Manhattan, and a number of other towns throughout the state provide similar services.
New York has one of the healthier elderly populations. Just 32.9% of residents 65 and over have a disability, less than the 35.2% national figure. The life expectancy in the state is 80.4 years, the sixth longest of any state. Despite the positive health outcomes, some 11.4% of seniors in the state live in poverty — the fourth largest share in the country.
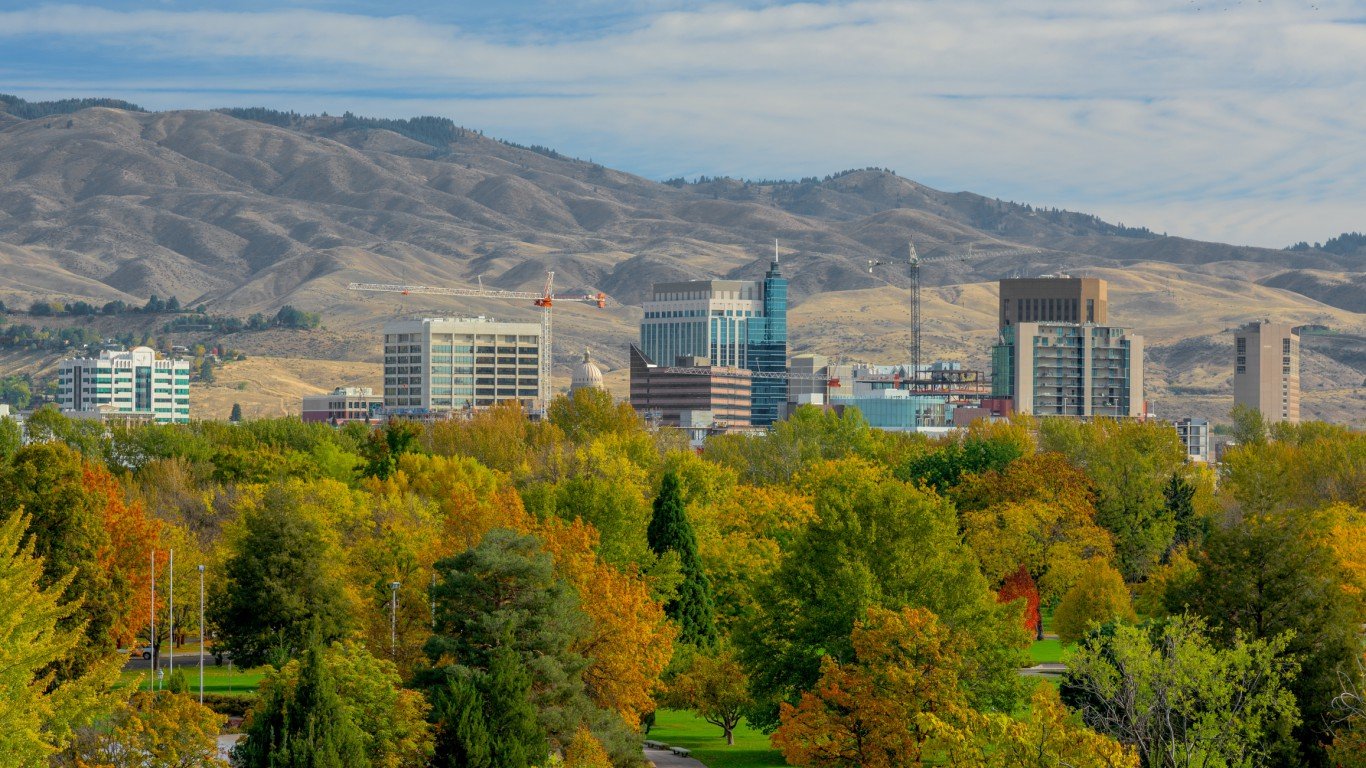
26. Idaho
> Pct. of pop. age 65 and up: 15.2% (21st lowest)
> 65 and over poverty rate: 10.0% (12th highest)
> 65 and over bachelor’s deg. attainment: 26.0% (25th lowest)
> Life expectancy at birth: 79.5 years (20th highest)
By a number of measures assessing the income, education, and health of elderly Americans, Idaho ranks in the middle of the country. A college education can help preserve cognitive function in old age, and 26.0% of state residents 65 and over have a bachelor’s degree — slightly less than the 26.7% national rate. The typical senior-led household in Idaho earns $39,338 a year, less than the $42,113 national median.
Idaho is also one of the safest states, and senior have better access to health care institutions than in most of the country. There were just 230 violent crimes per 100,000 state residents in 2016, the sixth lowest violent crime rate nationwide. There are 16 hospitals per 100,000 senior citizens in the state, more than the national average concentration of 10 hospitals per 100,000 elderly Americans.
[in-text-ad]

27. Michigan
> Pct. of pop. age 65 and up: 16.2% (18th highest)
> 65 and over poverty rate: 8.1% (19th lowest)
> 65 and over bachelor’s deg. attainment: 23.9% (15th lowest)
> Life expectancy at birth: 78.3 years (16th lowest)
Some 57.0% of households led by residents aged 65 and over in Michigan receive retirement income other than Social Security, the second largest share of any state. Despite the income supplement, the typical senior-led household earns $40,765 a year, slightly less than the $42,113 national median. One factor contributing to the low incomes is likely the low educational attainment among seniors in the state. Just 23.9% of residents 65 and over have a bachelor’s degree, far less than the 26.7% national college attainment rate for the age group.
[recirclink id=432660]
28. Ohio
> Pct. of pop. age 65 and up: 16.2% (17th highest)
> 65 and over poverty rate: 8.1% (19th lowest)
> 65 and over bachelor’s deg. attainment: 21.5% (10th lowest)
> Life expectancy at birth: 77.9 years (14th lowest)
A college education can help senior citizens retain cognitive ability in old age and lead to increased well-being overall. In Ohio, however, just 21.5% of residents 65 and over have a bachelor’s degree, the 10th smallest share of any state. Educational attainment is also highly correlated with income, and the median income among senior-led households in Ohio is just $39,423 a year, less than the $42,113 national figure.
Ohio also has one of the least healthy populations of any state. The average resident born in Ohio is expected to live for 77.9 years, less than the national life expectancy of 79.1 years. Also, 4,610 in every 100,000 senior citizens in the state die every year, the seventh highest mortality rate among elderly people in the country.
29. North Dakota
> Pct. of pop. age 65 and up: 14.5% (8th lowest)
> 65 and over poverty rate: 7.9% (16th lowest)
> 65 and over bachelor’s deg. attainment: 21.4% (9th lowest)
> Life expectancy at birth: 80.0 years (12th highest)
North Dakota has better access to health care facilities and better health outcomes than most of the country. There are 40 hospitals per 100,000 state residents age 65 and over — the second highest concentration of any state. The average resident born is North Dakota is expected to live for 80 years, nearly a year longer than the U.S. life expectancy of 79.1 years. The median age of the 65 and older population in the state is 73.9 years, the oldest of any state.
Despite the long life expectancy in North Dakota, the state’s seniors are less likely to be wealthy and college-educated than the average elderly American. Just 21.4% of adults 65 and older in the state have a bachelor’s degree, the ninth smallest share of any state. The median household income of seniors is $41,084 a year, less than the comparable national figure of $42,113.
[in-text-ad-2]
30. Missouri
> Pct. of pop. age 65 and up: 16.0% (22nd highest)
> 65 and over poverty rate: 8.2% (21st lowest)
> 65 and over bachelor’s deg. attainment: 22.7% (13th lowest)
> Life expectancy at birth: 77.7 years (12th lowest)
Life expectancy is low in Missouri, and the state has one of the higher senior mortality rates. The life expectancy at birth in the state is 77.7 years, compared to the national life expectancy of 79.1 years. For every 100,000 residents age 65 and up, 4,449 die annually, more than in a majority of states.
While a college education can help senior citizens retain cognitive ability in old age, just 22.7% of Missouri seniors have a bachelor’s degree — less than the 26.7% national rate. College attainment is also highly correlated with income. The typical senior-led household in the state earns just $39,143 a year, compared to the $42,113 national figure.

31. Georgia
> Pct. of pop. age 65 and up: 13.2% (4th lowest)
> 65 and over poverty rate: 10.1% (11th highest)
> 65 and over bachelor’s deg. attainment: 24.9% (20th lowest)
> Life expectancy at birth: 77.4 years (10th lowest)
Just 24.9% of Georgia residents 65 and over have a bachelor’s degree, less than the comparable national share of 26.7%. Senior citizens with college degrees often have higher incomes. The median income among senior-led households in Georgia is just $40,386 a year, nearly $1,700 less than the national median household income among seniors.
Wealth and educational attainment are highly correlated with health and longevity. In Georgia, 36.5% of the senior citizen population has a disability, one of the larger shares of any state. The life expectancy at birth in the state is just 77.4 years, far less than the national life expectancy of 79.1 years and the 10th shortest in the country.
[in-text-ad]
32. California
> Pct. of pop. age 65 and up: 13.6% (6th lowest)
> 65 and over poverty rate: 10.3% (10th highest)
> 65 and over bachelor’s deg. attainment: 30.5% (11th highest)
> Life expectancy at birth: 80.8 years (3rd highest)
In California, some 30.5% of residents 65 and over have a bachelor’s degree, one of the largest shares of any state. A college education can lead to higher incomes later in life, and the typical senior-led household in the state earns $49,531 a year, the seventh most of any state.
While incomes are high in California, goods and services are 13% more expensive than on average nationwide — a higher cost of living than in any state other than New York and Hawaii. Some 10.3% of seniors in the state live in poverty, the 10th largest share nationwide. California is also one of the more dangerous states, which can be a negative factor for residents of all ages. There were 445 violent crimes per 100,000 residents in 2016, more than the national violent crime rate of 397 incidents per 100,000 Americans.
[recirclink id=433303]
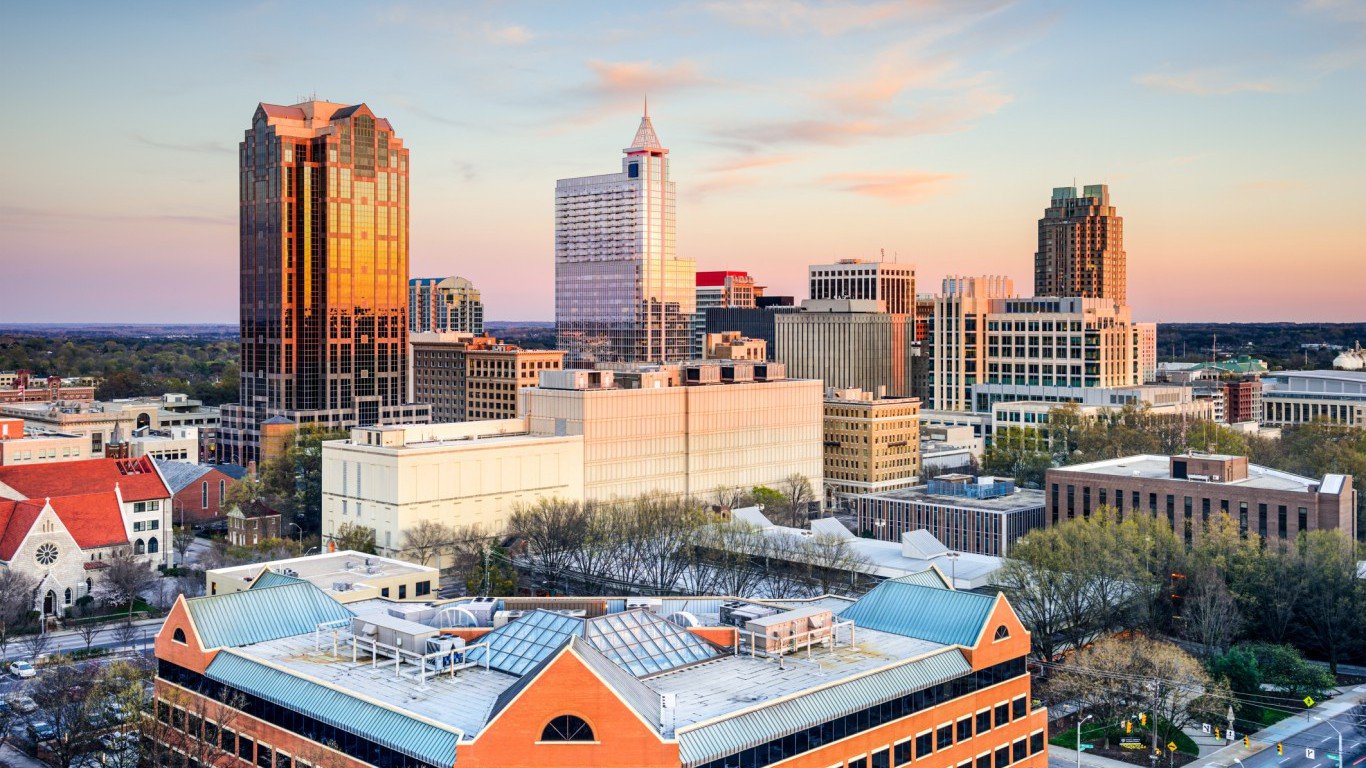
33. North Carolina
> Pct. of pop. age 65 and up: 15.5% (24th lowest)
> 65 and over poverty rate: 9.4% (15th highest)
> 65 and over bachelor’s deg. attainment: 24.7% (18th lowest)
> Life expectancy at birth: 77.9 years (13th lowest)
By a number of measures assessing education, income, and health, North Carolina ranks as one of the worst states to grow old in. Just 24.7% of residents 65 and over have a bachelor’s degree, far less than the 26.7% of seniors nationwide. College attainment is closely tied to income throughout life, and the median household income among senior-led households in the state is just $38,794 a year. By comparison, the median household income among senior households nationwide is $42,113.
While public transportation can grant seniors a greater degree of independence and contribute to health and longevity, just 2.7% of North Carolina workers commute by walking or by public transit — the seventh smallest share of any state. The state’s average life expectancy at birth is just 77.9 years, compared to the national life expectancy of 79.1 years.

34. Arizona
> Pct. of pop. age 65 and up: 16.9% (10th highest)
> 65 and over poverty rate: 9.0% (19th highest)
> 65 and over bachelor’s deg. attainment: 29.0% (16th highest)
> Life expectancy at birth: 79.6 years (17th highest)
Some 29.0% of Arizona residents have a bachelor’s degree, more than the 26.7% national share. College attainment can lead to improved cognitive ability in later life, as well as increased income. The typical state household led by a resident 65 and over in the state earns $43,647 a year, over $1,500 more than the $42,113 national figure.
While Arizona seniors are more likely to be wealthy and college educated than most elderly Americans, they may have less access to health care. There are just 7 hospitals in the state per 100,000 senior citizens, less than the national average concentration of 10 institutions per 100,000 elderly Americans. Additionally, 26.7% of adults in the state report not having a personal doctor, the 11th largest share of any state.
[in-text-ad-2]
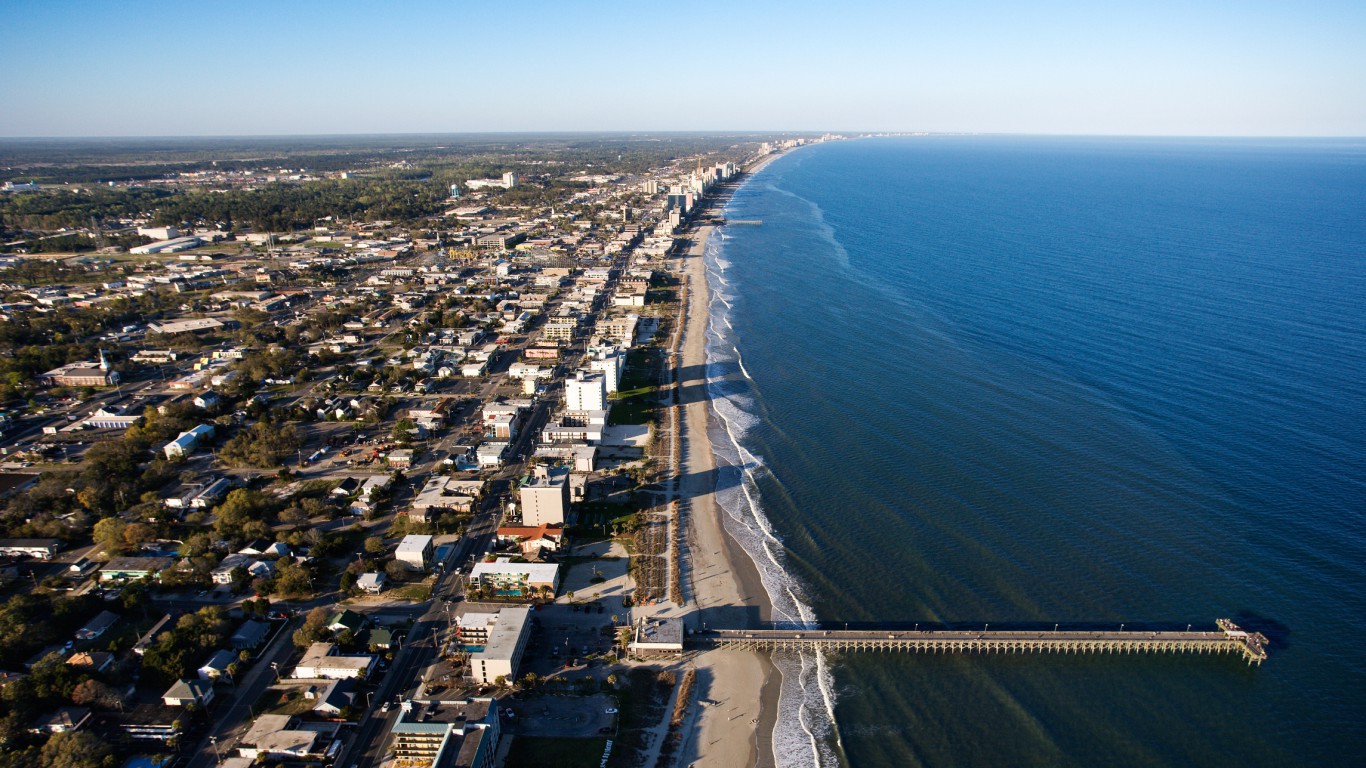
35. South Carolina
> Pct. of pop. age 65 and up: 16.7% (12th highest)
> 65 and over poverty rate: 8.6% (25th highest)
> 65 and over bachelor’s deg. attainment: 25.4% (22nd lowest)
> Life expectancy at birth: 76.9 years (9th lowest)
In South Carolina, some 25.4% of residents age 65 and over have a bachelor’s degree, less than the national senior college attainment rate of 26.7%. A college degree can increase the chance of obtaining a high-paying job and can help secure a high income in later life. The typical state household led by a senior earns $40,099 a year, over $2,000 less than the national median.
Various environmental factors in South Carolina may make life harder for the elderly population. While public transportation can afford seniors a greater degree of mobility and independence, just 2.7% of South Carolina workers commute on foot or on public transit, the seventh smallest share of any state. South Carolina is also relatively dangerous, a negative factor for residents of all ages. There were 502 violent crimes per 100,000 residents in 2016, the 10th most of any state.
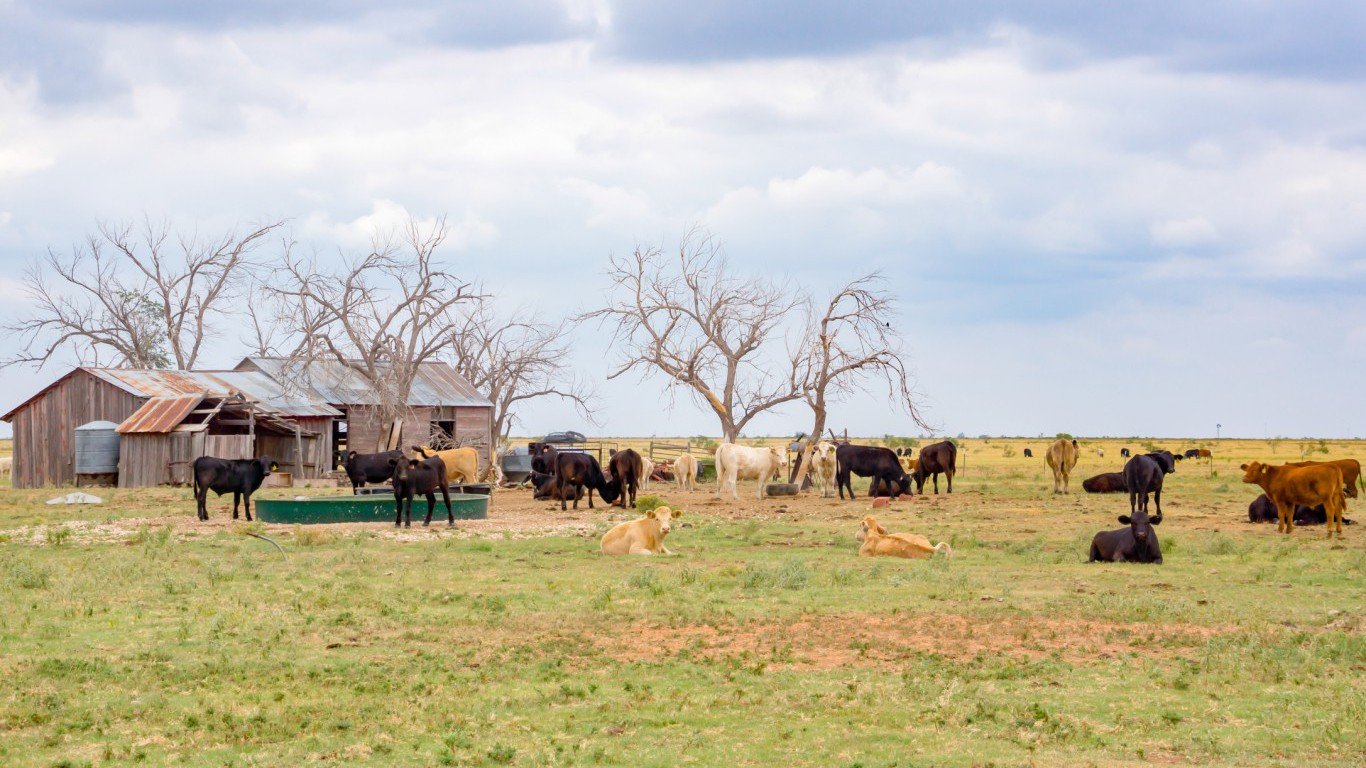
36. Texas
> Pct. of pop. age 65 and up: 12.0% (3rd lowest)
> 65 and over poverty rate: 10.5% (7th highest)
> 65 and over bachelor’s deg. attainment: 25.8% (24th lowest)
> Life expectancy at birth: 78.5 years (19th lowest)
In Texas, just 43.3% of households led by residents 65 and over receive retirement income other than Social Security, the sixth smallest share of any state. While the typical senior-led state household earns about as much as the typical elderly household nationwide, the lack of supplemental income for some seniors in the state may pose significant financial difficulty. Some 10.5% of Texas residents 65 and over live in poverty, the seventh largest share of any state.
Texas also has worse access to health care and worse health outcomes than most of the country. Some 31.1% of state adults do not have a personal doctor, the largest share of any state other than Alaska. Also, an estimated 38.7% of seniors in Texas have a disability, and the life expectancy in the state is 78.5 years — each worse than the corresponding national figures.
[in-text-ad]
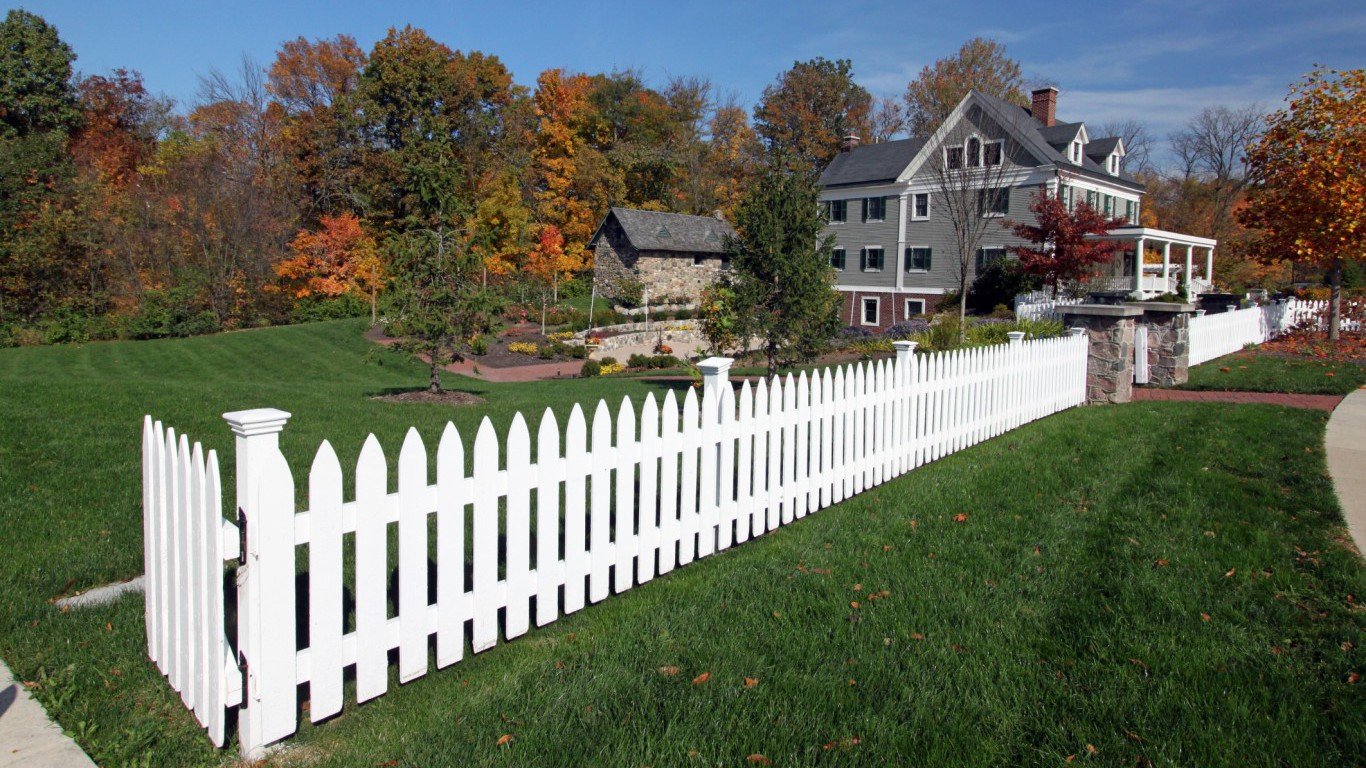
37. Indiana
> Pct. of pop. age 65 and up: 15.0% (15th lowest)
> 65 and over poverty rate: 7.7% (12th lowest)
> 65 and over bachelor’s deg. attainment: 19.8% (4th lowest)
> Life expectancy at birth: 77.7 years (11th lowest)
Just 19.8% of adults 65 and over in Indiana have a bachelor’s degree, far less than the 26.7% of seniors nationwide and the fourth smallest share of any state. College attainment is heavily correlated with income, particularly later in life, and the typical senior-led state household earns $39,568 a year, less than the $42,113 national figure. While incomes are low, 53.2% of senior households receive some form of retirement income other than Social Security — the 10th largest share of any state — which may help keep some elderly residents out of serious financial hardship. Just 7.7% of seniors in Indiana live in poverty, less than the 9.2% national share and one of the smaller shares nationwide.
[recirclink id=433280]
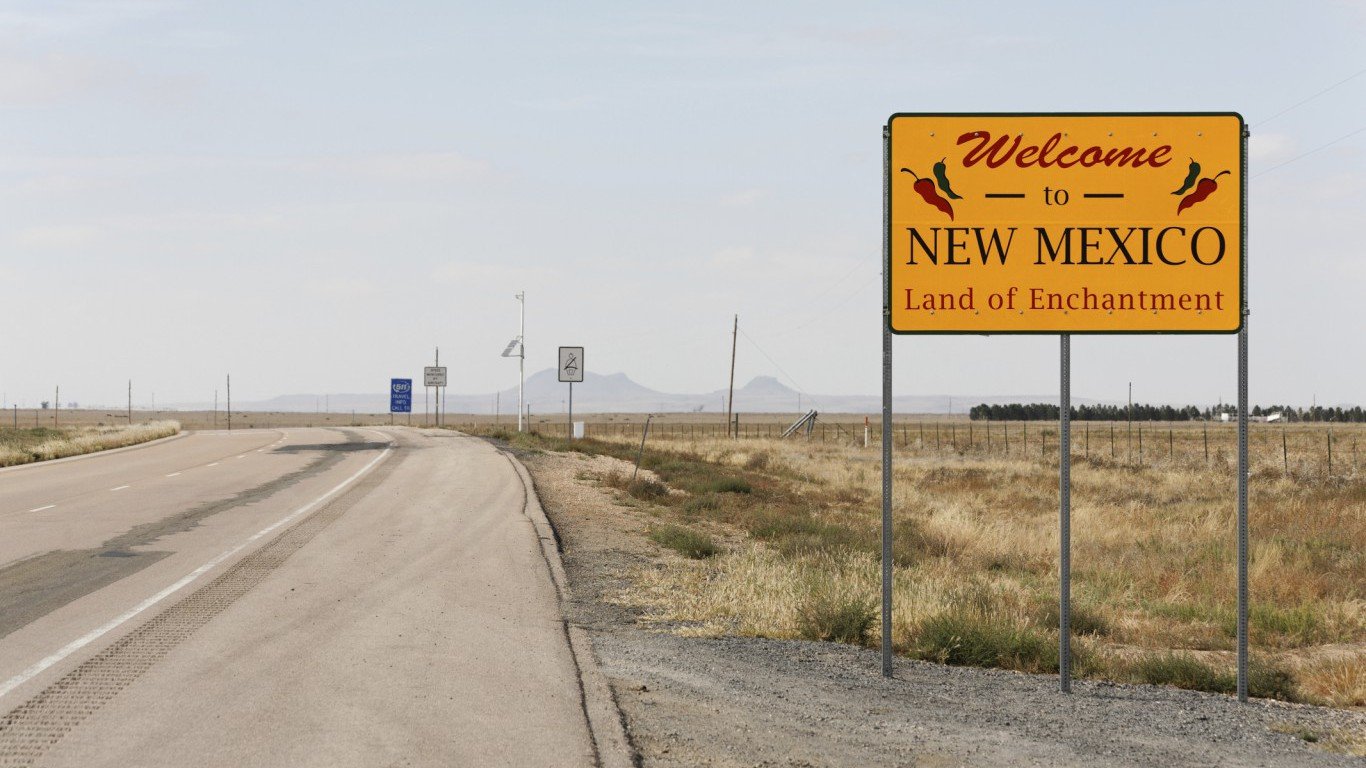
38. New Mexico
> Pct. of pop. age 65 and up: 16.4% (14th highest)
> 65 and over poverty rate: 11.5% (3rd highest)
> 65 and over bachelor’s deg. attainment: 30.2% (12th highest)
> Life expectancy at birth: 78.4 years (17th lowest)
New Mexico is one of just four states in which the senior college attainment rate exceeds the college attainment rate of the state’s general population. Some 30.2% of residents 65 and over in New Mexico have a bachelor’s degree, one of the largest shares of any state and more than the 27.2% college attainment rate for all of New Mexico adults. While a college degree can lead to a high-paying job and help secure a high income throughout life, the typical senior-led household in the state earns $39,454 a year, less than the $42,113 median among residents 65 and over nationwide. Just 48.3% of senior households in the state receive retirement income other than Social Security, which may put some elderly residents at risk of serious financial hardship. Some 11.5% of seniors in the state live in poverty, the third largest share of any state.

39. Hawaii
> Pct. of pop. age 65 and up: 17.0% (8th highest)
> 65 and over poverty rate: 8.9% (20th highest)
> 65 and over bachelor’s deg. attainment: 29.5% (15th highest)
> Life expectancy at birth: 81.2 years (the highest)
A popular destination for retirees, Hawaii has one of the larger elderly populations of any state relative to its size. Some 17.0% of the state population is over the age of 65, the eighth largest share in the country. While Hawaii is one of the wealthier states in the country — the typical senior-led household earns $63,229 a year, the most of any state — it is also the most expensive. Hawaii is located approximately 2,500 miles from the U.S. mainland, which can increase the cost of importing goods to the islands. Goods and services in the state are 19% more expensive than they are on average nationwide, the highest cost of living of any state.
[in-text-ad-2]

40. Nevada
> Pct. of pop. age 65 and up: 15.0% (17th lowest)
> 65 and over poverty rate: 8.7% (23rd highest)
> 65 and over bachelor’s deg. attainment: 25.5% (23rd lowest)
> Life expectancy at birth: 78.1 years (15th lowest)
While Nevada is one of the few states in which educational attainment among seniors exceeds that of the state’s general population, it is still low compared to the rest of the country. Some 25.5% of state residents age 65 and over have a bachelor’s degree, less than the 26.7% of seniors nationwide. While Nevada seniors are less likely to have a college education than the average elderly American, they are more likely to earn higher incomes. The typical state household headed by a resident 65 and over earns $43,947 a year, more than the $42,113 national figure.
Violent crime can have a negative impact on well-being for all residents, regardless of age, and in Nevada crime is high. There were 678 violent crimes per 100,000 state residents in 2016, the third most of any state.
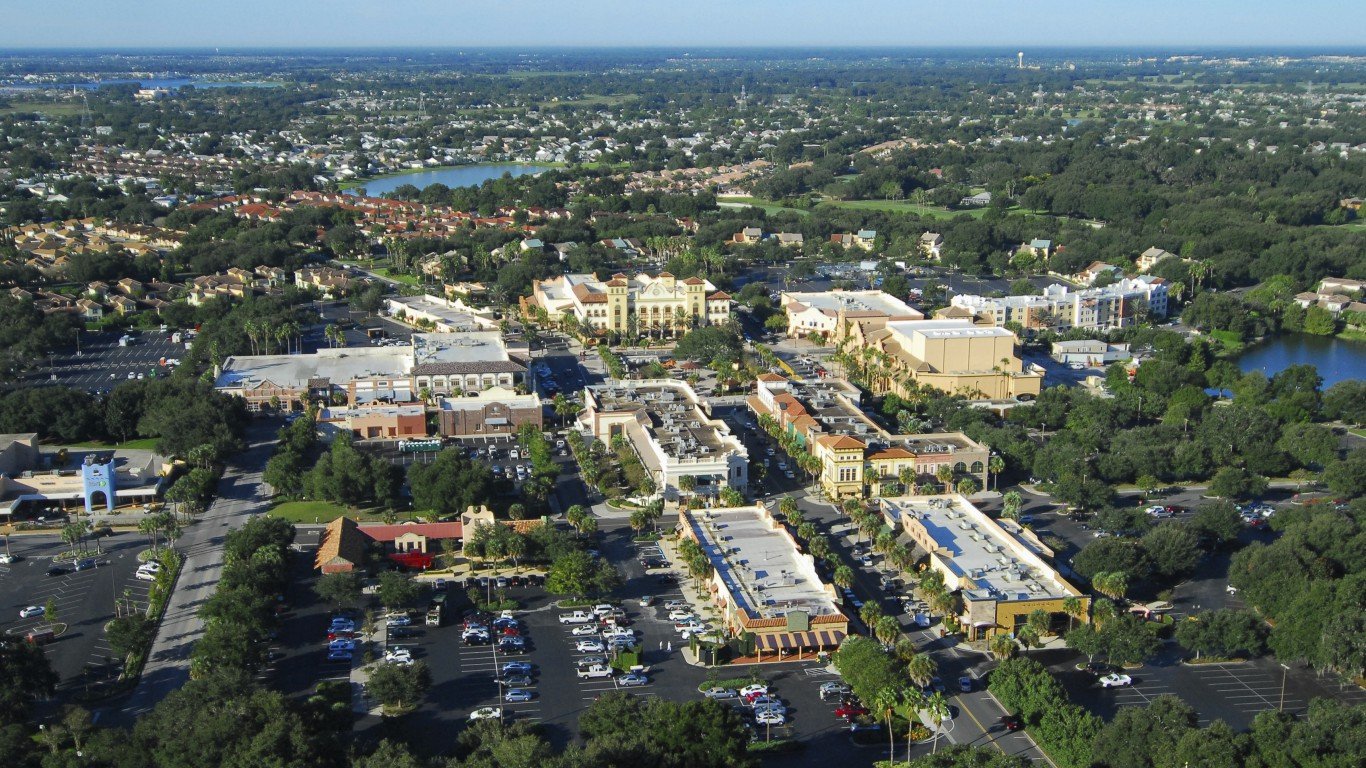
41. Florida
> Pct. of pop. age 65 and up: 19.8% (the highest)
> 65 and over poverty rate: 10.4% (9th highest)
> 65 and over bachelor’s deg. attainment: 27.6% (22nd highest)
> Life expectancy at birth: 79.5 years (21st highest)
One of the most popular destinations for retirees, Florida has the largest senior population in the country relative to its size. Nearly 1 in 5 state residents are 65 and older, the largest share of any state. While Florida is home to some of the most exclusive retirement communities in the world, many seniors in the state struggle financially. Just 45.2% of of senior-led households receive retirement income other than Social Security, one of the smaller shares of any state. The lack of supplemental income can put many seniors at a financial disadvantage, and some 10.4% of residents 65 and over in Florida live in poverty — the ninth largest share of any state.
Florida seniors may also have relatively poor access to health care. There are just 5 hospitals per 100,000 senior citizens in Florida, the second least of any state. Also, an estimated 28% of Florida adults do not have a personal doctor, the sixth largest share in the country.
[in-text-ad]
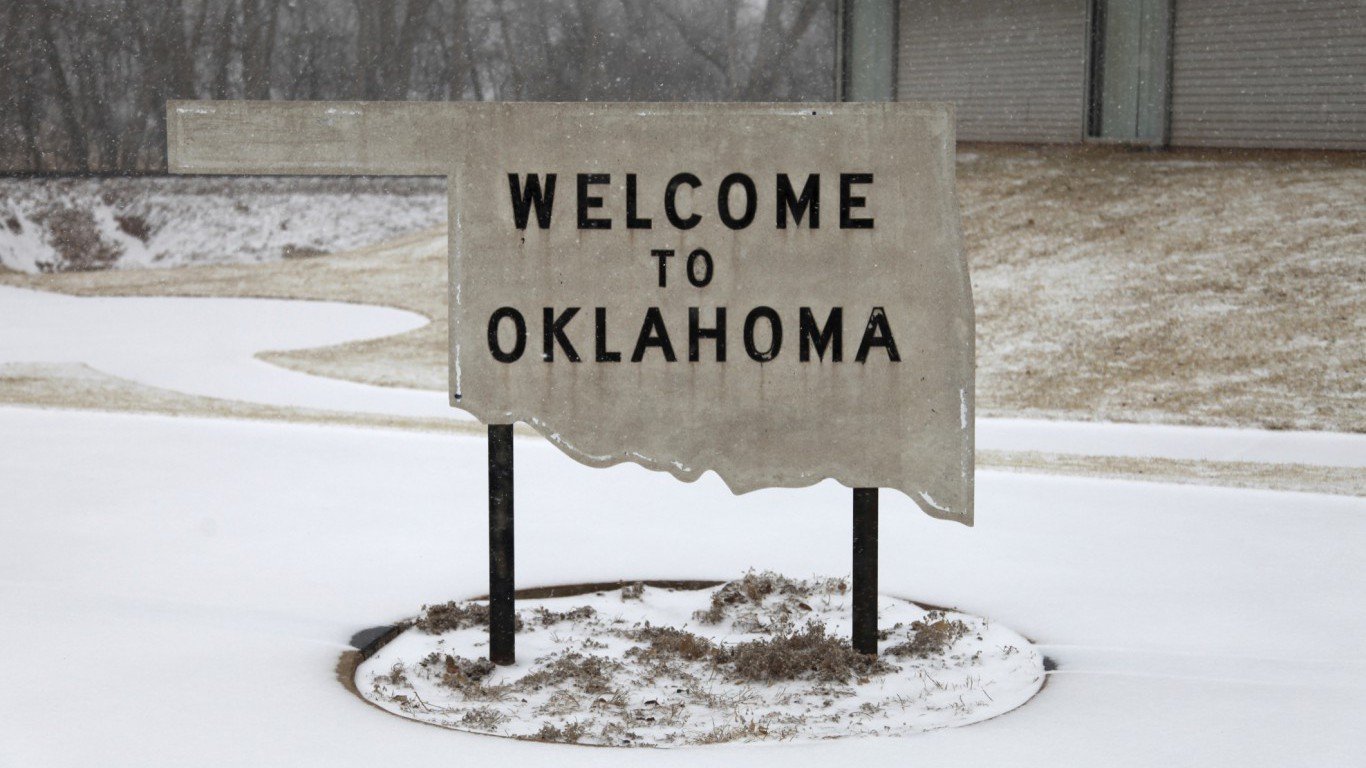
42. Oklahoma
> Pct. of pop. age 65 and up: 15.0% (16th lowest)
> 65 and over poverty rate: 8.6% (25th highest)
> 65 and over bachelor’s deg. attainment: 22.5% (12th lowest)
> Life expectancy at birth: 76.1 years (5th lowest)
By a number of measures related to income, education, and health, Oklahoma ranks as one of the worst states to grow old in. A college degree can help seniors retain cognitive ability in old age. In Oklahoma, however, just 22.5% of residents age 65 and over have a bachelor’s degree, compared to the 26.7% of seniors who do nationwide. College attainment is also highly correlated to income, and the typical senior-led state household earns just $37,596 a year — the eighth least of any state.
Income and educational attainment are both major factors in health and longevity. Some 42.1% of Oklahoma seniors have a disability, the third largest share in the country. The life expectancy in the state is just 76.1 years, the fifth shortest of any state.
[recirclink id=433167]

43. Tennessee
> Pct. of pop. age 65 and up: 15.7% (25th highest)
> 65 and over poverty rate: 8.9% (20th highest)
> 65 and over bachelor’s deg. attainment: 20.9% (6th lowest)
> Life expectancy at birth: 76.3 years (8th lowest)
Tennessee is one of the poorer states. Just 20.9% of residents 65 and over have a bachelor’s degree, and the median household income among seniors is just $38,150 a year — each some of the lowest figures of any state. The average life expectancy in the state is also one of the lowest in the country, and the state has one the highest senior mortality rates.
Certain environmental factors may also make Tennessee a less habitable place for seniors. Walkable areas with access to public transportation allow residents a greater degree of mobility and physical activity, particularly for senior citizens. In Tennessee, just 2.0% of workers commute by walking or taking public transit, the third smallest share of any state. Additionally, there were 633 violent crimes per 100,000 residents in 2016, far more than the national violent crime rate of 397 incidents per 100,000 Americans.
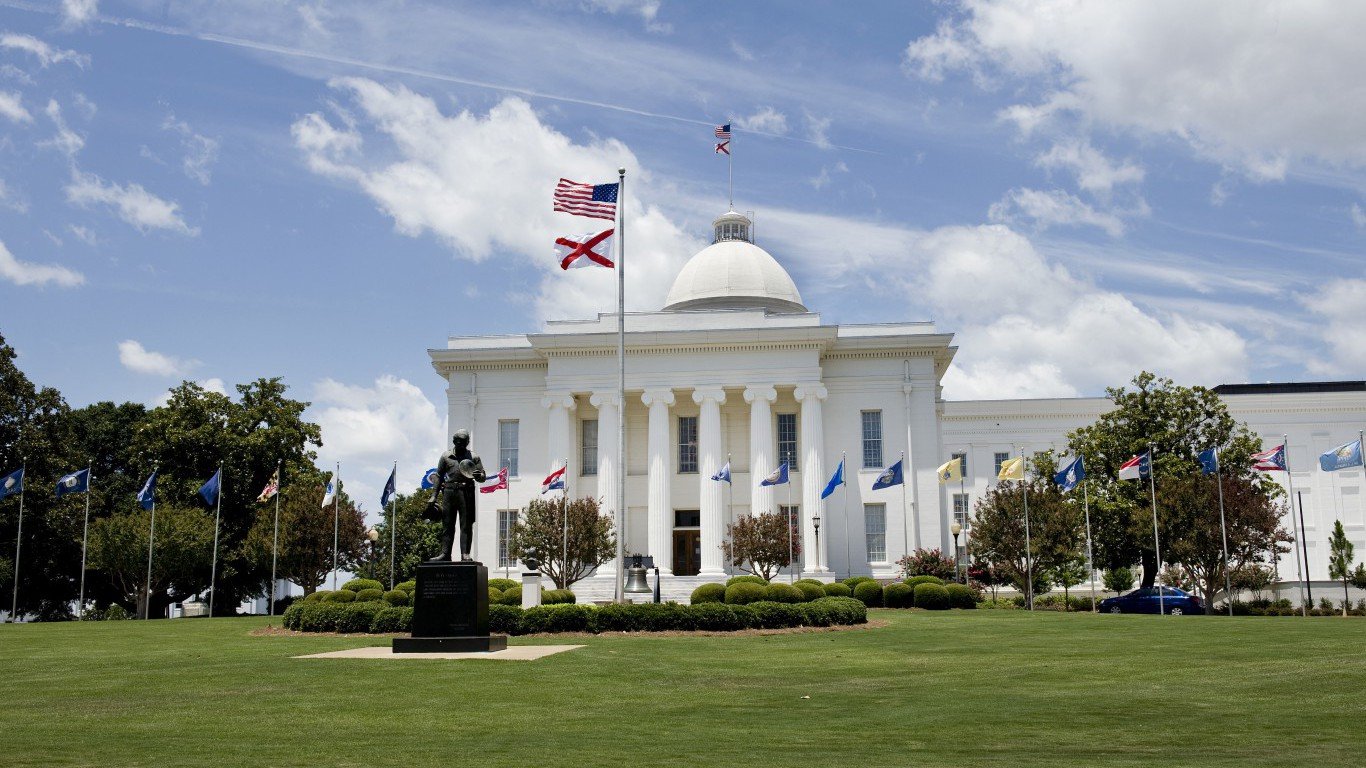
44. Alabama
> Pct. of pop. age 65 and up: 16.1% (20th highest)
> 65 and over poverty rate: 10.0% (12th highest)
> 65 and over bachelor’s deg. attainment: 21.3% (8th lowest)
> Life expectancy at birth: 75.7 years (2nd lowest)
According to a number of measures related to income, health, and environment, Alabama is one of the worst states to grow old in. The median household income among seniors in the state is just $36,580 a year, over $5,500 less than the $42,113 national figure. Income is one of the main determinants of health, and life expectancy in the state is just 75.7 years, less than in any state other than Mississippi.
While in states like New York, Massachusetts, and New Jersey, public transportation helps senior citizens achieve a greater degree of independence and active lifestyles, just 1.5% of workers in Alabama commute on foot or on public transit — the smallest share of any state. Violent crime may also make the state a less desirable place to live, regardless of age. There were 523 violent crimes per 100,000 residents in 2016, the seventh highest violent crime rate.
[in-text-ad-2]
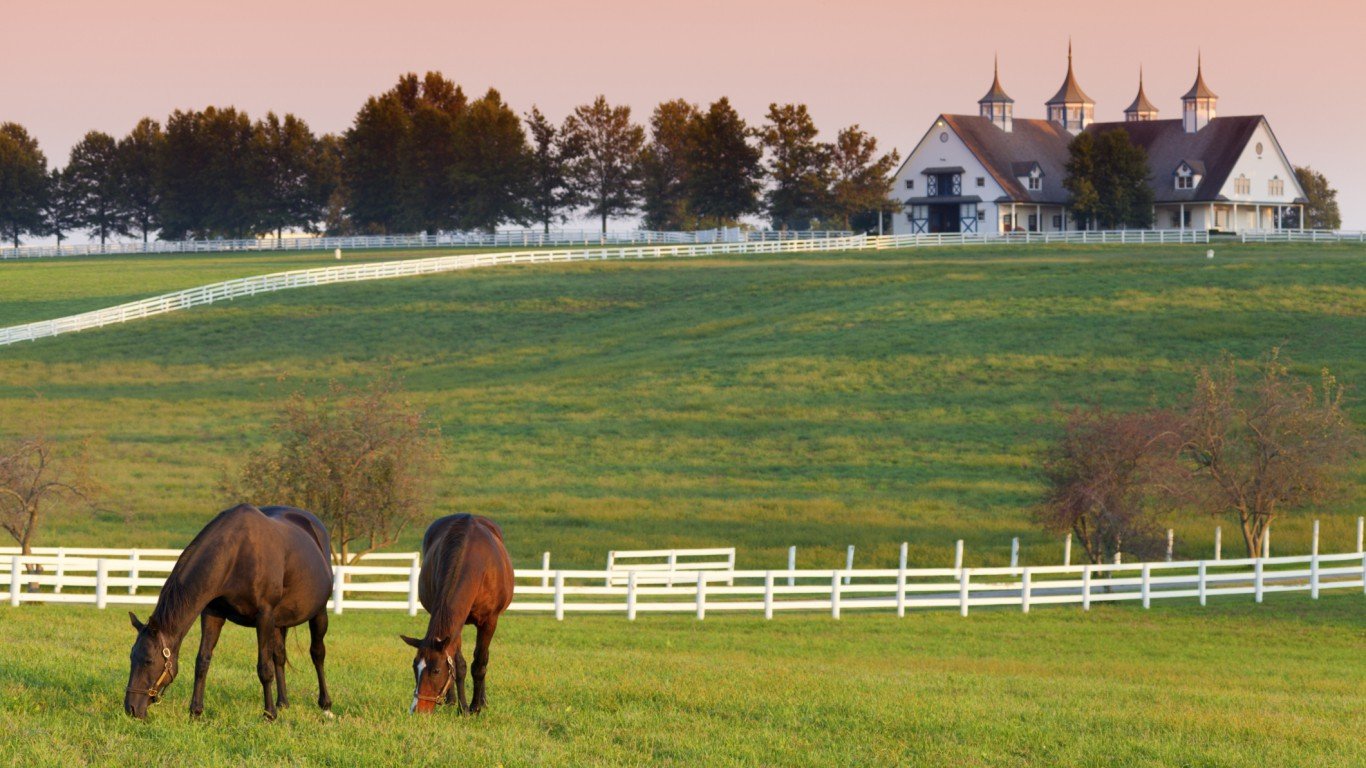
45. Kentucky
> Pct. of pop. age 65 and up: 15.5% (25th lowest)
> 65 and over poverty rate: 11.1% (5th highest)
> 65 and over bachelor’s deg. attainment: 18.7% (2nd lowest)
> Life expectancy at birth: 76.3 years (7th lowest)
Kentucky has one of the least healthy senior populations of any state. Some 42.3% of all residents 65 and over have a disability, the largest share of any state other than West Virginia. Additionally, 4,786 in every 100,000 senior state residents die every year, the highest senior mortality rate of any state.
Two of the largest determinants of health and longevity are education and income. Just 18.7% of residents 65 and over have a bachelor’s degree, the second smallest share in the country. The median household income among seniors is just $35,215 a year, nearly $7,000 less than the national median of $42,113.
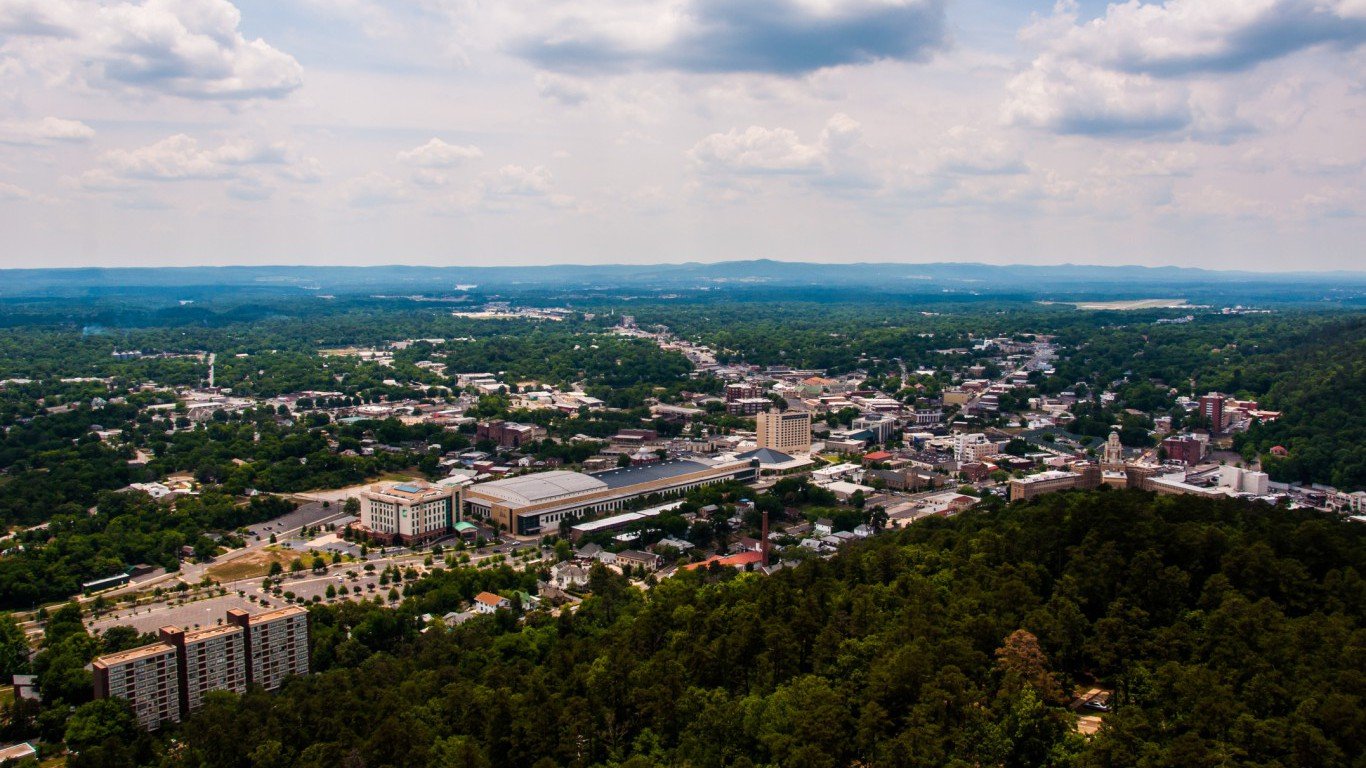
46. Arkansas
> Pct. of pop. age 65 and up: 16.3% (16th highest)
> 65 and over poverty rate: 10.5% (7th highest)
> 65 and over bachelor’s deg. attainment: 19.2% (3rd lowest)
> Life expectancy at birth: 76.2 years (6th lowest)
Arkansas ranks as one of the worst states to grow old in. Just 42.7% of senior households receive retirement income other than Social Security, the fifth smallest share of any state. The lack of supplemental income can put some seniors at risk of financial hardship, and some 10.5% of state residents 65 and over live in poverty, the seventh largest share in the country. The median household income among seniors is just $34,774 a year, far less than the $42,113 national figure and the third least of any state.
Low educational attainment may also contribute to the low incomes among the elderly. A college education can lead to a high-paying job and help secure higher incomes throughout life. In Arkansas, just 19.2% of residents have a bachelor’s degree, the third smallest share of any state.
[in-text-ad]
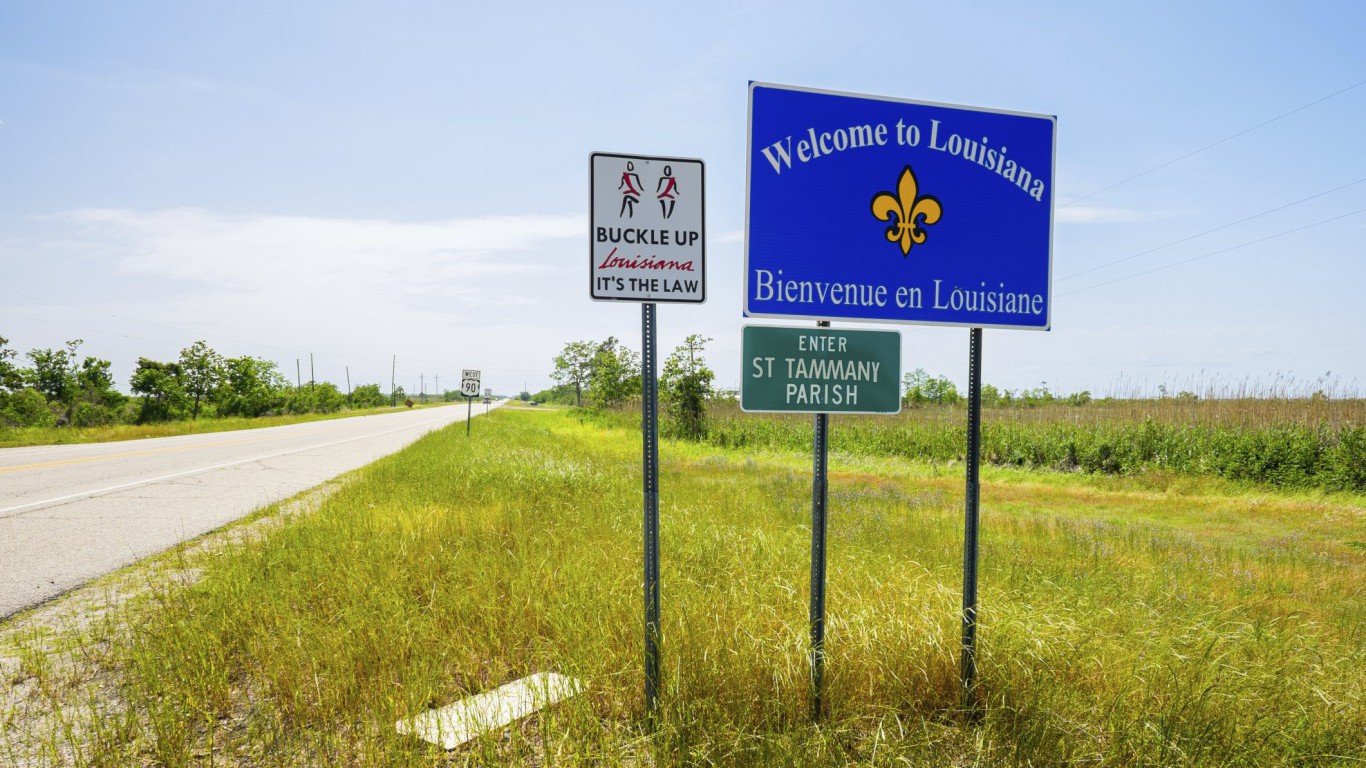
47. Louisiana
> Pct. of pop. age 65 and up: 14.4% (7th lowest)
> 65 and over poverty rate: 13.0% (the highest)
> 65 and over bachelor’s deg. attainment: 21.2% (7th lowest)
> Life expectancy at birth: 75.8 years (3rd lowest)
Just 42.1% of households led by senior citizens in Louisiana receive retirement income other than Social Security, the fourth smallest share of any state. For many older residents who can no longer work, retirement income is necessary to stay out of poverty, and in Louisiana, 13% of adults age 65 and over live in poverty, the largest share of any state. The median household income among state seniors is just $33,632 a year, nearly $8,500 less than the national figure.
Income, particularly in later life, is one of the main determinants of health and longevity. The average resident born in Louisiana is expected to live just 75.8 years, far less than the national life expectancy of 79.1 years. Roughly 4,400 in every 100,000 seniors die every year, among the most of any state.
[recirclink id=433018]
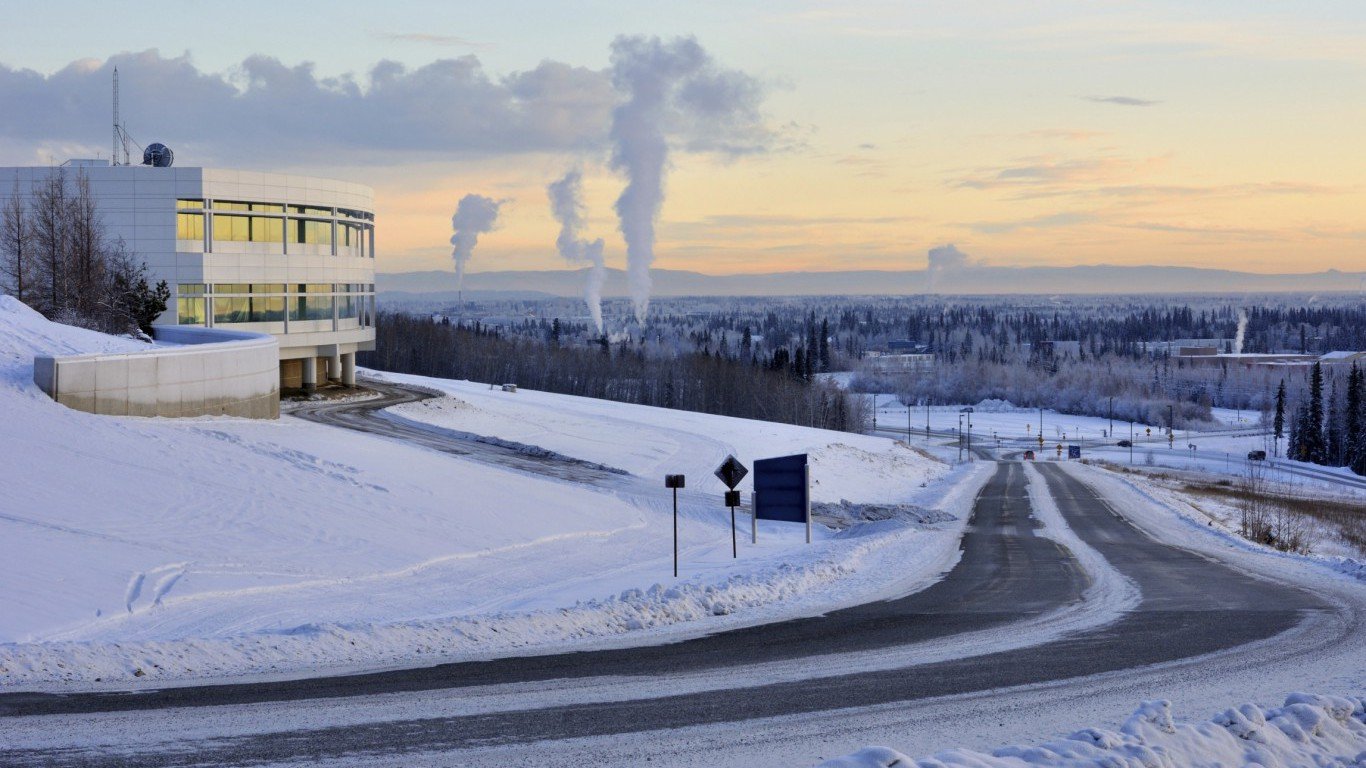
48. Alaska
> Pct. of pop. age 65 and up: 10.2% (the lowest)
> 65 and over poverty rate: 4.2% (the lowest)
> 65 and over bachelor’s deg. attainment: 31.3% (9th highest)
> Life expectancy at birth: 78.4 years (18th lowest)
Alaska has, relatively, the smallest elderly population in the country. Just 10.2% of residents are 65 and older, the smallest share of any state. In addition to it’s less-than-friendly weather, one factor preventing Alaska from becoming a popular retirement destination may be the high cost of living in the state. The majority of Alaska is over 1,000 miles from the U.S. mainland, which can increase the cost of shipping goods to the state. Goods and services are 6% more expensive in Alaska than they are on average nationwide, one of the higher markups nationwide.
Alaska also has the highest violent crime rate of any state, which can reduce the quality of life of all ages. There were 804 violent crimes per 100,000 residents in 2016, more than twice the national rate of 397 violent crimes per 100,000 residents.
49. West Virginia
> Pct. of pop. age 65 and up: 18.8% (3rd highest)
> 65 and over poverty rate: 9.5% (14th highest)
> 65 and over bachelor’s deg. attainment: 16.9% (the lowest)
> Life expectancy at birth: 76.0 years (4th lowest)
By a number of measures related to education, income, and health, West Virginia ranks as the second worst state to grow old in. Just 16.9% of residents age 65 and over have a bachelor’s degree, far less than the 26.7% of seniors nationwide and the smallest share of any state. College attainment is highly correlated with income, and the median household income among seniors in West Virginia is just $36,208 — the fifth lowest of any state.
Income and education are two of the primary determinants of health and longevity. The life expectancy at birth in West Virginia is just 76.0 years, far less than the national life expectancy of 79.1 years. Also, an estimated 4,694 in every 100,000 seniors in the state die every year, the third highest senior mortality rate in the country.
[in-text-ad-2]
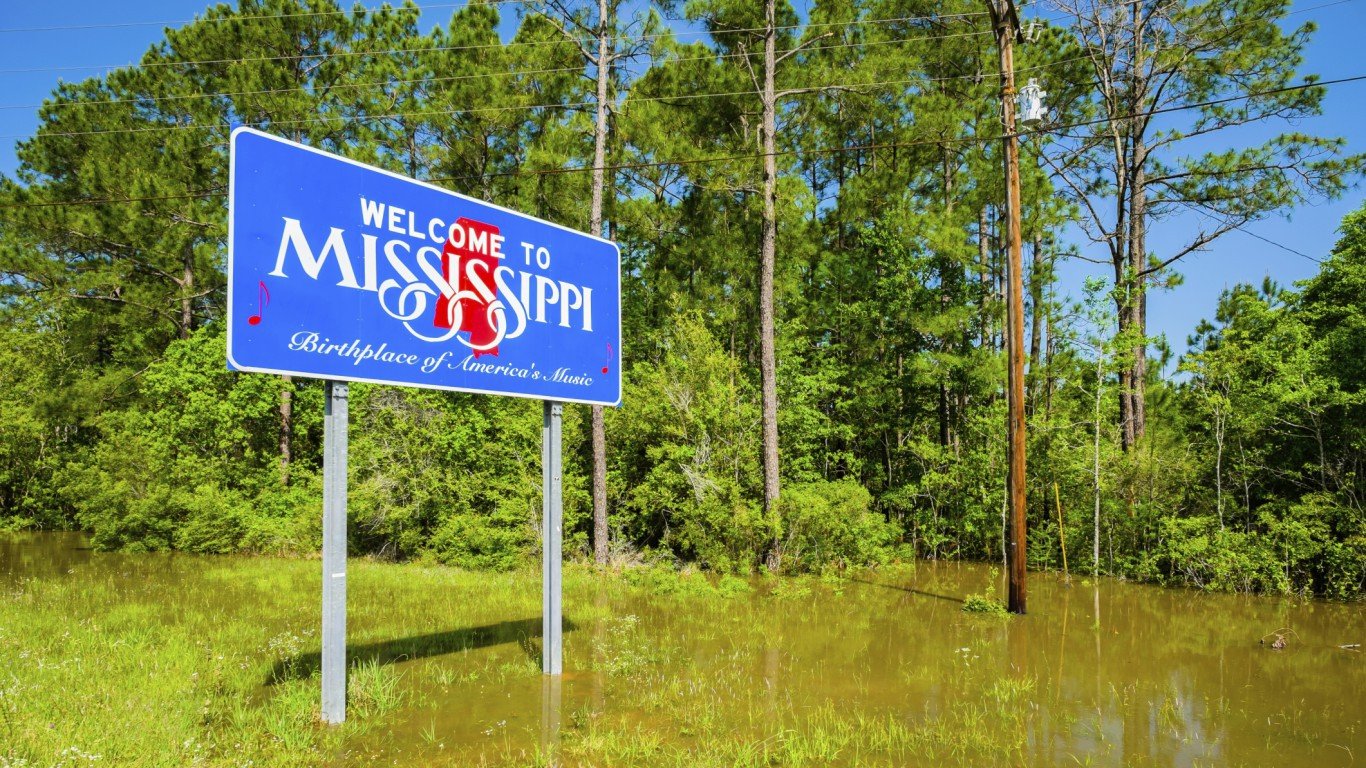
50. Mississippi
> Pct. of pop. age 65 and up: 15.0% (19th lowest)
> 65 and over poverty rate: 12.3% (2nd highest)
> 65 and over bachelor’s deg. attainment: 20.3% (5th lowest)
> Life expectancy at birth: 74.9 years (the lowest)
Mississippi ranks as the worst state to grow old in. Just 44.6% of elderly residents in the state receive retirement income other than Social Security, far less than the 48.8% of older Americans who do. For many seniors in the state, supplemental retirement income may be the difference between poverty and financial security. An estimated 12.3% of state residents 65 and over live in poverty, the second largest share in the country. Overall, the typical senior household earns just $33,026 a year, the least of any state and over $9,000 less than the national median for the age group.
Income is one of the main determinants of health in old age. The average resident born in Mississippi is expected to live just 74.9 years, more than four years less than the average American and the lowest life expectancy of any state.
Detailed Findings
One of the most important factors for a healthy retirement is financial stability. The vast majority of Americans 65 and older are retired or not working, and though nearly 90% of elderly households benefit from Social Security income, government assistance alone is often not enough.
For older Americans living on a limited fixed income, unforeseen expenses can be especially burdensome. As a result, older households with an income stream in addition to Social Security are often far better equipped for retirement and less likely to face serious financial hardship.
Nationwide, 48.8% of households headed by an adult age 65 and older have some supplemental retirement income, such as a pension. In 21 of the 25 states with a larger share of elderly households with supplemental retirement income, the poverty rate among elderly residents is below the national elderly poverty rate of 9.2%.
America’s seniors face other unique challenges in addition to finances. Many seniors no longer drive due to deteriorating vision and worsening reaction times. But this does not have to mean loss of independence and mobility, and some states are better equipped to accommodate residents who no longer drive. States in which large shares of commuters either walk or use public transportation afford better access to services for those who do not drive.
Nationwide, some 7.8% of commuters either walk or use public transit. In several high ranking states on this list, including Maryland and Massachusetts, this share is in the double digits.
Just as maintaining independence can improve quality of life, so too can easy access to venues for social interaction. These venues include performing arts companies, sports stadiums, museums, historical sites, libraries, bars, casinos, golf courses and country clubs, and religious organizations, to name a few. Of the 20 highest ranking states, 14 have a greater concentration of social establishments than the U.S. average concentration of 9.4 venues per 10,000 people.
While remaining social in retirement can be beneficial to overall well-being, access to medical care is critical as well, as health tends to deteriorate with age. As result, states with more hospitals per capita are more likely to rank favorably as ideal places for older Americans.
One factor that can affect a range of outcomes important to seniors, including life expectancy and retirement income, is education. Americans with a college education are more likely to live longer, healthier lives and retain their cognitive abilities into old age. Nationwide, 26.7% of adults 65 and older have a bachelor’s degree or higher. In the 15 top ranking states on this list, this share is higher.
Methodology
To determine the best and worst states in which to grow old, 24/7 Wall St. reviewed several statewide as well as elderly population-specific data. The data includes income, health, education, and environment and access. We created an index of the various measures for each of these four broad categories. The geometric mean of the four index values was used to rank states.
To construct the indices we used the min-max normalization method. For reference, a similar methodology was used in constructing HelpAge International’s Global AgeWatch Index and the United Nation’s Human Development Index.
Income
The percentage of elderly households with supplemental retirement income as well as poverty rates and median household income for the 65 and over population are one-year estimates from the U.S. Census Bureau’s 2016 American Community Survey. Additionally, as a measure of cost of living, we considered regional price parity from the Bureau of Economic Analysis.
Health
The percentage of noninstitutionalized people 65 and over with a disability came from the Census. We also included 2014 life expectancy at birth from the Institute for Health Metrics and Evaluation, a global health research center affiliated with the University of Washington; the percentage of adults who reported having a personal doctor in 2016 from the Kaiser Family Foundation; and the 2013 crude elderly mortality rate per 100,000 people 65 and over in each state from the Centers for Disease Control and Prevention.
Education
The share of people 65 and over with a bachelor’s degree or higher came from the ACS.
Environment and Access
The environment and access category includes 2016 violent crime rates from the FBI’s Uniform Crime Report, and the share of workers who walk or use public transportation is from the ACS. In addition, this category includes data on the number of social establishments — restaurants, libraries, civic organizations, among others — as well as the number of hospitals in the state. Both numbers came from County Business Patterns and are for 2015 and adjusted for population.
Contact [email protected] for any questions or corrections.