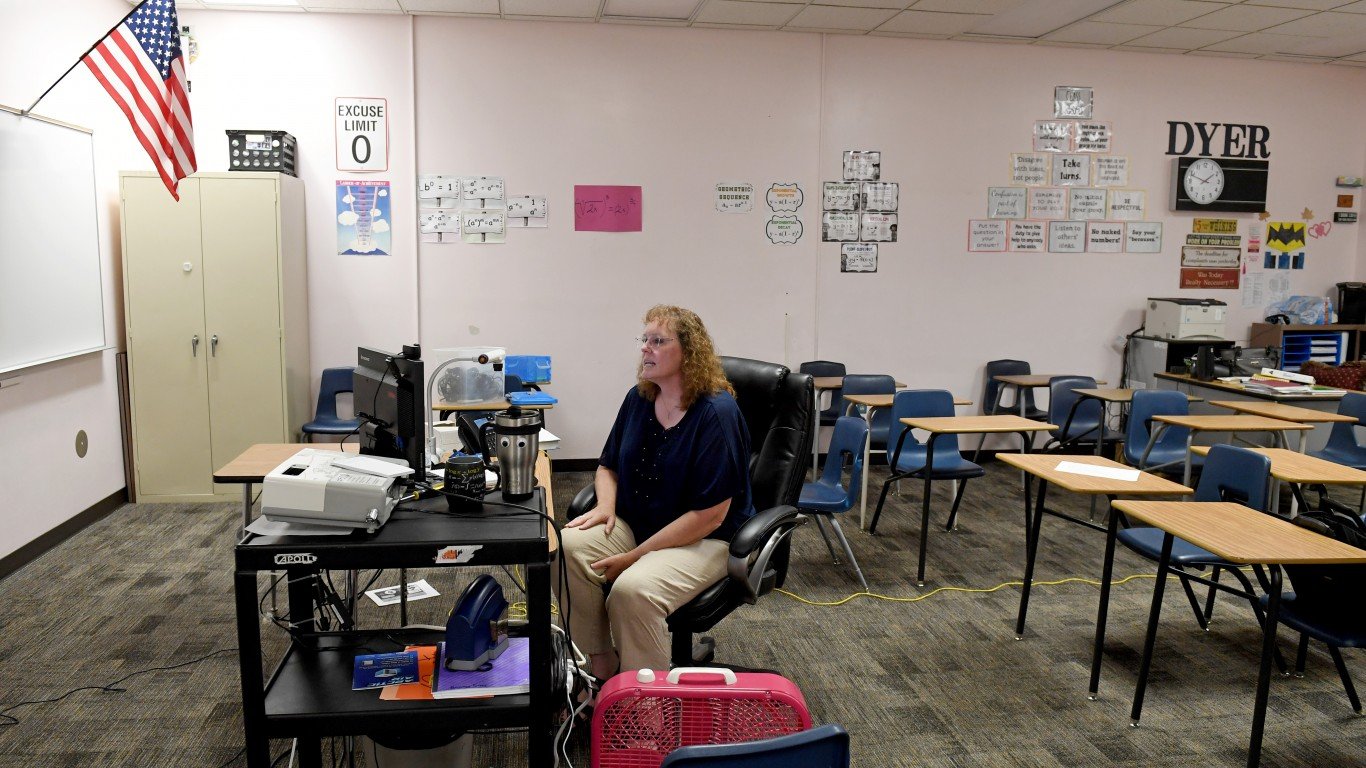
[cnxvideo id=”625445″ placement=”ros”]Teachers are the driving force behind our educational system. They prepare our children for the workforce, for higher education, and for life in general. The profession is widely considered one of the most important and valuable services that contributes to the betterment of society.
Despite being so highly valued, teachers are paid significantly less than other college-educated workers. And though the importance of educating children cannot be overstated, public school funding is a major problem in many, mostly low income, communities across the country.
The recent and ongoing teacher strikes in states like Arizona and Oklahoma (two of the lowest-paying states for teachers) demonstrates that in some states pay structures for teachers may be a serious problem.
The median annual salary across all teaching professions is $57,949, about $3,000 below the median annual salary of $60,996 across all workers with a bachelor’s degree, and nearly $15,000 below the median annual salary of $72,852 across workers with a master’s degree. Approximately 56% of teachers have a master’s degree.
Using U.S. Labor Department data, 24/7 Wall St. reviewed the median annual salary for elementary, middle, and high school teachers in every state. Salary figures include private and public school teachers.
Click here to see the states where teachers are paid the most and least.
Click here to see our detailed findings and methodology.

1. New York
> Median salary, school teachers: $78,576
> Median salary, all workers: $43,690 (6th highest)
> Per pupil expenditure: $18,665 (3rd highest)
> High school graduation rate: 79.2% (13th lowest)
> Cost of living: 15.3% greater than nat’l avg. (2nd highest)
[in-text-ad]

2. Connecticut
> Median salary, school teachers: $78,330
> Median salary, all workers: $45,870 (3rd highest)
> Per pupil expenditure: $17,283 (5th highest)
> High school graduation rate: 87.2% (14th highest)
> Cost of living: 8.7% greater than nat’l avg. (6th highest)
[recirclink id=444492]
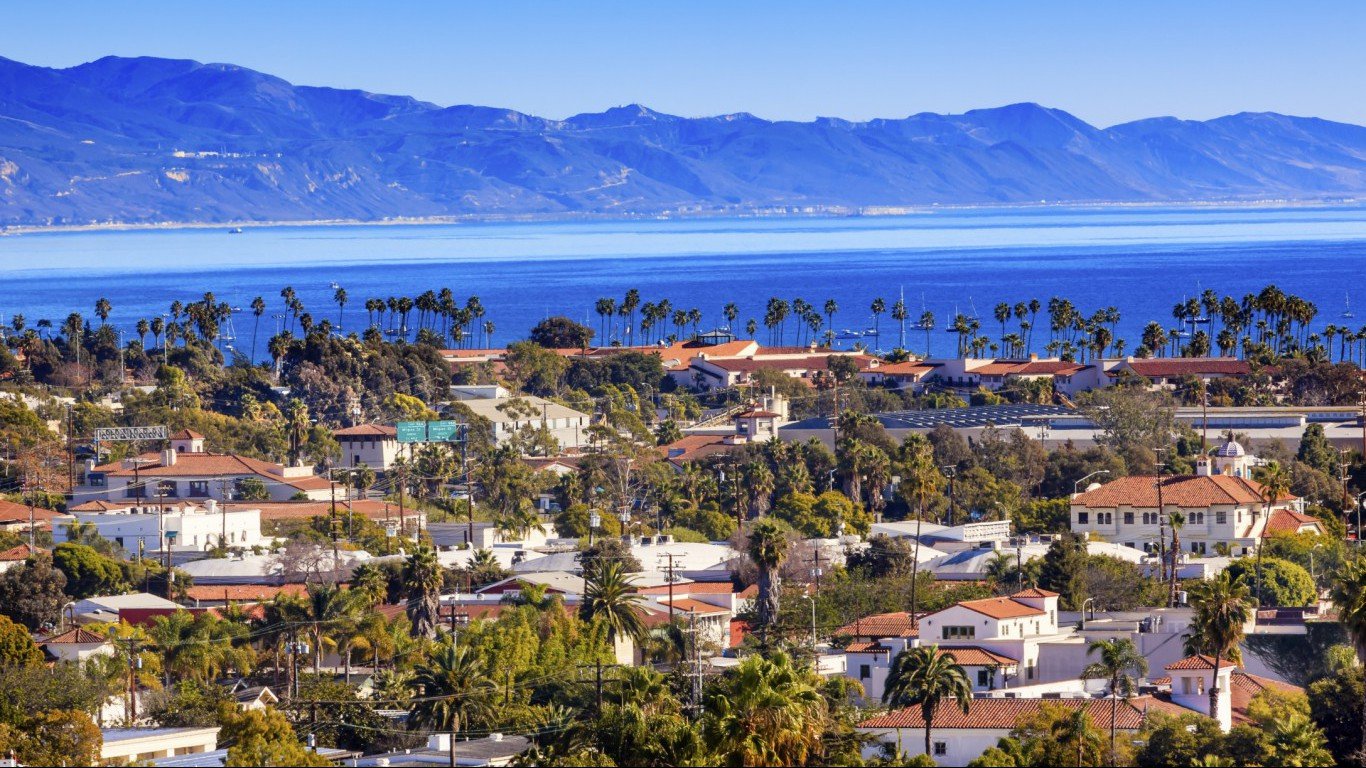
3. California
> Median salary, school teachers: $77,429
> Median salary, all workers: $40,980 (10th highest)
> Per pupil expenditure: $9,417 (8th lowest)
> High school graduation rate: 82.0% (20th lowest)
> Cost of living: 13.4% greater than nat’l avg. (3rd highest)
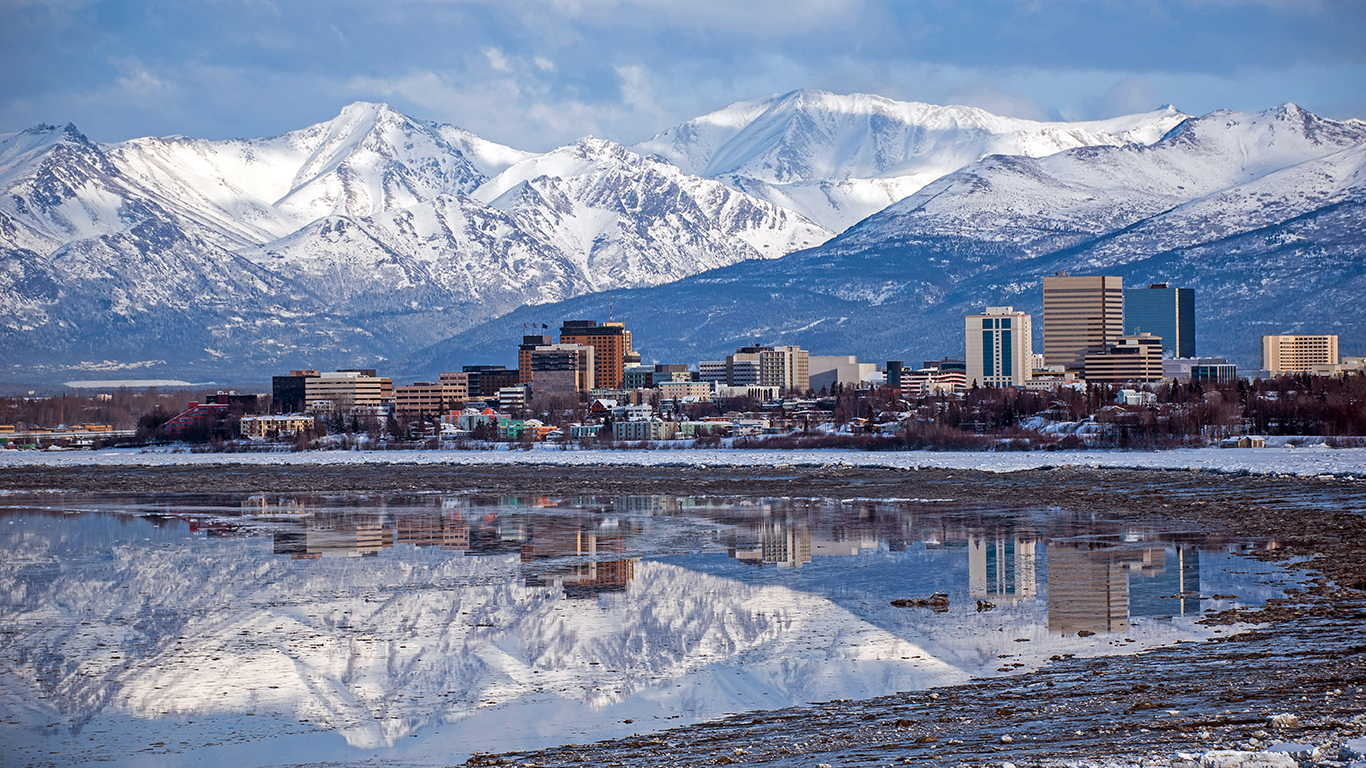
4. Alaska
> Median salary, school teachers: $77,307
> Median salary, all workers: $47,560 (the highest)
> Per pupil expenditure: $20,640 (2nd highest)
> High school graduation rate: 75.6% (5th lowest)
> Cost of living: 5.6% greater than nat’l avg. (8th highest)
[in-text-ad-2]

5. Massachusetts
> Median salary, school teachers: $74,468
> Median salary, all workers: $47,440 (2nd highest)
> Per pupil expenditure: $14,569 (11th highest)
> High school graduation rate: 87.3% (13th highest)
> Cost of living: 6.9% greater than nat’l avg. (7th highest)

6. Rhode Island
> Median salary, school teachers: $69,795
> Median salary, all workers: $40,450 (12th highest)
> Per pupil expenditure: $15,002 (10th highest)
> High school graduation rate: 83.2% (22nd lowest)
> Cost of living: 1.3% less than nat’l avg. (18th highest)
[in-text-ad]

7. New Jersey
> Median salary, school teachers: $68,893
> Median salary, all workers: $42,500 (7th highest)
> Per pupil expenditure: $16,337 (6th highest)
> High school graduation rate: 89.7% (2nd highest)
> Cost of living: 13.4% greater than nat’l avg. (3rd highest)
[recirclink id=444468]

8. Oregon
> Median salary, school teachers: $67,384
> Median salary, all workers: $38,840 (19th highest)
> Per pupil expenditure: $11,515 (22nd lowest)
> High school graduation rate: 73.8% (3rd lowest)
> Cost of living: 0.8% less than nat’l avg. (17th highest)

9. Maryland
> Median salary, school teachers: $65,852
> Median salary, all workers: $43,840 (5th highest)
> Per pupil expenditure: $13,075 (19th highest)
> High school graduation rate: 87.0% (16th highest)
> Cost of living: 9.6% greater than nat’l avg. (5th highest)
[in-text-ad-2]

10. Washington
> Median salary, school teachers: $64,987
> Median salary, all workers: $44,440 (4th highest)
> Per pupil expenditure: $10,395 (16th lowest)
> High school graduation rate: 78.2% (10th lowest)
> Cost of living: 4.8% greater than nat’l avg. (10th highest)

11. Virginia
> Median salary, school teachers: $63,827
> Median salary, all workers: $39,800 (14th highest)
> Per pupil expenditure: $10,358 (15th lowest)
> High school graduation rate: 85.7% (20th highest)
> Cost of living: 2.5% greater than nat’l avg. (12th highest)
[in-text-ad]

12. Pennsylvania
> Median salary, school teachers: $63,171
> Median salary, all workers: $37,540 (21st highest)
> Per pupil expenditure: $15,291 (9th highest)
> High school graduation rate: 84.8% (25th lowest)
> Cost of living: 2.1% less than nat’l avg. (21st highest)
[recirclink id=444391]

13. Michigan
> Median salary, school teachers: $62,442
> Median salary, all workers: $36,650 (23rd highest)
> Per pupil expenditure: $12,765 (21st highest)
> High school graduation rate: 79.8% (15th lowest)
> Cost of living: 6.5% less than nat’l avg. (22nd lowest)

14. Minnesota
> Median salary, school teachers: $61,324
> Median salary, all workers: $41,260 (9th highest)
> Per pupil expenditure: $12,692 (22nd highest)
> High school graduation rate: 81.9% (19th lowest)
> Cost of living: 2.6% less than nat’l avg. (22nd highest)
[in-text-ad-2]

15. Delaware
> Median salary, school teachers: $60,884
> Median salary, all workers: $38,850 (18th highest)
> Per pupil expenditure: $14,224 (13th highest)
> High school graduation rate: 85.6% (22nd highest)
> Cost of living: 0.4% greater than nat’l avg. (14th highest)

16. Illinois
> Median salary, school teachers: $60,749
> Median salary, all workers: $38,870 (17th highest)
> Per pupil expenditure: $13,403 (17th highest)
> High school graduation rate: 85.6% (22nd highest)
> Cost of living: 0.3% less than nat’l avg. (15th highest)
[in-text-ad]

17. Ohio
> Median salary, school teachers: $59,786
> Median salary, all workers: $36,500 (24th highest)
> Per pupil expenditure: $12,543 (23rd highest)
> High school graduation rate: 80.7% (17th lowest)
> Cost of living: 10.8% less than nat’l avg. (7th lowest)
[recirclink id=444326]

18. Hawaii
> Median salary, school teachers: $59,524
> Median salary, all workers: $41,650 (8th highest)
> Per pupil expenditure: $13,436 (16th highest)
> High school graduation rate: 81.6% (18th lowest)
> Cost of living: 18.8% greater than nat’l avg. (the highest)
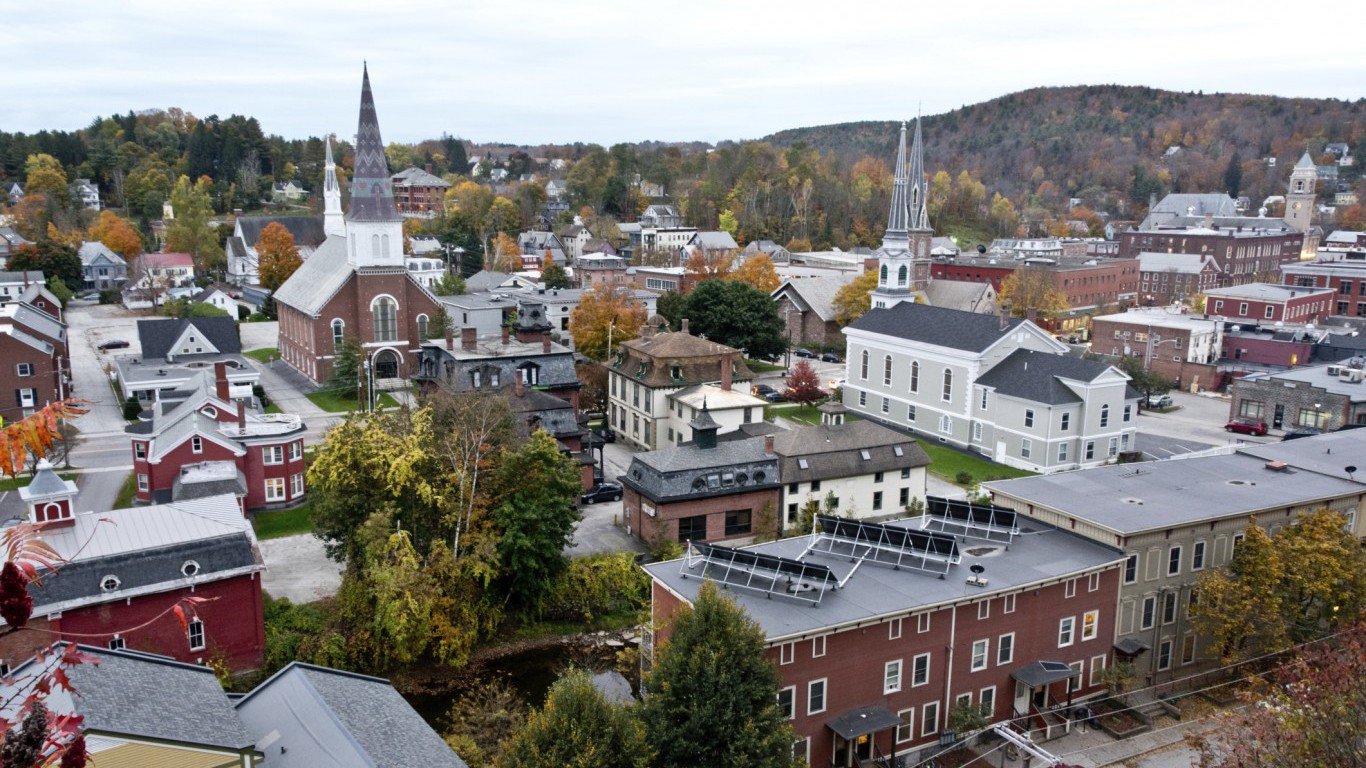
19. Vermont
> Median salary, school teachers: $59,271
> Median salary, all workers: $38,640 (20th highest)
> Per pupil expenditure: $20,795 (the highest)
> High school graduation rate: 87.7% (11th highest)
> Cost of living: 1.6% greater than nat’l avg. (13th highest)
[in-text-ad-2]
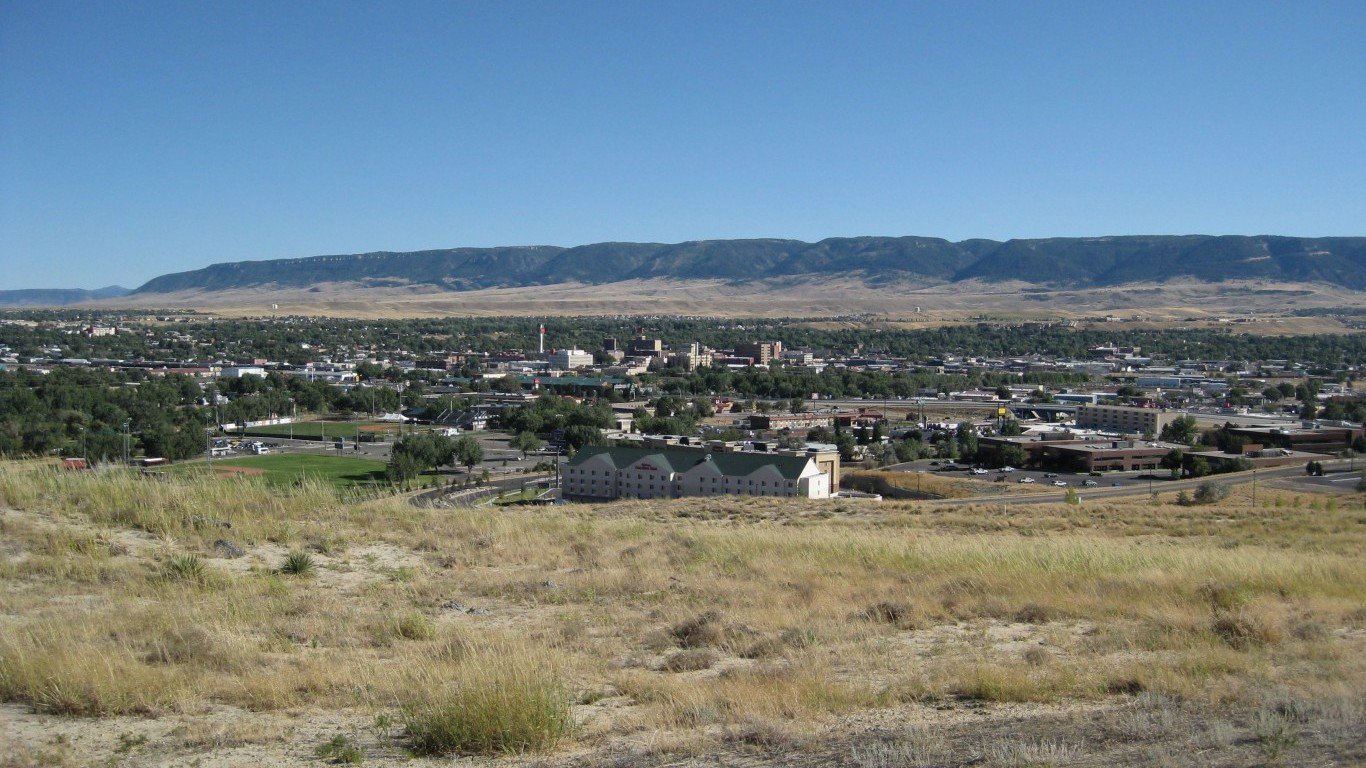
20. Wyoming
> Median salary, school teachers: $58,817
> Median salary, all workers: $39,120 (15th highest)
> Per pupil expenditure: $17,700 (4th highest)
> High school graduation rate: 79.3% (14th lowest)
> Cost of living: 3.8% less than nat’l avg. (25th highest)

21. New Hampshire
> Median salary, school teachers: $58,555
> Median salary, all workers: $38,900 (16th highest)
> Per pupil expenditure: $15,719 (8th highest)
> High school graduation rate: 88.1% (7th highest)
> Cost of living: 5.0% greater than nat’l avg. (9th highest)
[in-text-ad]

22. Texas
> Median salary, school teachers: $56,536
> Median salary, all workers: $36,170 (24th lowest)
> Per pupil expenditure: $8,485 (4th lowest)
> High school graduation rate: 89.0% (4th highest)
> Cost of living: 3.2% less than nat’l avg. (24th highest)
[recirclink id=444046]

23. Wisconsin
> Median salary, school teachers: $56,446
> Median salary, all workers: $37,040 (22nd highest)
> Per pupil expenditure: $12,442 (24th highest)
> High school graduation rate: 88.4% (6th highest)
> Cost of living: 6.9% less than nat’l avg. (20th lowest)

24. Nevada
> Median salary, school teachers: $56,347
> Median salary, all workers: $34,930 (17th lowest)
> Per pupil expenditure: $8,801 (5th lowest)
> High school graduation rate: 71.3% (2nd lowest)
> Cost of living: 2.0% less than nat’l avg. (19th highest)
[in-text-ad-2]

25. Nebraska
> Median salary, school teachers: $55,993
> Median salary, all workers: $36,130 (23rd lowest)
> Per pupil expenditure: $14,028 (14th highest)
> High school graduation rate: 88.9% (5th highest)
> Cost of living: 9.4% less than nat’l avg. (15th lowest)

26. Georgia
> Median salary, school teachers: $55,421
> Median salary, all workers: $35,040 (18th lowest)
> Per pupil expenditure: $9,742 (12th lowest)
> High school graduation rate: 78.8% (11th lowest)
> Cost of living: 7.4% less than nat’l avg. (19th lowest)
[in-text-ad]
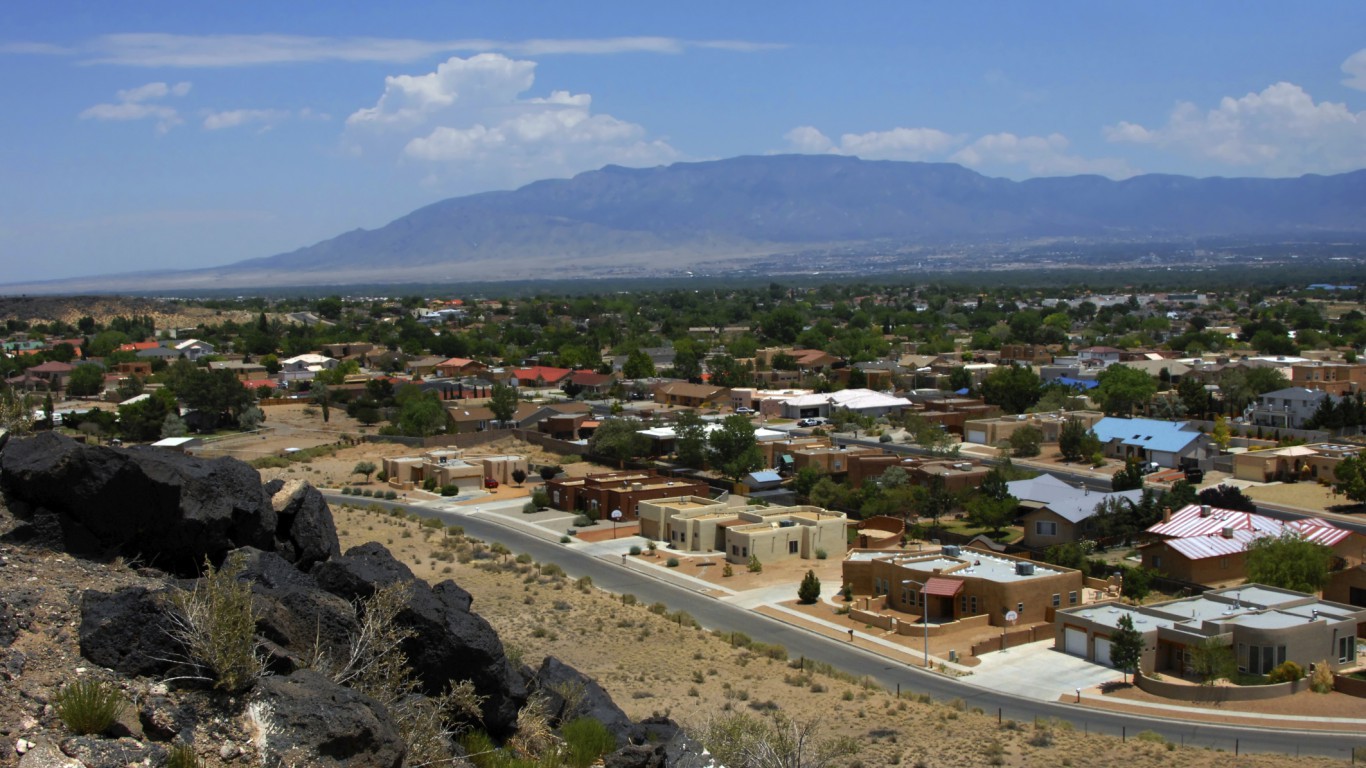
27. New Mexico
> Median salary, school teachers: $54,599
> Median salary, all workers: $33,450 (10th lowest)
> Per pupil expenditure: $10,768 (17th lowest)
> High school graduation rate: 68.6% (the lowest)
> Cost of living: 5.6% less than nat’l avg. (23rd lowest)
[recirclink id=443940]

28. Iowa
> Median salary, school teachers: $53,981
> Median salary, all workers: $35,930 (22nd lowest)
> Per pupil expenditure: $13,102 (18th highest)
> High school graduation rate: 90.8% (the highest)
> Cost of living: 9.7% less than nat’l avg. (12th lowest)
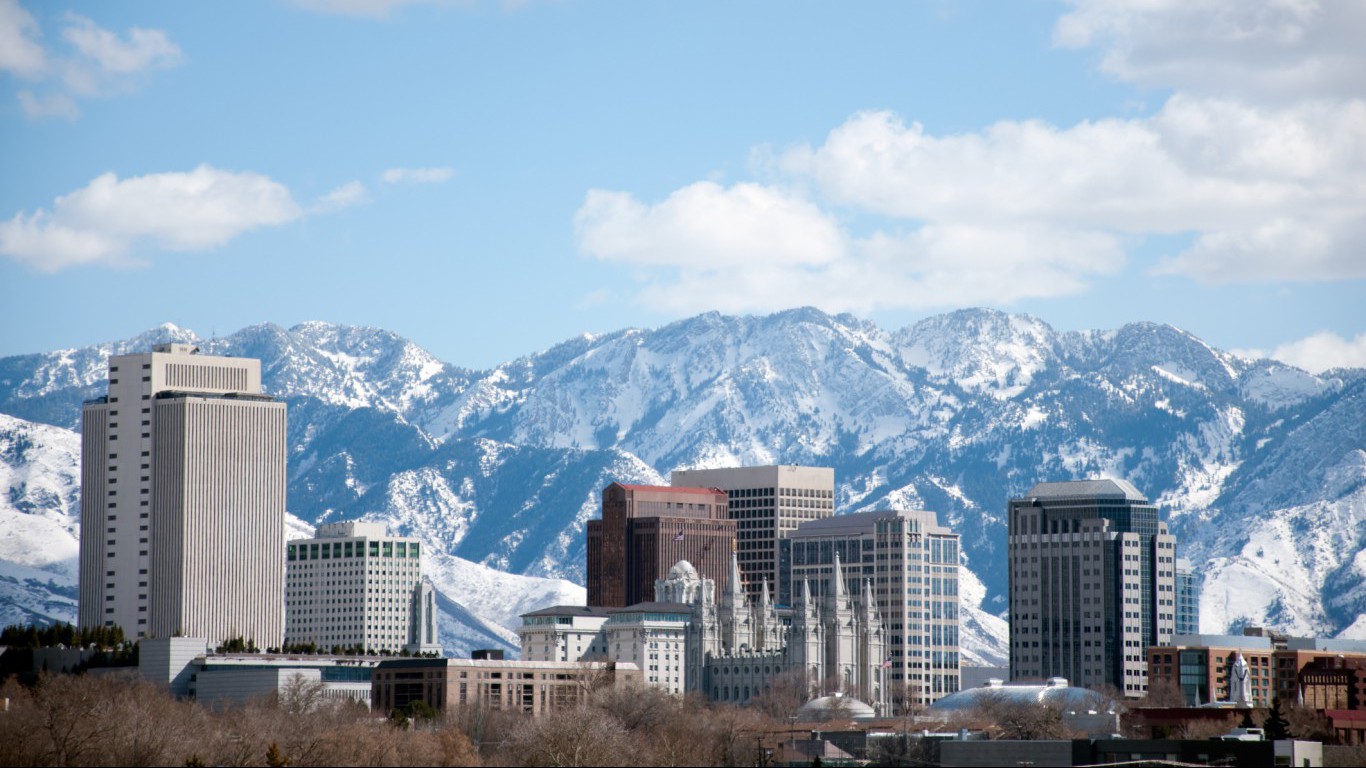
29. Utah
> Median salary, school teachers: $53,912
> Median salary, all workers: $35,650 (21st lowest)
> Per pupil expenditure: $7,207 (the lowest)
> High school graduation rate: 84.8% (25th lowest)
> Cost of living: 3.0% less than nat’l avg. (23rd highest)
[in-text-ad-2]

30. Kentucky
> Median salary, school teachers: $53,906
> Median salary, all workers: $33,790 (12th lowest)
> Per pupil expenditure: $10,945 (18th lowest)
> High school graduation rate: 88.0% (8th highest)
> Cost of living: 11.4% less than nat’l avg. (5th lowest)

31. Maine
> Median salary, school teachers: $53,180
> Median salary, all workers: $36,210 (25th lowest)
> Per pupil expenditure: $15,912 (7th highest)
> High school graduation rate: 87.5% (12th highest)
> Cost of living: 2.0% less than nat’l avg. (19th highest)
[in-text-ad]

32. Montana
> Median salary, school teachers: $50,851
> Median salary, all workers: $33,840 (13th lowest)
> Per pupil expenditure: $13,849 (15th highest)
> High school graduation rate: 86.0% (19th highest)
> Cost of living: 5.2% less than nat’l avg. (24th lowest)
[recirclink id=443564]

33. South Carolina
> Median salary, school teachers: $50,823
> Median salary, all workers: $32,780 (6th lowest)
> Per pupil expenditure: $11,178 (20th lowest)
> High school graduation rate: 80.3% (16th lowest)
> Cost of living: 9.7% less than nat’l avg. (12th lowest)

34. Colorado
> Median salary, school teachers: $50,284
> Median salary, all workers: $40,880 (11th highest)
> Per pupil expenditure: $9,733 (10th lowest)
> High school graduation rate: 77.3% (6th lowest)
> Cost of living: 3.2% greater than nat’l avg. (11th highest)
[in-text-ad-2]
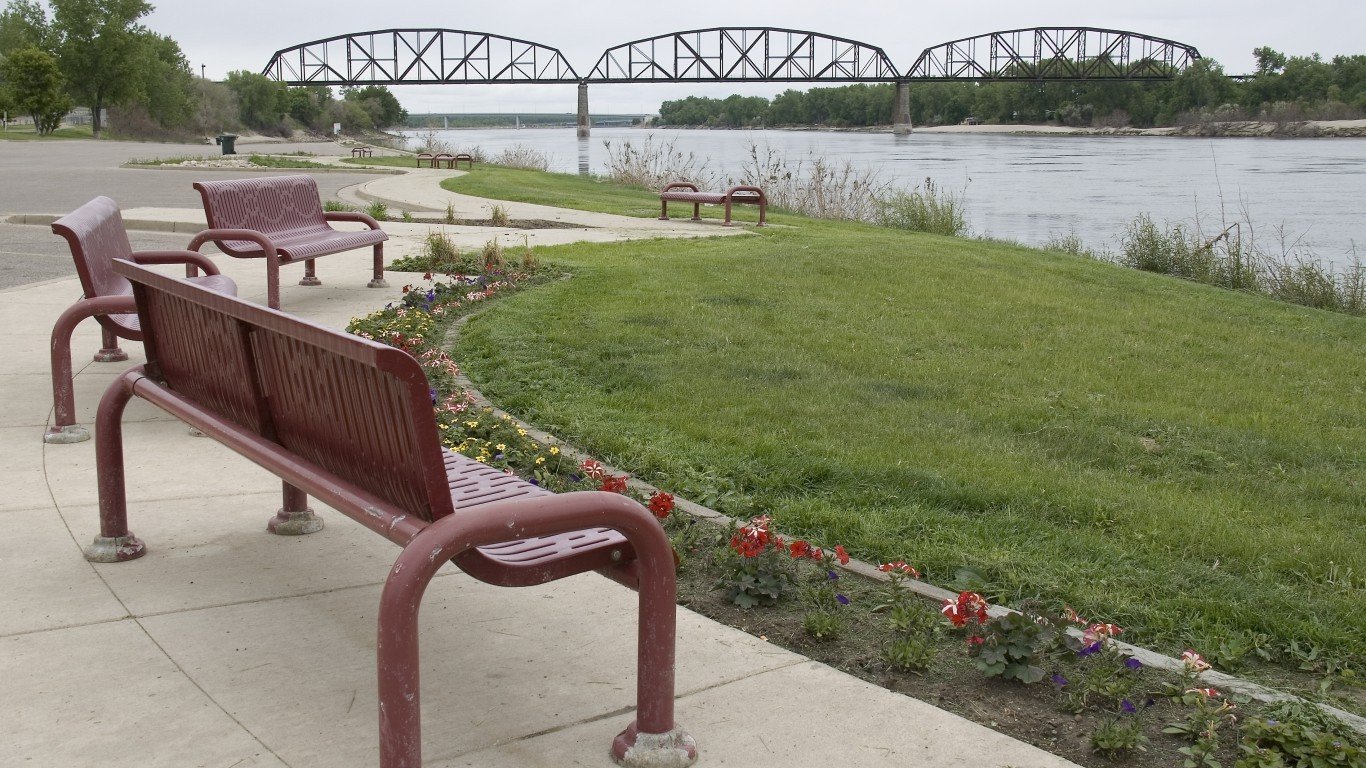
35. North Dakota
> Median salary, school teachers: $50,209
> Median salary, all workers: $40,040 (13th highest)
> Per pupil expenditure: $14,372 (12th highest)
> High school graduation rate: 86.6% (17th highest)
> Cost of living: 7.7% less than nat’l avg. (18th lowest)

36. Alabama
> Median salary, school teachers: $49,777
> Median salary, all workers: $32,800 (7th lowest)
> Per pupil expenditure: $10,142 (14th lowest)
> High school graduation rate: 89.3% (3rd highest)
> Cost of living: 13.2% less than nat’l avg. (2nd lowest)
[in-text-ad]

37. Indiana
> Median salary, school teachers: $49,759
> Median salary, all workers: $34,590 (15th lowest)
> Per pupil expenditure: $11,342 (21st lowest)
> High school graduation rate: 87.1% (15th highest)
> Cost of living: 9.3% less than nat’l avg. (16th lowest)
[recirclink id=443882]

38. Tennessee
> Median salary, school teachers: $49,303
> Median salary, all workers: $33,860 (14th lowest)
> Per pupil expenditure: $9,605 (9th lowest)
> High school graduation rate: 87.9% (9th highest)
> Cost of living: 10.1% less than nat’l avg. (10th lowest)

39. Arkansas
> Median salary, school teachers: $48,512
> Median salary, all workers: $30,810 (2nd lowest)
> Per pupil expenditure: $11,758 (24th lowest)
> High school graduation rate: 84.9% (25th highest)
> Cost of living: 12.6% less than nat’l avg. (3rd lowest)
[in-text-ad-2]

40. Kansas
> Median salary, school teachers: $48,453
> Median salary, all workers: $35,150 (20th lowest)
> Per pupil expenditure: $11,761 (25th lowest)
> High school graduation rate: 85.7% (20th highest)
> Cost of living: 9.6% less than nat’l avg. (13th lowest)

41. Louisiana
> Median salary, school teachers: $48,307
> Median salary, all workers: $32,490 (5th lowest)
> Per pupil expenditure: $12,153 (25th highest)
> High school graduation rate: 77.5% (8th lowest)
> Cost of living: 9.4% less than nat’l avg. (15th lowest)
[in-text-ad]

42. Florida
> Median salary, school teachers: $48,134
> Median salary, all workers: $33,420 (9th lowest)
> Per pupil expenditure: $9,737 (11th lowest)
> High school graduation rate: 77.9% (9th lowest)
> Cost of living: 0.5% less than nat’l avg. (16th highest)
[recirclink id=443620]

43. Missouri
> Median salary, school teachers: $47,806
> Median salary, all workers: $35,050 (19th lowest)
> Per pupil expenditure: $11,558 (23rd lowest)
> High school graduation rate: 87.8% (10th highest)
> Cost of living: 10.7% less than nat’l avg. (8th lowest)

44. Idaho
> Median salary, school teachers: $46,446
> Median salary, all workers: $33,250 (8th lowest)
> Per pupil expenditure: $8,422 (3rd lowest)
> High school graduation rate: 78.9% (12th lowest)
> Cost of living: 6.6% less than nat’l avg. (21st lowest)
[in-text-ad-2]

45. West Virginia
> Median salary, school teachers: $45,437
> Median salary, all workers: $31,540 (3rd lowest)
> Per pupil expenditure: $12,993 (20th highest)
> High school graduation rate: 86.5% (18th highest)
> Cost of living: 11.1% less than nat’l avg. (6th lowest)

46. North Carolina
> Median salary, school teachers: $45,195
> Median salary, all workers: $34,750 (16th lowest)
> Per pupil expenditure: $9,217 (6th lowest)
> High school graduation rate: 85.6% (22nd highest)
> Cost of living: 8.8% less than nat’l avg. (17th lowest)
[in-text-ad]

47. Mississippi
> Median salary, school teachers: $44,294
> Median salary, all workers: $30,070 (the lowest)
> Per pupil expenditure: $9,885 (13th lowest)
> High school graduation rate: 75.4% (4th lowest)
> Cost of living: 13.8% less than nat’l avg. (the lowest)
[recirclink id=443575]

48. Arizona
> Median salary, school teachers: $44,284
> Median salary, all workers: $36,270 (25th highest)
> Per pupil expenditure: $8,131 (2nd lowest)
> High school graduation rate: 77.4% (7th lowest)
> Cost of living: 3.8% less than nat’l avg. (25th highest)

49. South Dakota
> Median salary, school teachers: $41,271
> Median salary, all workers: $32,340 (4th lowest)
> Per pupil expenditure: $11,133 (19th lowest)
> High school graduation rate: 83.9% (23rd lowest)
> Cost of living: 11.8% less than nat’l avg. (4th lowest)
[in-text-ad-2]

50. Oklahoma
> Median salary, school teachers: $39,306
> Median salary, all workers: $33,630 (11th lowest)
> Per pupil expenditure: $9,227 (7th lowest)
> High school graduation rate: 82.5% (21st lowest)
> Cost of living: 10.1% less than nat’l avg. (10th lowest)
Detailed Findings & Methodology
Teacher salaries are just one component of a state’s overall public schools spending, and states with low teacher salaries also have relatively low per-pupil expenditures. In the 25 states with higher median annual teacher salaries, per-pupil expenditures exceed the average expenditure of $12,526 per pupil nationwide. Only five states on the lower end of the teacher pay spectrum have per-pupil expenditures that exceed national average spending.
State spending on education, like most other programs and services, largely depends on its revenue.
States that pay teachers relatively little and that have relatively low per-pupil expenditures simply may not be able to spend more. In fact, in states with low teacher salaries, public educational investments tend to be relatively large as a percentage of overall public spending. The opposite is true among states with high teacher salaries — educational investments represent smaller shares of overall public spending. But because revenue is very high compared with other states, education spending is also high.
There is not a strong connection between school resources and student outcomes, although spending under a certain amount can result in poor outcomes. Having at least up-to-date facilities and minimal educational resources can support better test scores, higher graduation rates, and greater future success. But most teachers do not pursue teaching careers in order to make money, which is one of the many reasons outcomes vary considerably across the United States regardless of money spent on education.
To give one example: The median annual salaries of teachers in Iowa and New Mexico, the states with the highest and lowest high school graduation rates, are about the same and not dramatically different from the national median teacher salary.
To identify the states where teachers are paid the most (and the least), 24/7 Wall St. reviewed the median annual salary for elementary, middle, and secondary schools teachers at public and private institutions in every state from the Occupational Employment Statistics (OES) program produced by the U.S. Labor Department. Median salaries for all workers in each state are also from the OES. Statewide per-pupil expenditures in every state as of 2015 are for public schools only and came from the U.S. Census Bureau’s survey of school finances. There are many high school graduation rates. We chose the newer adjusted cohort graduation rate, which measures the percentage of public school students who attain a regular high school diploma within four years of starting ninth grade. The cohort is adjusted by adding students who transfer in during those four years and by subtracting students who transfer out. Cost of living figures and came from the Bureau of Economic Analysis and are for 2015, the latest year for which data is available.
Contact [email protected] for any questions or corrections.