[cnxvideo id=”625447″ placement=”ros”]Going out to eat is more popular than ever. Americans in the 1950s spent three times as much on groceries as on food away from home. In 2014, for the first time, restaurant spending surpassed grocery spending.
According to the U.S. Census Bureau, there are approximately 78 full-service restaurants per 100,000 Americans, and annual restaurant sales amount to $704.18 per person. In some wealthy, tourist-heavy cities, going out to eat is very common, and the concentration of restaurants and money spent at fine dining establishments per capita is more than four times the national average.
To determine the cities where people go out to eat all the time, 24/7 Wall St. created an index based on the number of full-service restaurants and full-service restaurant spending per capita across 917 urban areas of at least 10,000 people. To hone in on the fine-dining sector, only full-service restaurants were considered. Full-service restaurants include establishments that generally offer table service with a wait staff, serving food and beverages for consumption on-premises. Limited-service restaurants, which include establishments in which patrons select and pay for items before eating, were not considered.
The array of available dining options may also impact restaurant spending. While nationwide there are about as many full-service restaurants as there are limited-service restaurants — also known as fast food restaurants — in some wealthy, tourist-heavy cities the ratio of fine-dining to fast-food establishments is greater than three to one. In 47 of the 50 cities with the highest fine-dining restaurant spending per capita, the ratio of full-service to limited-service restaurants is greater than the national value.
Correction: A previous version of this article referenced a Zagat figure on the number of times Americans go out to eat a week. This figure was misleading because it includes non full-service restaurants, while the focus of our article is full-service restaurants only. This reference has been removed.
Click here to see the full list of cities where people go out to eat all the time.
Click here to see our detailed findings and methodology.

50. Butte-Silver Bow, MT
> Restaurants per 100,000 residents: 112.8 (top 10%)
> Annual restaurant sales per capita: $1,037 (top 10%)
> Full-service to fast-food restaurant ratio: 1.1:1
> Population: 34,560
[in-text-ad]

49. San Luis Obispo-Paso Robles-Arroyo Grande, CA
> Restaurants per 100,000 residents: 122.0 (top 10%)
> Annual restaurant sales per capita: $960 (top 10%)
> Full-service to fast-food restaurant ratio: 1.5:1 (top 25%)
> Population: 278,680
[recirclink id=444492]

48. Santa Fe, NM
> Restaurants per 100,000 residents: 107.2 (top 10%)
> Annual restaurant sales per capita: $1,102 (top 10%)
> Full-service to fast-food restaurant ratio: 1.4:1 (top 25%)
> Population: 147,320

47. Carson City, NV
> Restaurants per 100,000 residents: 115.8 (top 10%)
> Annual restaurant sales per capita: $1,033 (top 10%)
> Full-service to fast-food restaurant ratio: 1.1:1
> Population: 54,412
[in-text-ad-2]
46. Glens Falls, NY
> Restaurants per 100,000 residents: 146.0 (top 10%)
> Annual restaurant sales per capita: $773 (top 25%)
> Full-service to fast-food restaurant ratio: 1.9:1 (top 10%)
> Population: 127,376

45. Boulder, CO
> Restaurants per 100,000 residents: 107.7 (top 10%)
> Annual restaurant sales per capita: $1,140 (top 10%)
> Full-service to fast-food restaurant ratio: 1.2:1
> Population: 313,961
[in-text-ad]
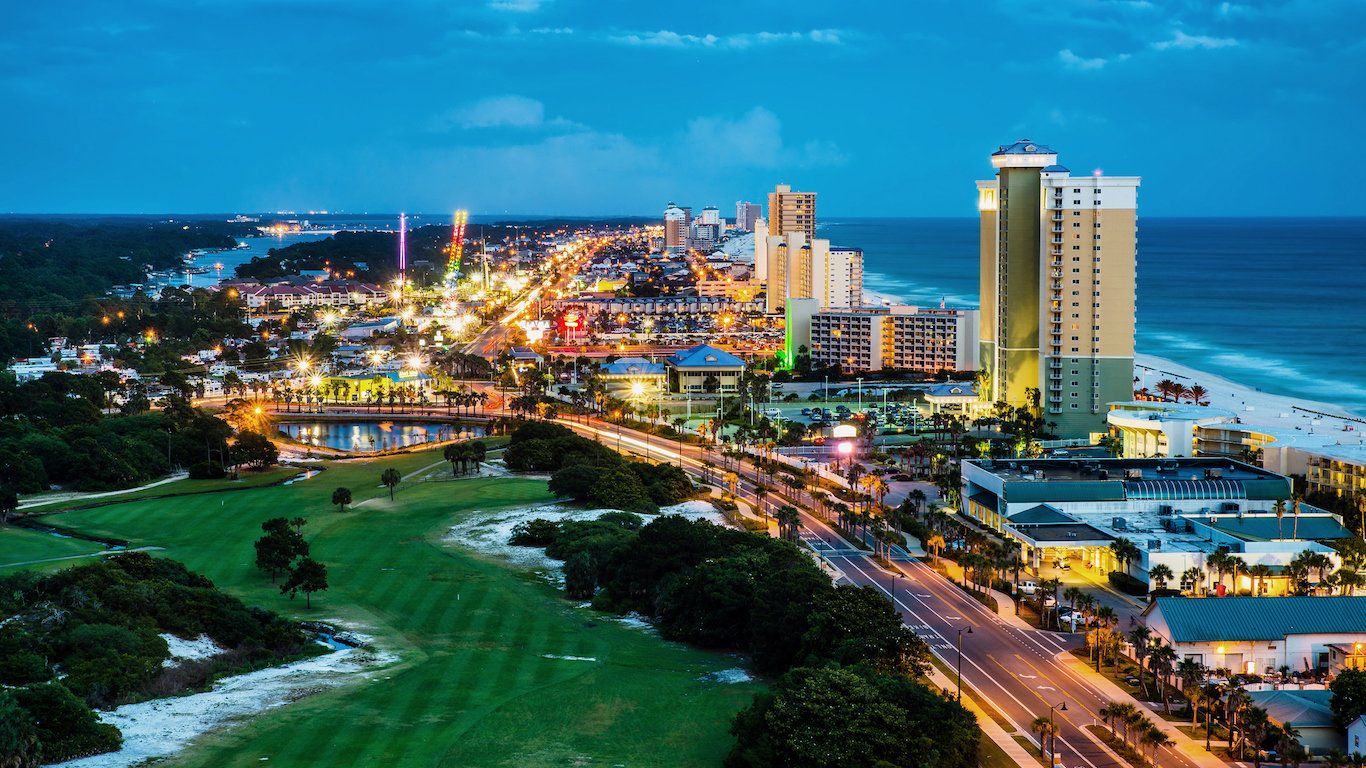
44. Panama City, FL
> Restaurants per 100,000 residents: 105.6 (top 10%)
> Annual restaurant sales per capita: $1,166 (top 10%)
> Full-service to fast-food restaurant ratio: 1.3:1
> Population: 194,212
[recirclink id=444468]

43. San Francisco-Oakland-Hayward, CA
> Restaurants per 100,000 residents: 117.4 (top 10%)
> Annual restaurant sales per capita: $1,099 (top 10%)
> Full-service to fast-food restaurant ratio: 1.4:1 (top 25%)
> Population: 4,577,530

42. Portland-South Portland, ME
> Restaurants per 100,000 residents: 130.2 (top 10%)
> Annual restaurant sales per capita: $1,023 (top 10%)
> Full-service to fast-food restaurant ratio: 1.6:1 (top 25%)
> Population: 523,874
[in-text-ad-2]

41. Flagstaff, AZ
> Restaurants per 100,000 residents: 122.4 (top 10%)
> Annual restaurant sales per capita: $1,107 (top 10%)
> Full-service to fast-food restaurant ratio: 1.3:1 (top 25%)
> Population: 138,064

40. Durango, CO
> Restaurants per 100,000 residents: 127.8 (top 10%)
> Annual restaurant sales per capita: $1,084 (top 10%)
> Full-service to fast-food restaurant ratio: 1.4:1 (top 25%)
> Population: 53,994
[in-text-ad]

39. Taos, NM
> Restaurants per 100,000 residents: 163.8 (top 10%)
> Annual restaurant sales per capita: $793 (top 25%)
> Full-service to fast-food restaurant ratio: 2.3:1 (top 10%)
> Population: 32,961
[recirclink id=444391]

38. Brookings, OR
> Restaurants per 100,000 residents: 187.8 (top 10%)
> Annual restaurant sales per capita: $619
> Full-service to fast-food restaurant ratio: 2.8:1 (top 10%)
> Population: 22,364

37. Laconia, NH
> Restaurants per 100,000 residents: 140.7 (top 10%)
> Annual restaurant sales per capita: $1,066 (top 10%)
> Full-service to fast-food restaurant ratio: 1.8:1 (top 10%)
> Population: 60,392
[in-text-ad-2]

36. Bozeman, MT
> Restaurants per 100,000 residents: 143.9 (top 10%)
> Annual restaurant sales per capita: $1,069 (top 10%)
> Full-service to fast-food restaurant ratio: 1.5:1 (top 25%)
> Population: 97,958

35. Hood River, OR
> Restaurants per 100,000 residents: 162.0 (top 10%)
> Annual restaurant sales per capita: $908 (top 10%)
> Full-service to fast-food restaurant ratio: 1.5:1 (top 25%)
> Population: 22,842
[in-text-ad]

34. Daphne-Fairhope-Foley, AL
> Restaurants per 100,000 residents: 118.3 (top 10%)
> Annual restaurant sales per capita: $1,355 (top 10%)
> Full-service to fast-food restaurant ratio: 1.5:1 (top 25%)
> Population: 199,510
[recirclink id=444326]

33. Branson, MO
> Restaurants per 100,000 residents: 134.0 (top 10%)
> Annual restaurant sales per capita: $1,224 (top 10%)
> Full-service to fast-food restaurant ratio: 1.5:1 (top 25%)
> Population: 85,050

32. Port Clinton, OH
> Restaurants per 100,000 residents: 148.8 (top 10%)
> Annual restaurant sales per capita: $1,159 (top 10%)
> Full-service to fast-food restaurant ratio: 1.8:1 (top 10%)
> Population: 40,981
[in-text-ad-2]
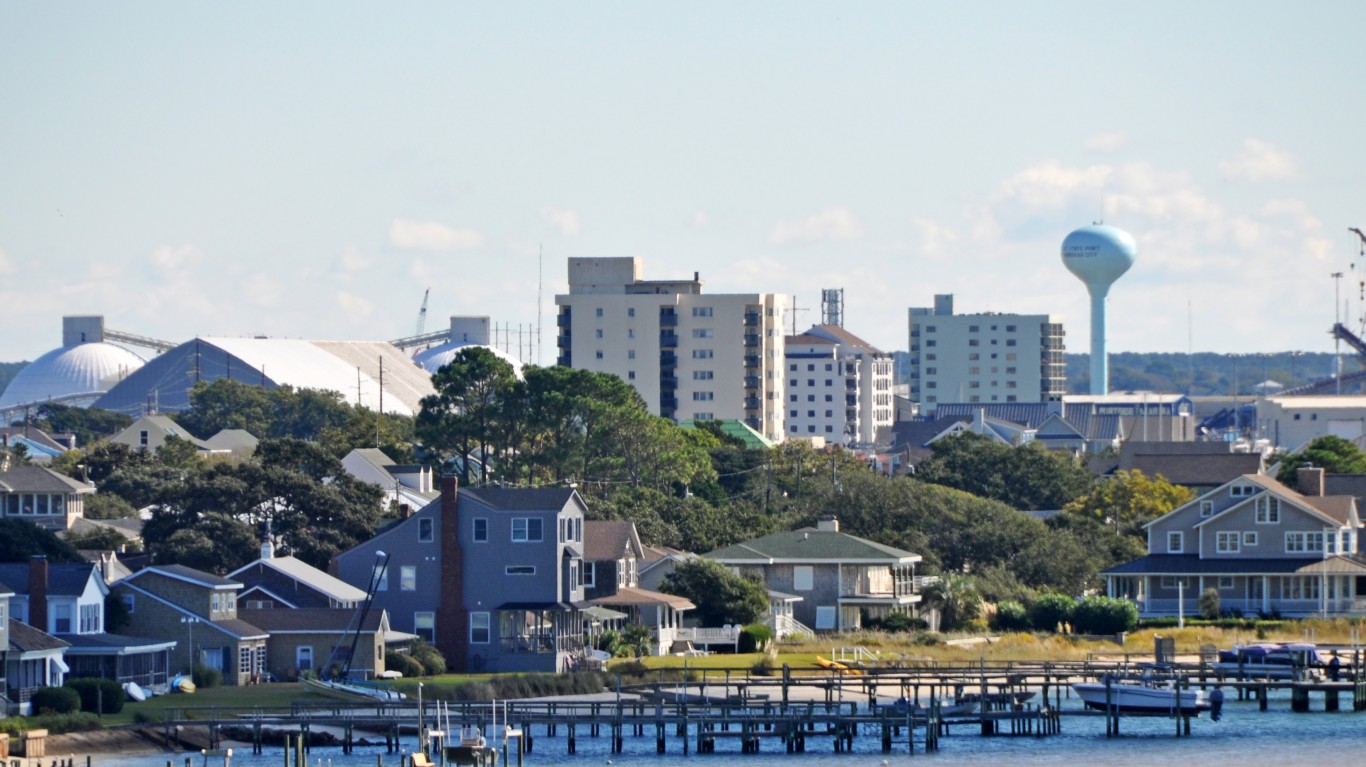
31. Morehead City, NC
> Restaurants per 100,000 residents: 151.7 (top 10%)
> Annual restaurant sales per capita: $1,146 (top 10%)
> Full-service to fast-food restaurant ratio: 1.7:1 (top 10%)
> Population: 68,537
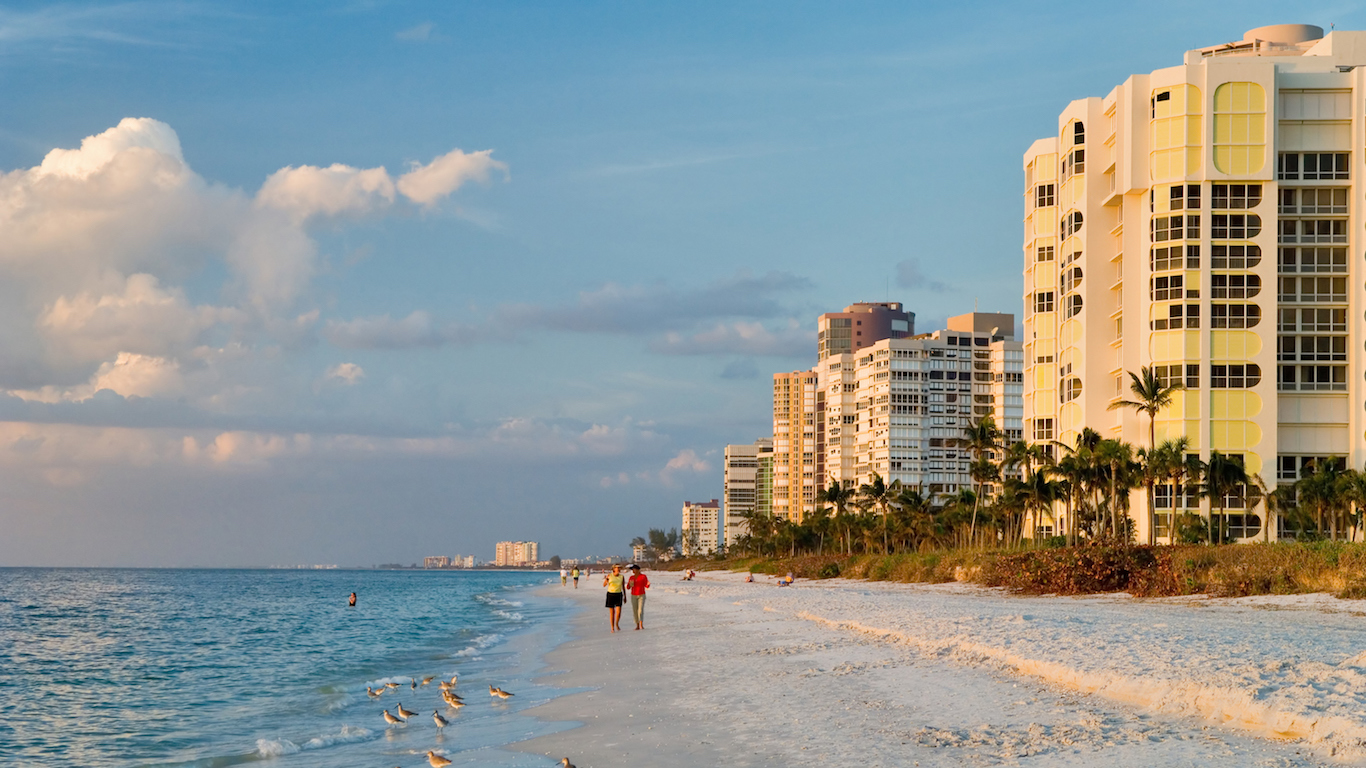
30. Naples-Immokalee-Marco Island, FL
> Restaurants per 100,000 residents: 123.2 (top 10%)
> Annual restaurant sales per capita: $1,430 (top 10%)
> Full-service to fast-food restaurant ratio: 2.2:1 (top 10%)
> Population: 348,236
[in-text-ad]

29. Atlantic City-Hammonton, NJ
> Restaurants per 100,000 residents: 118.2 (top 10%)
> Annual restaurant sales per capita: $1,479 (top 10%)
> Full-service to fast-food restaurant ratio: 1.6:1 (top 25%)
> Population: 274,026
[recirclink id=444046]

28. Pittsfield, MA
> Restaurants per 100,000 residents: 169.6 (top 10%)
> Annual restaurant sales per capita: $1,004 (top 10%)
> Full-service to fast-food restaurant ratio: 1.9:1 (top 10%)
> Population: 128,563

27. Napa, CA
> Restaurants per 100,000 residents: 106.5 (top 10%)
> Annual restaurant sales per capita: $1,600 (top 10%)
> Full-service to fast-food restaurant ratio: 1.8:1 (top 10%)
> Population: 140,823
[in-text-ad-2]
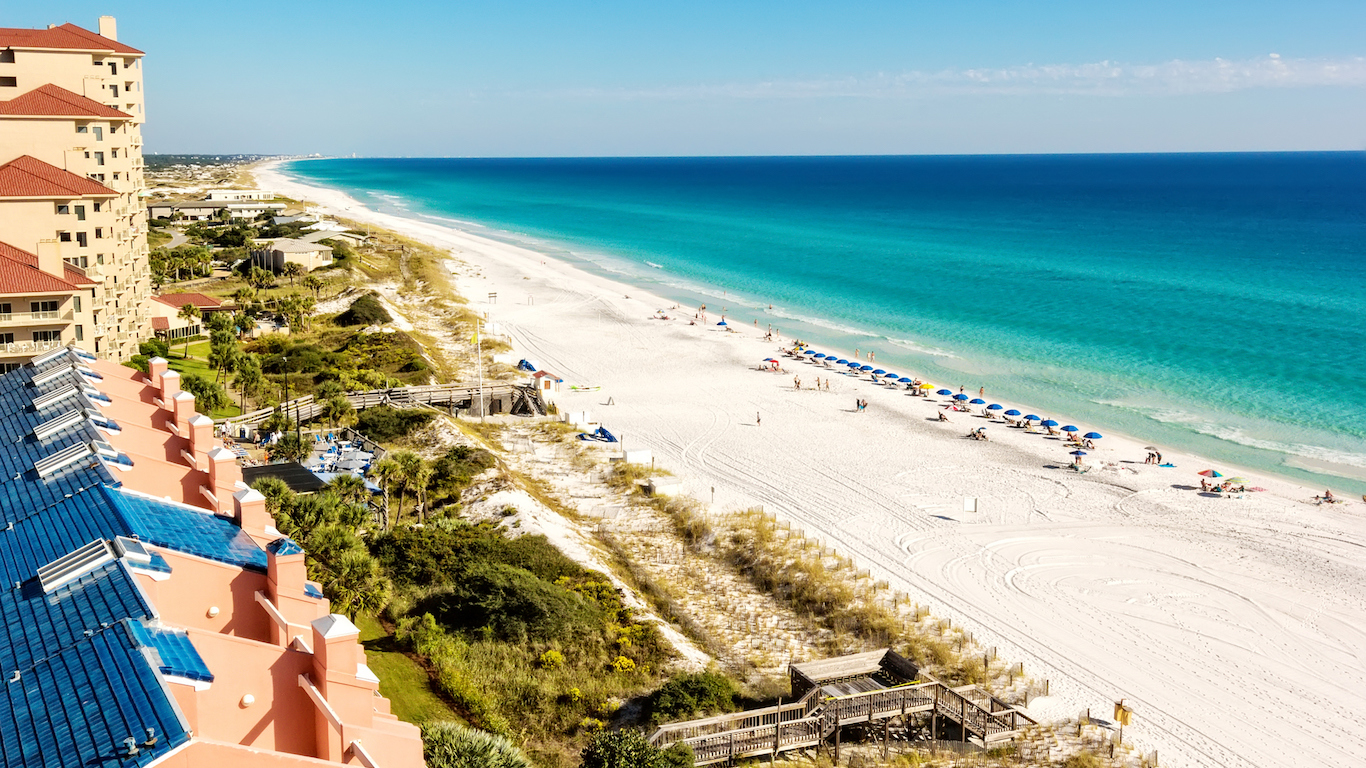
26. Crestview-Fort Walton Beach-Destin, FL
> Restaurants per 100,000 residents: 124.7 (top 10%)
> Annual restaurant sales per capita: $1,477 (top 10%)
> Full-service to fast-food restaurant ratio: 1.5:1 (top 25%)
> Population: 257,326

25. Easton, MD
> Restaurants per 100,000 residents: 143.4 (top 10%)
> Annual restaurant sales per capita: $1,354 (top 10%)
> Full-service to fast-food restaurant ratio: 1.4:1 (top 25%)
> Population: 37,668
[in-text-ad]

24. Boone, NC
> Restaurants per 100,000 residents: 155.5 (top 10%)
> Annual restaurant sales per capita: $1,246 (top 10%)
> Full-service to fast-food restaurant ratio: 2.0:1 (top 10%)
> Population: 52,745
[recirclink id=443940]
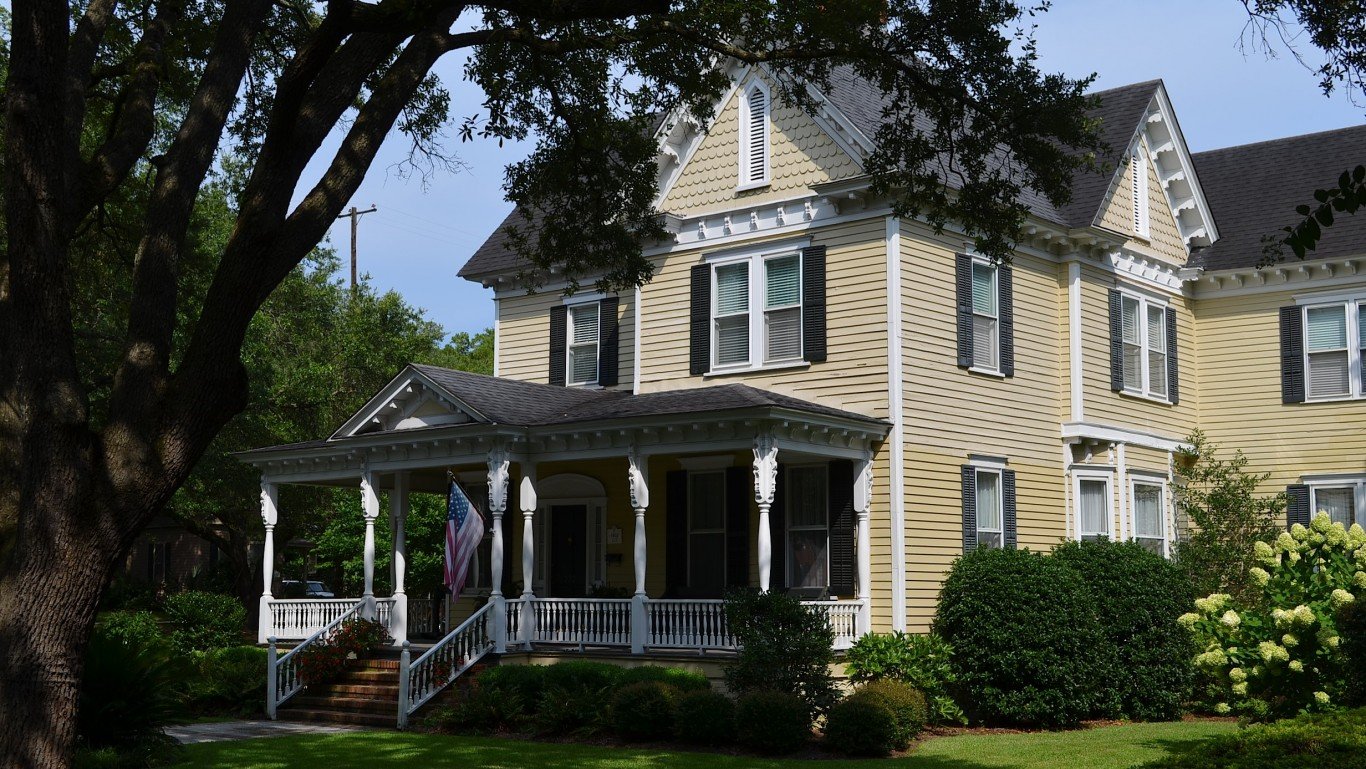
23. Georgetown, SC
> Restaurants per 100,000 residents: 148.0 (top 10%)
> Annual restaurant sales per capita: $1,317 (top 10%)
> Full-service to fast-food restaurant ratio: 2.1:1 (top 10%)
> Population: 60,804

22. Baraboo, WI
> Restaurants per 100,000 residents: 129.5 (top 10%)
> Annual restaurant sales per capita: $1,502 (top 10%)
> Full-service to fast-food restaurant ratio: 1.3:1 (top 25%)
> Population: 63,317
[in-text-ad-2]

21. Salisbury, MD-DE
> Restaurants per 100,000 residents: 136.6 (top 10%)
> Annual restaurant sales per capita: $1,495 (top 10%)
> Full-service to fast-food restaurant ratio: 1.6:1 (top 25%)
> Population: 390,091
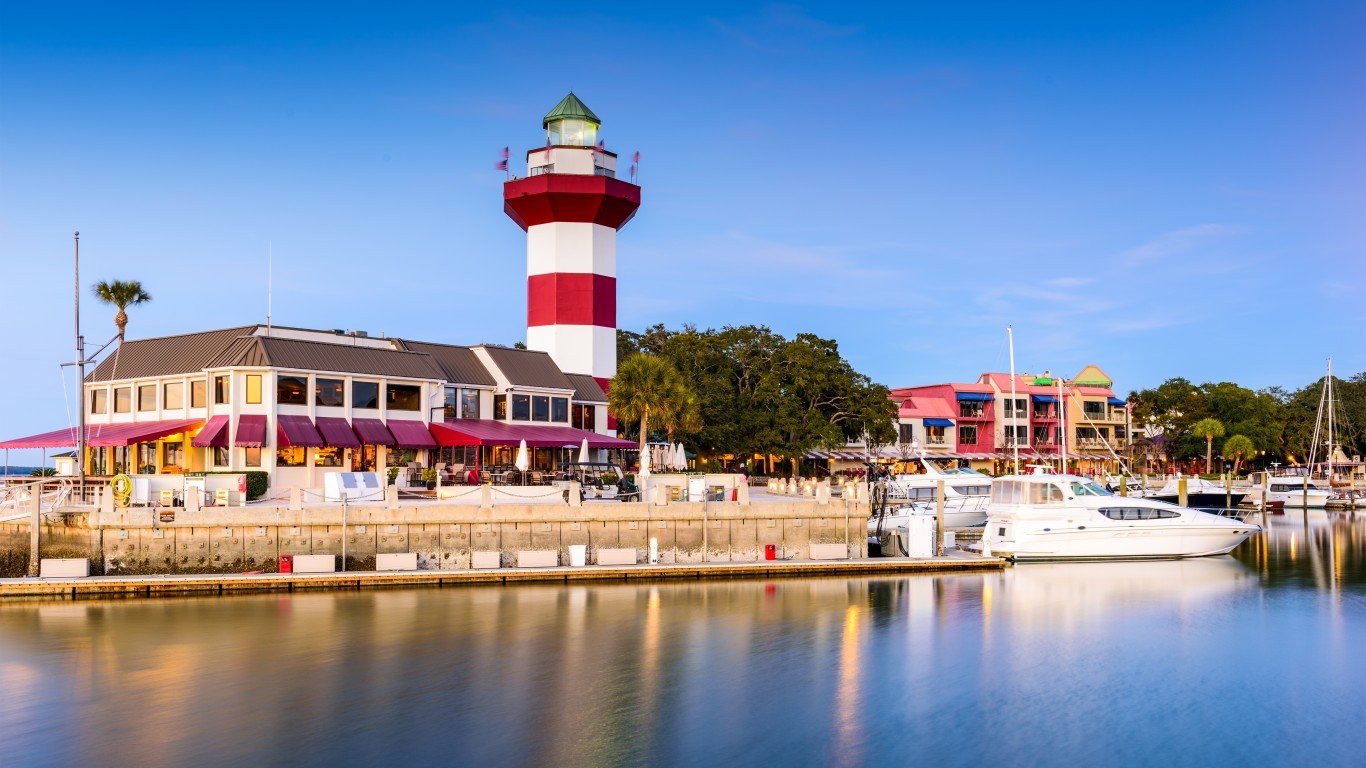
20. Hilton Head Island-Bluffton-Beaufort, SC
> Restaurants per 100,000 residents: 151.1 (top 10%)
> Annual restaurant sales per capita: $1,378 (top 10%)
> Full-service to fast-food restaurant ratio: 2.4:1 (top 10%)
> Population: 202,502
[in-text-ad]
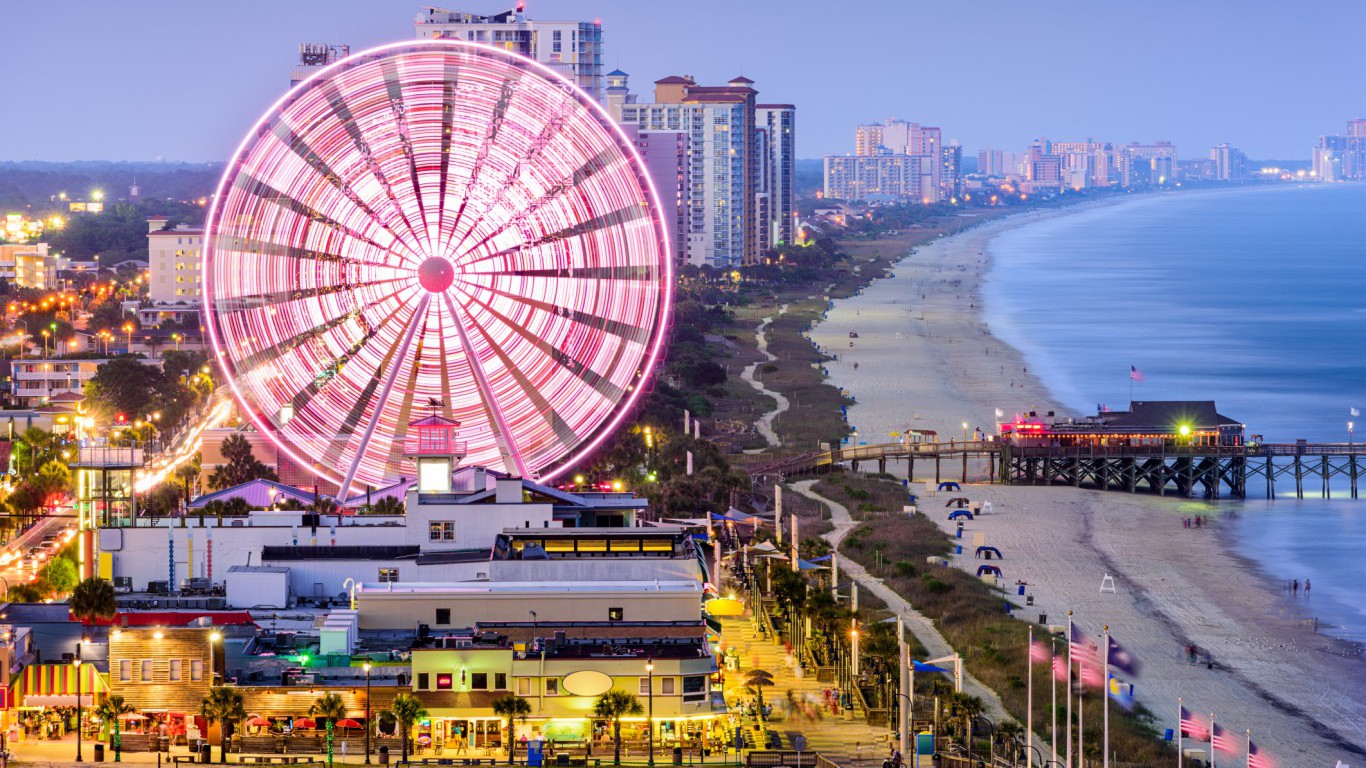
19. Myrtle Beach-Conway-North Myrtle Beach, SC-NC
> Restaurants per 100,000 residents: 159.2 (top 10%)
> Annual restaurant sales per capita: $1,429 (top 10%)
> Full-service to fast-food restaurant ratio: 1.6:1 (top 10%)
> Population: 419,585
[recirclink id=443564]

18. Kapaa, HI
> Restaurants per 100,000 residents: 142.0 (top 10%)
> Annual restaurant sales per capita: $1,887 (top 10%)
> Full-service to fast-food restaurant ratio: 1.3:1 (top 25%)
> Population: 70,447

17. Fredericksburg, TX
> Restaurants per 100,000 residents: 190.4 (top 10%)
> Annual restaurant sales per capita: $1,589 (top 10%)
> Full-service to fast-food restaurant ratio: 3.8:1 (top 10%)
> Population: 25,732
[in-text-ad-2]

16. Hailey, ID
> Restaurants per 100,000 residents: 231.2 (top 10%)
> Annual restaurant sales per capita: $1,219 (top 10%)
> Full-service to fast-food restaurant ratio: 2.1:1 (top 10%)
> Population: 27,687

15. Kahului-Wailuku-Lahaina, HI
> Restaurants per 100,000 residents: 113.2 (top 10%)
> Annual restaurant sales per capita: $2,514 (top 10%)
> Full-service to fast-food restaurant ratio: 1.4:1 (top 25%)
> Population: 162,547
[in-text-ad]

14. Newport, OR
> Restaurants per 100,000 residents: 218.5 (top 10%)
> Annual restaurant sales per capita: $1,569 (top 10%)
> Full-service to fast-food restaurant ratio: 3.0:1 (top 10%)
> Population: 46,685
[recirclink id=443882]

13. Barnstable Town, MA
> Restaurants per 100,000 residents: 202.1 (top 10%)
> Annual restaurant sales per capita: $1,962 (top 10%)
> Full-service to fast-food restaurant ratio: 2.0:1 (top 10%)
> Population: 214,703

12. Glenwood Springs, CO
> Restaurants per 100,000 residents: 213.2 (top 10%)
> Annual restaurant sales per capita: $1,886 (top 10%)
> Full-service to fast-food restaurant ratio: 2.2:1 (top 10%)
> Population: 75,038
[in-text-ad-2]

11. Sevierville, TN
> Restaurants per 100,000 residents: 162.9 (top 10%)
> Annual restaurant sales per capita: $2,611 (top 10%)
> Full-service to fast-food restaurant ratio: 1.4:1 (top 25%)
> Population: 94,537

10. Summit Park, UT
> Restaurants per 100,000 residents: 215.3 (top 10%)
> Annual restaurant sales per capita: $2,254 (top 10%)
> Full-service to fast-food restaurant ratio: 2.0:1 (top 10%)
> Population: 39,009
[in-text-ad]

9. Jackson, WY-ID
> Restaurants per 100,000 residents: 235.9 (top 10%)
> Annual restaurant sales per capita: $2,137 (top 10%)
> Full-service to fast-food restaurant ratio: 3.3:1 (top 10%)
> Population: 33,060
[recirclink id=443620]

8. Astoria, OR
> Restaurants per 100,000 residents: 265.5 (top 10%)
> Annual restaurant sales per capita: $1,948 (top 10%)
> Full-service to fast-food restaurant ratio: 2.7:1 (top 10%)
> Population: 37,660

7. Edwards, CO
> Restaurants per 100,000 residents: 242.0 (top 10%)
> Annual restaurant sales per capita: $2,732 (top 10%)
> Full-service to fast-food restaurant ratio: 2.7:1 (top 10%)
> Population: 52,894
[in-text-ad-2]

6. Steamboat Springs, CO
> Restaurants per 100,000 residents: 325.3 (top 10%)
> Annual restaurant sales per capita: $2,286 (top 10%)
> Full-service to fast-food restaurant ratio: 3.0:1 (top 10%)
> Population: 23,980
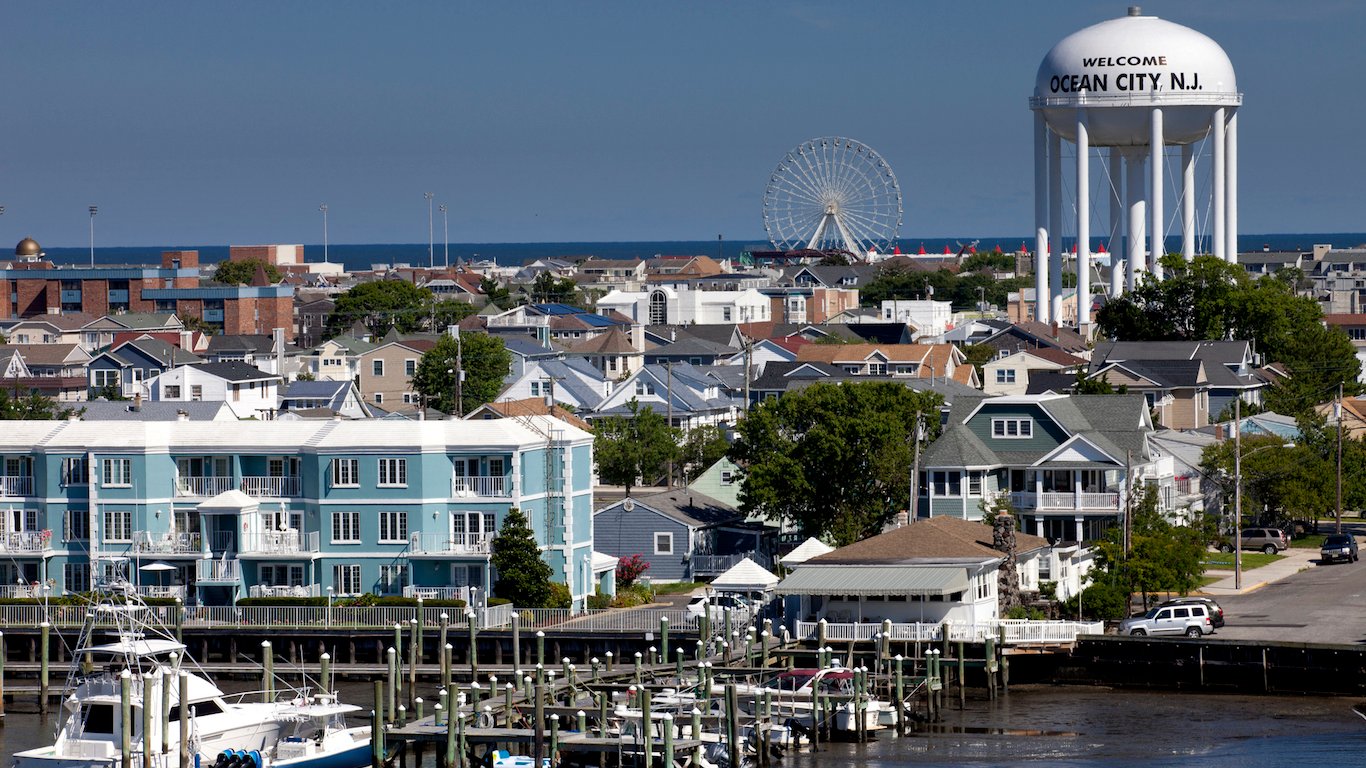
5. Ocean City, NJ
> Restaurants per 100,000 residents: 331.2 (top 10%)
> Annual restaurant sales per capita: $2,416 (top 10%)
> Full-service to fast-food restaurant ratio: 1.9:1 (top 10%)
> Population: 95,404
[in-text-ad]

4. Kill Devil Hills, NC
> Restaurants per 100,000 residents: 325.6 (top 10%)
> Annual restaurant sales per capita: $3,289 (top 10%)
> Full-service to fast-food restaurant ratio: 2.1:1 (top 10%)
> Population: 39,315
[recirclink id=443575]

3. Key West, FL
> Restaurants per 100,000 residents: 283.9 (top 10%)
> Annual restaurant sales per capita: $3,754 (top 10%)
> Full-service to fast-food restaurant ratio: 3.3:1 (top 10%)
> Population: 77,150
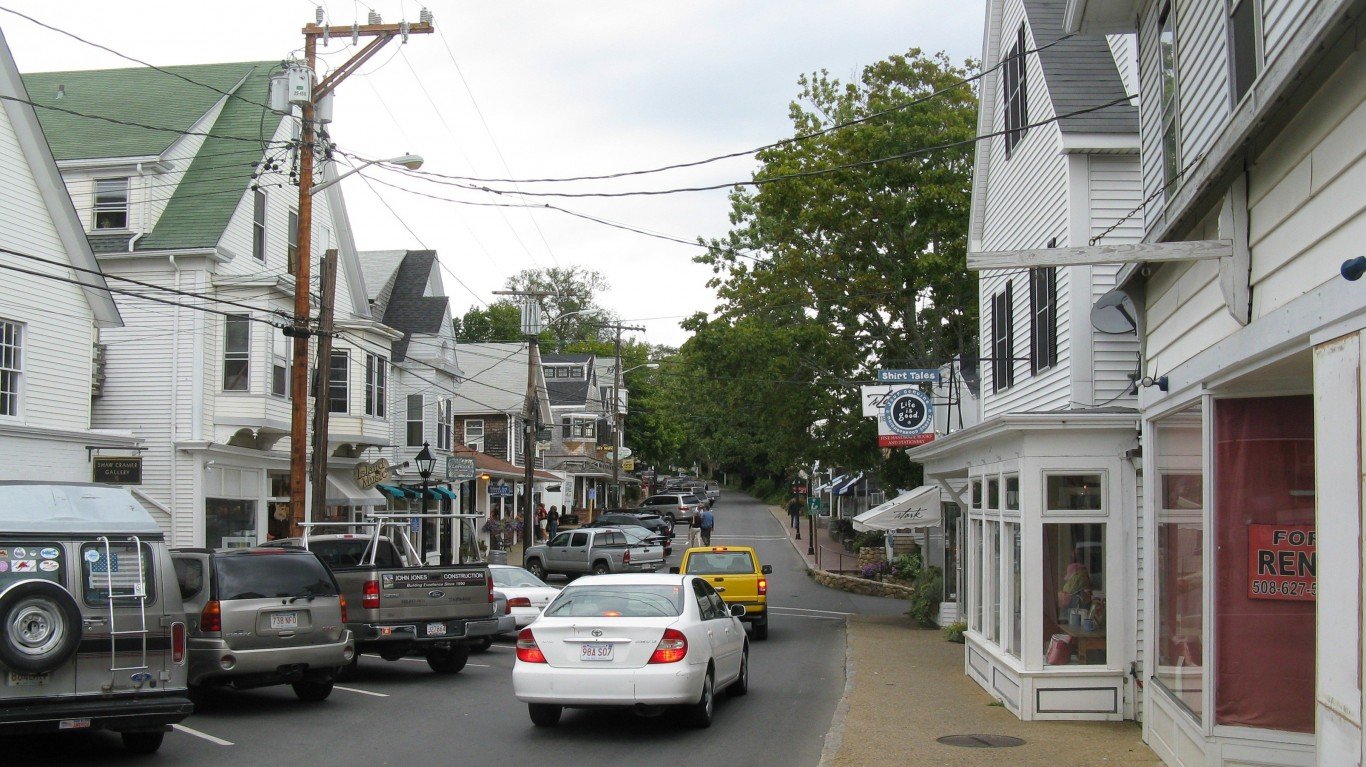
2. Vineyard Haven, MA
> Restaurants per 100,000 residents: 350.1 (top 10%)
> Annual restaurant sales per capita: $3,689 (top 10%)
> Full-service to fast-food restaurant ratio: 2.6:1 (top 10%)
> Population: 17,137
[in-text-ad-2]

1. Breckenridge, CO
> Restaurants per 100,000 residents: 410.0 (top 10%)
> Annual restaurant sales per capita: $3,505 (top 10%)
> Full-service to fast-food restaurant ratio: 2.6:1 (top 10%)
> Population: 29,269
Detailed Findings
Many of the cities where people spend the most on full-service restaurants are wealthy vacation destinations. According to the food service trade group National Restaurant Association, tourists generate approximately 30% of sales in the fine-dining sector. Cities such as Breckenridge, Colorado; Vineyard Haven, Massachusetts; and Key West, Florida are some of the most visited small cities in the country and have the highest restaurant spending per capita of any U.S. city.
Colorado contains six of the 50 top cities for going out to eat; Florida and Oregon are each home to four; and Massachusetts, North Carolina, South Carolina, and California each have three cities on this list.
The cost of fine-dining has increased significantly over the past several decades. While disposable income per capita in the United States has increased by approximately 50% in the last 30 years, the cost of a restaurant meal relative to a trip to the grocery store has more than doubled. As dining out becomes more expensive, fine-dining establishments may increasingly choose to locate in wealthy cities over less wealthy areas. In 27 of the 50 cities where people go out to eat the most, the typical household earns more than the national median household income of $55,322 a year.
While only one major metropolitan area with over 1 million residents — San Francisco — is in the top 50, large, dense cities tend to have the most restaurant sales per capita. Big cities tend to have more wealthy, single residents who are more likely to spend money at fine-dining establishments. Of the 31 metropolitan areas with more than 2 million residents, 26 generate more restaurant sales per capita than the national average of $704. Additionally, more than half of the 100 highest grossing restaurants are located in either New York City, Las Vegas, or Chicago.
Methodology
To determine the cities where people go out to eat all the time, 24/7 Wall St. created an index based on the number of restaurants and restaurant spending per capita across 917 metropolitan and micropolitan statistical areas. Data on the number of full-service restaurants in each city came from the U.S. Census Bureau’s 2016 County Business Patterns and was included in the index at full weight. Data on restaurant sales came from the Census Bureau’s 2012 Economic Census and was adjusted for population using data from the 2016 American Community Survey. This was also included in the index at full weight. Data on limited-service restaurants, or fast-food, also came from 2016 County Business Patterns.
Contact [email protected] for any questions or corrections.