Since 2010, the population of the United States has increased by 5.5%. Nearly half of that population growth was due to international immigration. Of the net 7.2 million new residents to come to America in the last eight years, 3.5 million settled in just 10 metropolitan areas.
Immigrants move to large U.S. cities for a number of reasons: job opportunities, ease of entry, and the presence of existing immigrant communities from their home country. While historically the largest metropolitan areas on each coast — New York and Los Angeles — have attracted the most international immigrants, there are a number of cities throughout the United States with highly diverse populations.
To determine America’s melting pot cities, 24/7 Wall St. ranked metro areas based on the likelihood that two residents picked at random would be from two different world regions: the United States, Europe, Asia, Africa, Oceania, Latin America, and other parts of North America.
In an interview with 24/7 Wall St., Andre Perry, fellow at the Brookings Institution’s Metropolitan Policy Program, said, “Where there are strong anchors for immigrant groups, social relatives will go there. If you have a strong Guatemalan community, for instance, in New Orleans, you’ll see more people from Guatemala come to New Orleans.” In many cities with the highest levels of diversity, the flow of immigrants today mirrors historical migration patterns consistent throughout the 19th and 20th centuries. Many of these cities have acted as melting pots for new immigrants for decades.
The demographic composition of many Californian cities with large Hispanic populations were shaped by the agriculture industry. According to Perry, “The number one reason people immigrate is jobs.” California has a relatively favorable agricultural climate that allows a rich variety of crops to flourish throughout the state, and grows more than one-third of the country’s vegetables and over two-thirds of its fruits and nuts. The state’s massive agriculture sector provides significant opportunities for Mexican immigrants, many of whom came to the United States to fill labor shortages during World War II under the Bracero Program. Today, California is home to 10 of the 20 cities with the most diversity.
Geography also plays a major role in diversity. Just as New York and Los Angeles were the primary destinations for immigrants crossing the Atlantic and Pacific Oceans by boat in the 19th and 20th century, towns along the U.S.-Mexico border are the destination for many new residents crossing into the country from Latin America. Five of the 20 cities on this list are located along the U.S.-Mexico border: El Paso, Laredo, and McAllen, Texas; El Centro, California; and Yuma, Arizona.
To determine America’s melting pot cities, 24/7 Wall St. ranked metro areas based on the likelihood that two residents picked at random would be from two different world regions: the United States, Europe, Asia, Africa, Oceania, Latin America, and other parts of North America. The measure refers to the birthplace of the current residents. The index is based on the share of residents of a specific national origin with data from the U.S. Census Bureau’s 2016 American Community Survey and is the sum total of the individual probabilities that two residents will not share a national origin. The same method is used in the USA Today Diversity Index. Supplemental data on race, ancestry, income, poverty, and population also came from the Census Bureau. Data on unemployment came from the Bureau of Labor Statistics.
Click here to see America’s melting pot cities.
Correction: Due to a data processing error, a previous version of this article incorrectly listed the origin of the largest immigrant groups for the metropolitan areas in this piece. This error has been corrected.

20. Napa, CA
> Pct. born abroad: 22.5%
> Pct. of foreign-born gained citizenship: 48.7%
> Origin of largest immigrant group: Mexico (60.9% of foreign-born pop.)
> Population increase due to international immigration, 2010-17: +1.7%
The Napa region of California is one of the most diverse in the country — and one of many Californian metro areas with high levels of diversity. In Napa County, just 77.5% of the population was born in the United States, compared to 86.5% of the nation’s population. The largest immigrant group in the area is from Mexico. Of the area’s approximately 142,000 residents, 14% were born in Mexico.
In the nation’s most diverse metropolitan areas, incomes are generally either among the lowest or among the highest. In the case of Napa, it is the latter. The metro area’s median household income of $74,077 a year is well above the national median household income of $57,617.
[in-text-ad]
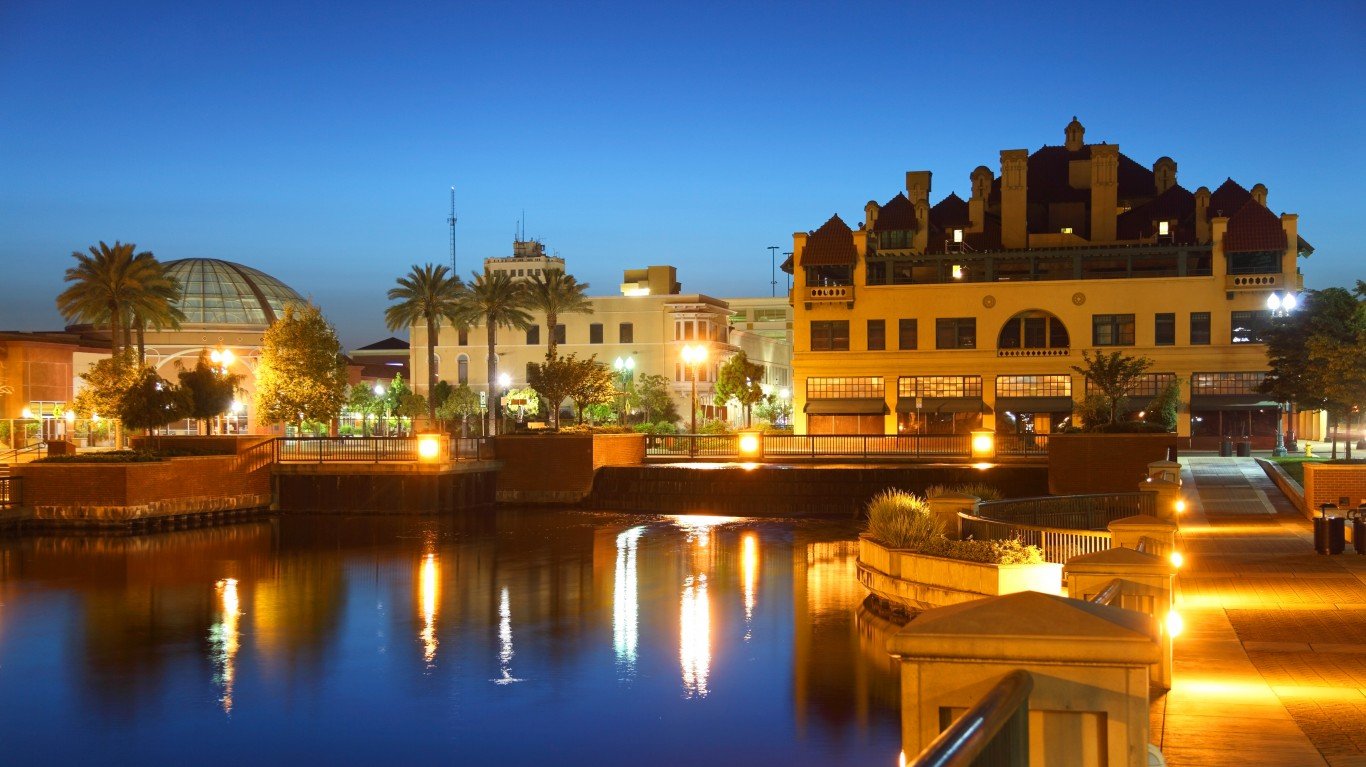
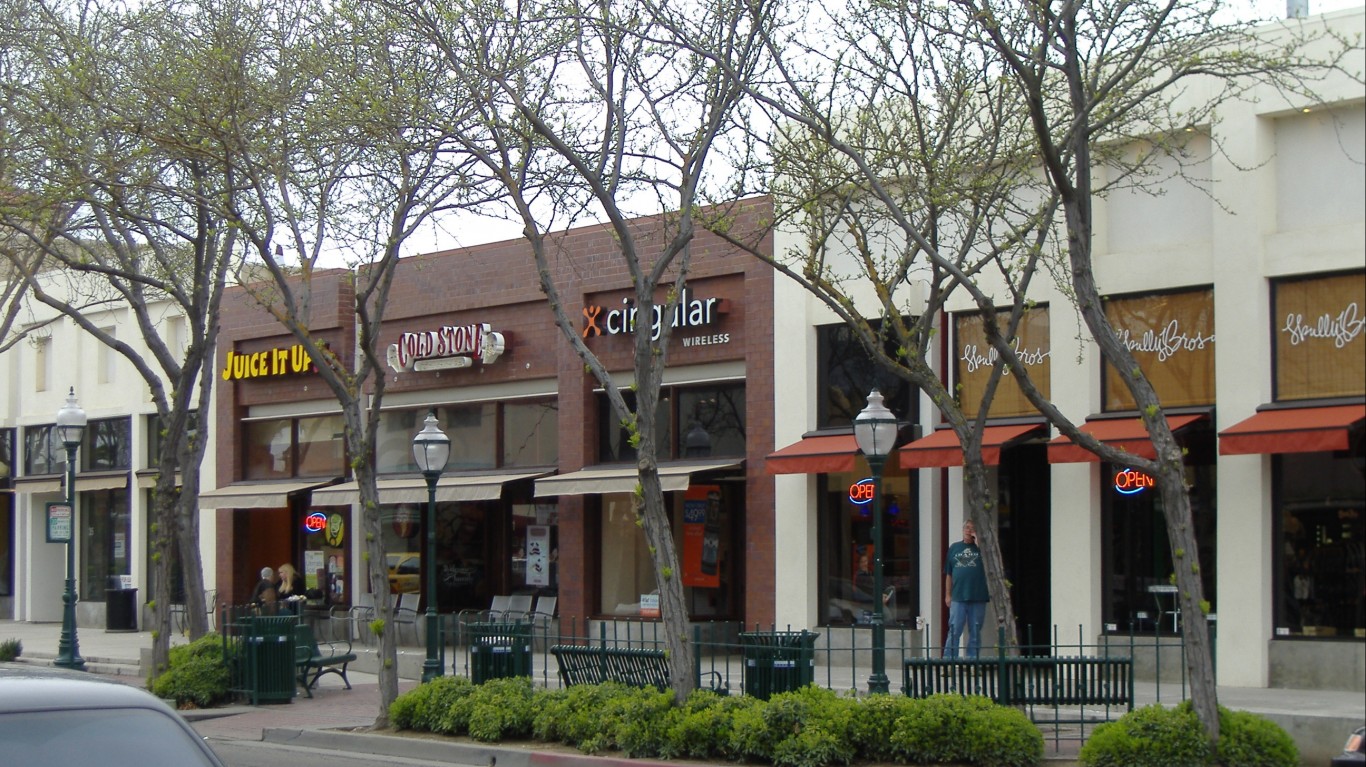
19. Stockton-Lodi, CA
> Pct. born abroad: 22.6%
> Pct. of foreign-born gained citizenship: 46.2%
> Origin of largest immigrant group: Mexico (49.0% of foreign-born pop.)
> Population increase due to international immigration, 2010-17: +1.7%
In the Stockton-Lodi metro area, there is a 37.8% chance that two residents picked at random will be from different countries, the highest diversity of nearly any city. There have been several major waves of immigration to the city. Many Chinese, Japanese, Filipino, and Mexican immigrants came to Stockton during the construction of the Transcontinental Railroad in the 1920s.
When the Immigration Act of 1924 limited the number of immigrants allowed in the country and created labor shortages in Stockton, residents of the Philippines — which was a U.S. territory at the time and exempt from the legislation — filled the job gap. Today, Asian Americans constitute some 14.5% of Stockton’s population, the seventh largest share in the country. Some 40.5% off the population identifies as Hispanic or Latino, more than twice the 17.3% national share.
[recirclink id=488456]

18. Las Vegas-Henderson-Paradise, NV
> Pct. born abroad: 22.8%
> Pct. of foreign-born gained citizenship: 48.0%
> Origin of largest immigrant group: Mexico (39.4% of foreign-born pop.)
> Population increase due to international immigration, 2010-17: +2.4%
Las Vegas has some of the greatest diversity of any city today. Some 1.6% of the population was born in Europe, 7.4% in Asia, 0.8% in Africa, 0.1% in Oceania, and 12.6% in Latin America — each among the largest shares of any city. While nationwide there is a 25.1% chance that any two residents picked at random would be from different countries, in Las Vegas the chance is 39.5%. The diversity is likely due in part to the city’s rapid population growth.
The population of Las Vegas has nearly tripled over the past several decades, increasing from 756,170 in 1990 to 2.2 million today. The 191.5% increase was the fastest growth of any city other than St. George, Utah and The Villages, Florida.
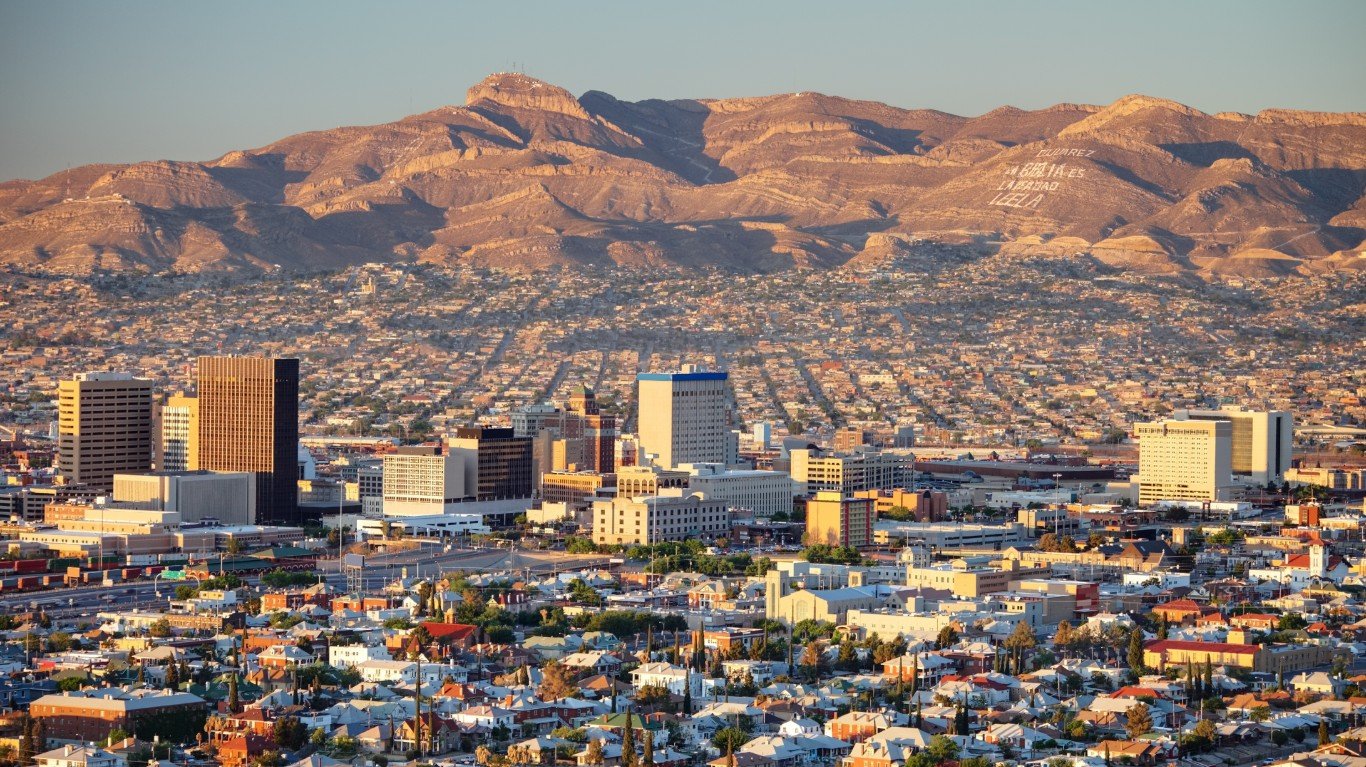
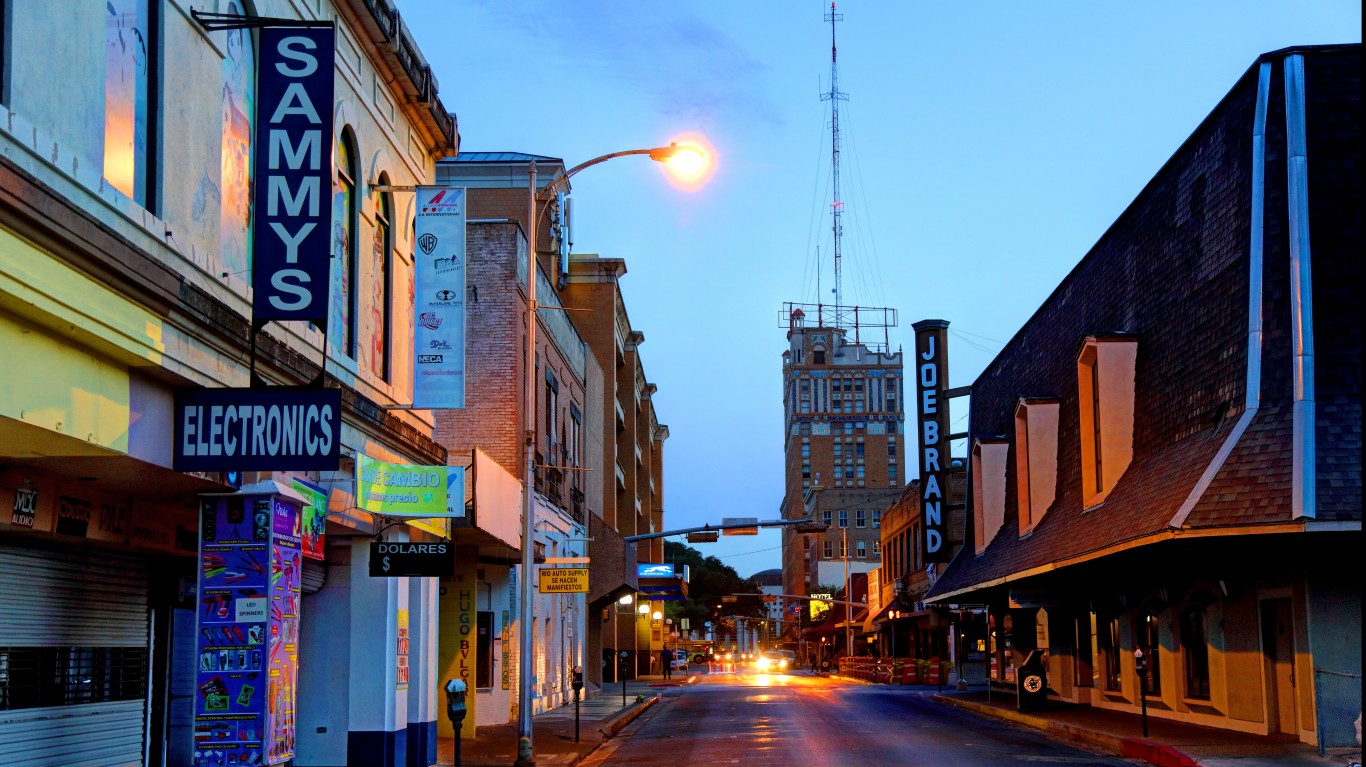
17. El Paso, TX
> Pct. born abroad: 25.1%
> Pct. of foreign-born gained citizenship: 43.6%
> Origin of largest immigrant group: Mexico (90.5% of foreign-born pop.)
> Population increase due to international immigration, 2010-17: +2.6%
Located on the U.S.-Mexico border, El Paso has attracted a significant Hispanic population through a number of major immigration waves. The first wave was during a population boom following the Civil War, when the population of El Paso increased more than tenfold from 736 in 1880 to 10,338 in 1890. Another wave of growth occurred during the Mexican Revolution as thousands of refugees fled from Mexico to the Texas boomtown between 1910 and 1920. When men went to fight during World War II, this created labor shortages throughout the country. To fill the labor void, the Bracero Program allowed Mexican men to come work in the United States, and El Paso was one of the main destinations for Mexican farm workers.
Today, 81.8% of the El Paso metro area’s population claim Hispanic or Latino ancestry, the fifth largest share of any U.S. city. Some 22.8% of the population was born in Mexico, the sixth largest share.
[in-text-ad-2]
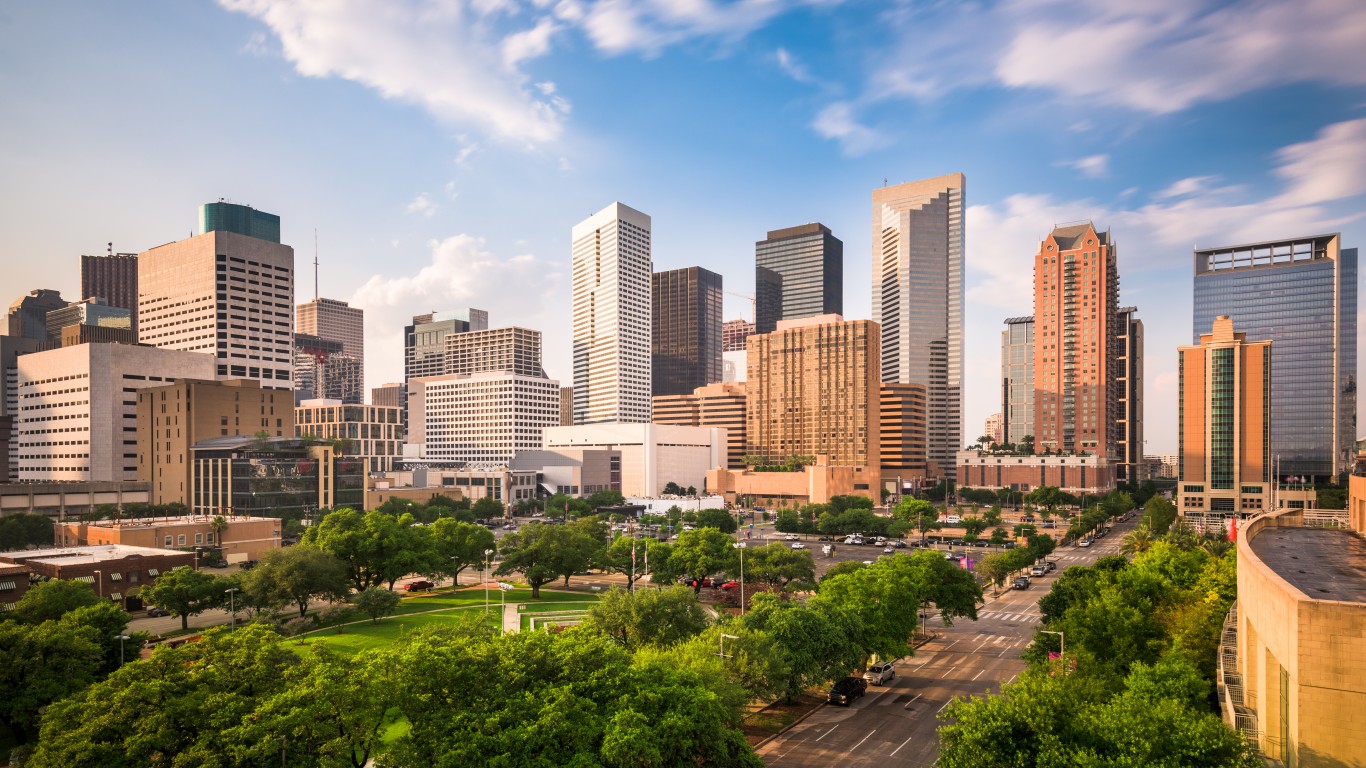
16. Houston-The Woodlands-Sugar Land, TX
> Pct. born abroad: 23.5%
> Pct. of foreign-born gained citizenship: 38.6%
> Origin of largest immigrant group: Mexico (41.9% of foreign-born pop.)
> Population increase due to international immigration, 2010-17: +4.4%
Being so close to the border with Mexico, Houston unsurprisingly has a substantial Hispanic population — 36.3% of metro area’s residents are of Hispanic origin, more than double the national concentration of 17.3%, and a large share are foreign-born. About 15% of Houston’s population was born in Latin America. However, the metro area is not just diverse because of its Hispanic residents. Around 6% of the area’s population was born Asia, compared to 4.2% of American residents nationwide.

15. Washington-Arlington-Alexandria, DC-VA-MD-WV
> Pct. born abroad: 23.0%
> Pct. of foreign-born gained citizenship: 50.4%
> Origin of largest immigrant group: El Salvador (13.7% of foreign-born pop.)
> Population increase due to international immigration, 2010-17: +5.4%
The home of approximately 200 foreign embassies, diplomatic missions, and international organizations, Washington, D.C. is one of the most ethnically diverse metro areas in the country. Some 3.5% of the population was born in Africa, and 8.4% in Asia — the largest and 11th largest shares of any U.S. city, respectively. Additionally, one-fourth of the population identifies as African American, more than twice the national proportion. Diversity has increased in recent years in part due to an influx of Hispanic residents. El Salvadorians now comprise 13.7% of the D.C. foreign-born population, the largest share nationwide.
[in-text-ad]
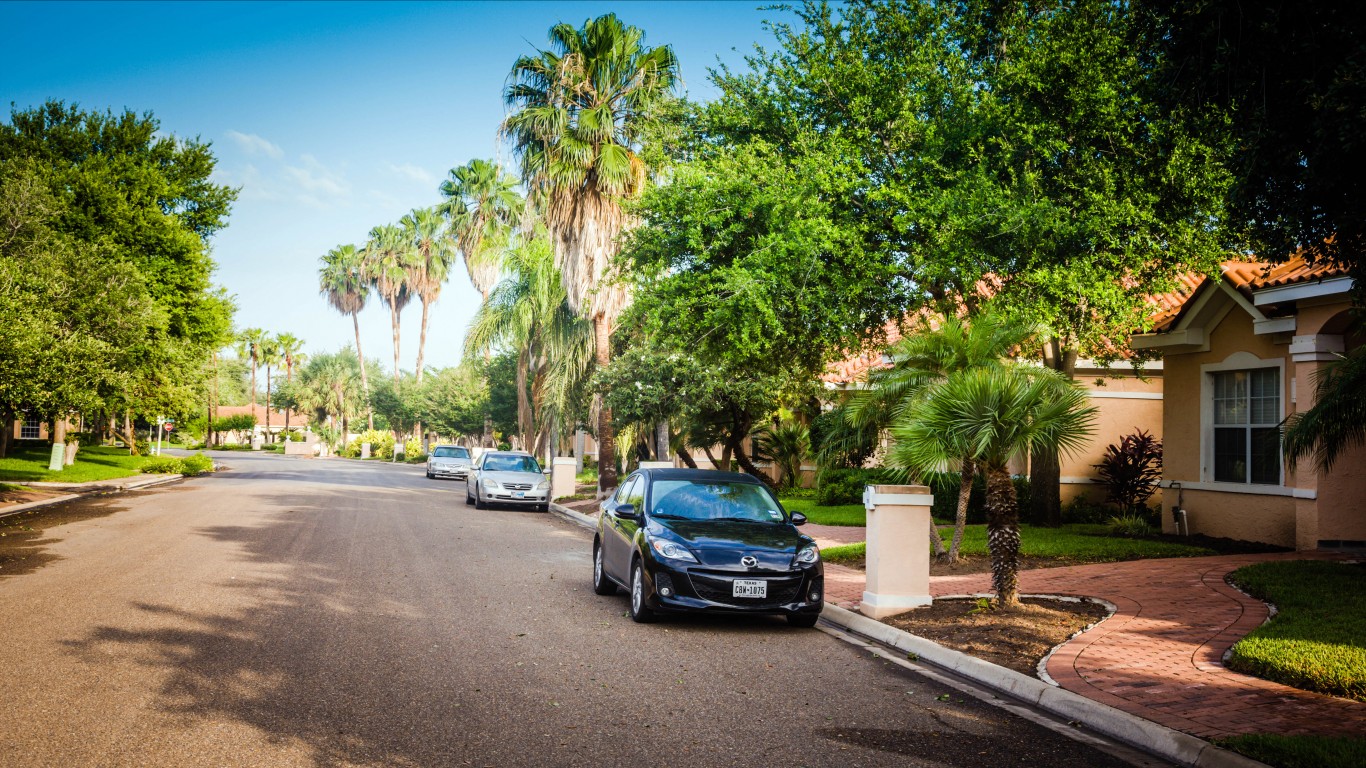
14. McAllen-Edinburg-Mission, TX
> Pct. born abroad: 26.7%
> Pct. of foreign-born gained citizenship: 28.4%
> Origin of largest immigrant group: Mexico (93.3% of foreign-born pop.)
> Population increase due to international immigration, 2010-17: +2.0%
The McAllen, Texas metropolitan area is on the state’s border with Mexico, on one of the busiest segments of the U.S.-Mexico border. McAllen is as close to a multinational city as any in the United States — over 90% of the city’s population is of Hispanic origin, and many of the public street signs are in both Spanish and English. McAllen is home to a substantial shopping complex for Mexican tourists, and the city also spends to recruit businesses from other parts of the world, including Asian nations like Japan and Korea. About 1% of the metro area’s population was born in Asia.
[recirclink id=488594]

13. Santa Maria-Santa Barbara, CA
> Pct. born abroad: 24.6%
> Pct. of foreign-born gained citizenship: 31.7%
> Origin of largest immigrant group: Mexico (67.8% of foreign-born pop.)
> Population increase due to international immigration, 2010-17: +2.5%
The Santa Maria-Santa Barbara metro area is located in Southern California roughly six hours from the U.S.-Mexico border. The Santa Maria Valley is a leading producer of agricultural goods in California — with primary crops including broccoli, strawberry, lettuce, cauliflower, wine grapes, and celery. The area has attracted a large number of migrant farmworkers. Some 16.7% of Santa Maria residents today were born in Mexico, more than four times the 3.7% national share and the 11th largest Mexico-born population of any metro area. There is a 40.3% chance that any two Santa Maria residents picked at random would be from different countries, far more than the national diversity probability of 25.3%.
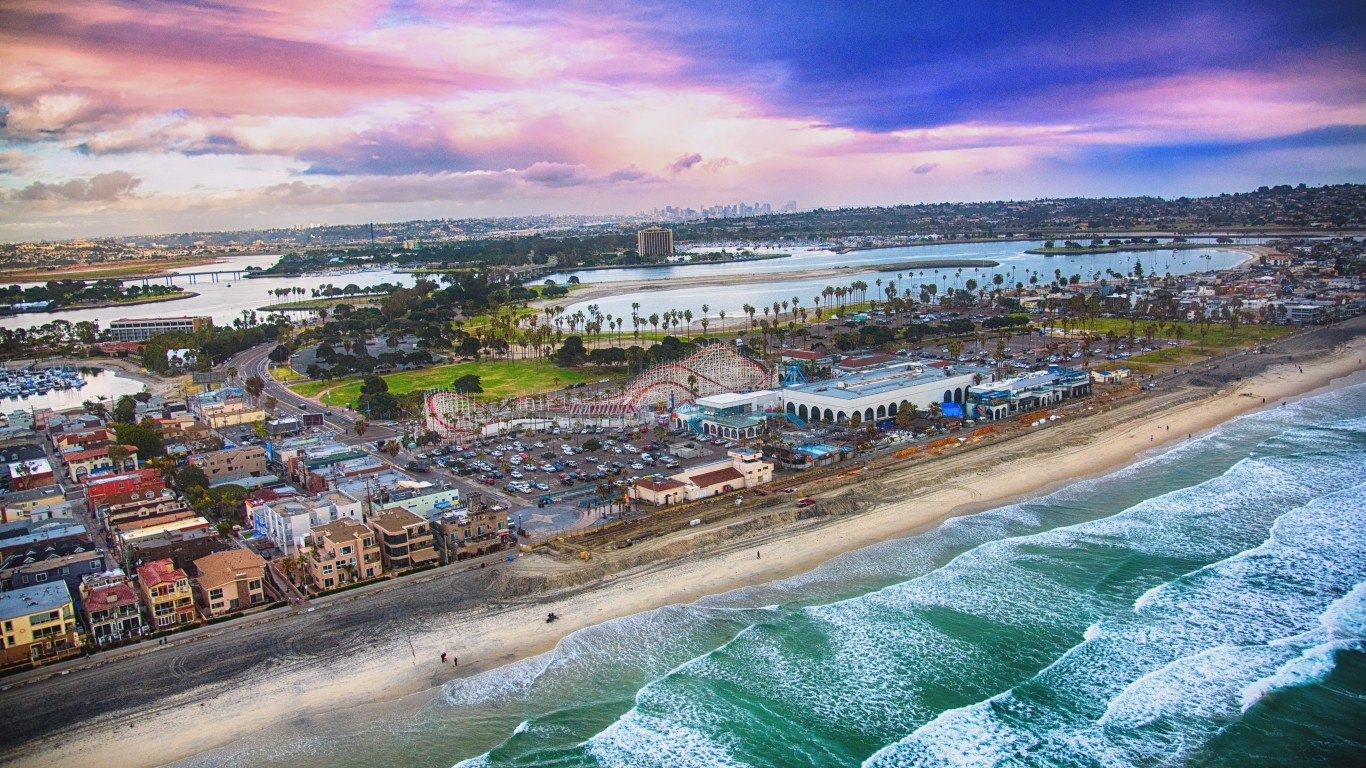
12. San Diego-Carlsbad, CA
> Pct. born abroad: 24.1%
> Pct. of foreign-born gained citizenship: 51.7%
> Origin of largest immigrant group: Mexico (44.4% of foreign-born pop.)
> Population increase due to international immigration, 2010-17: +3.6%
Almost one-fourth of San Diego’s population was born in another country, the fifteenth largest share among U.S. metropolitan areas. While Latin America, which includes South and Central America, accounts for the largest share of foreign-born metro area residents, San Diego also has above average shares of residents from Europe, Asia, and Oceania.
Like many of America’s melting pot cities, San Diego’s population is growing relatively quickly. It grew by over 30% every decade from 1970 through 2010, much of it due to international migration.
[in-text-ad-2]
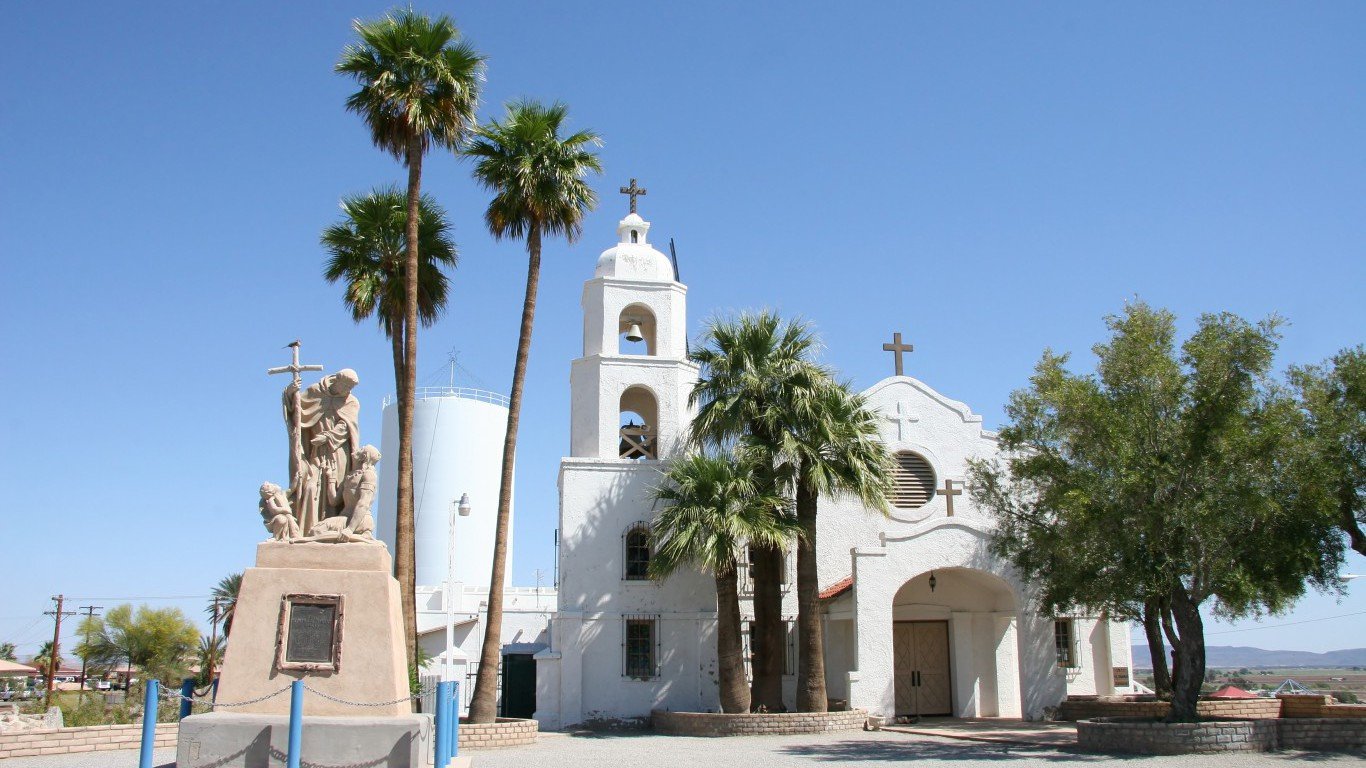
11. Yuma, AZ
> Pct. born abroad: 26.8%
> Pct. of foreign-born gained citizenship: 46.2%
> Origin of largest immigrant group: Mexico (85.2% of foreign-born pop.)
> Population increase due to international immigration, 2010-17: +2.4%
Of the Yuma, Arizona metropolitan area’s 205,631 people, 62.0% identify as Hispanic or Latino, the eighth largest share of any city.
While many of the country’s melting pot cities have low unemployment, Yuma has one of the highest unemployment rates of any city. The unemployment rate has been at least double the U.S. rate for the last three decades. Currently the city’s jobless rate is 17.2% — nearly four times the 4.4% national figure and the second highest of any metro area.
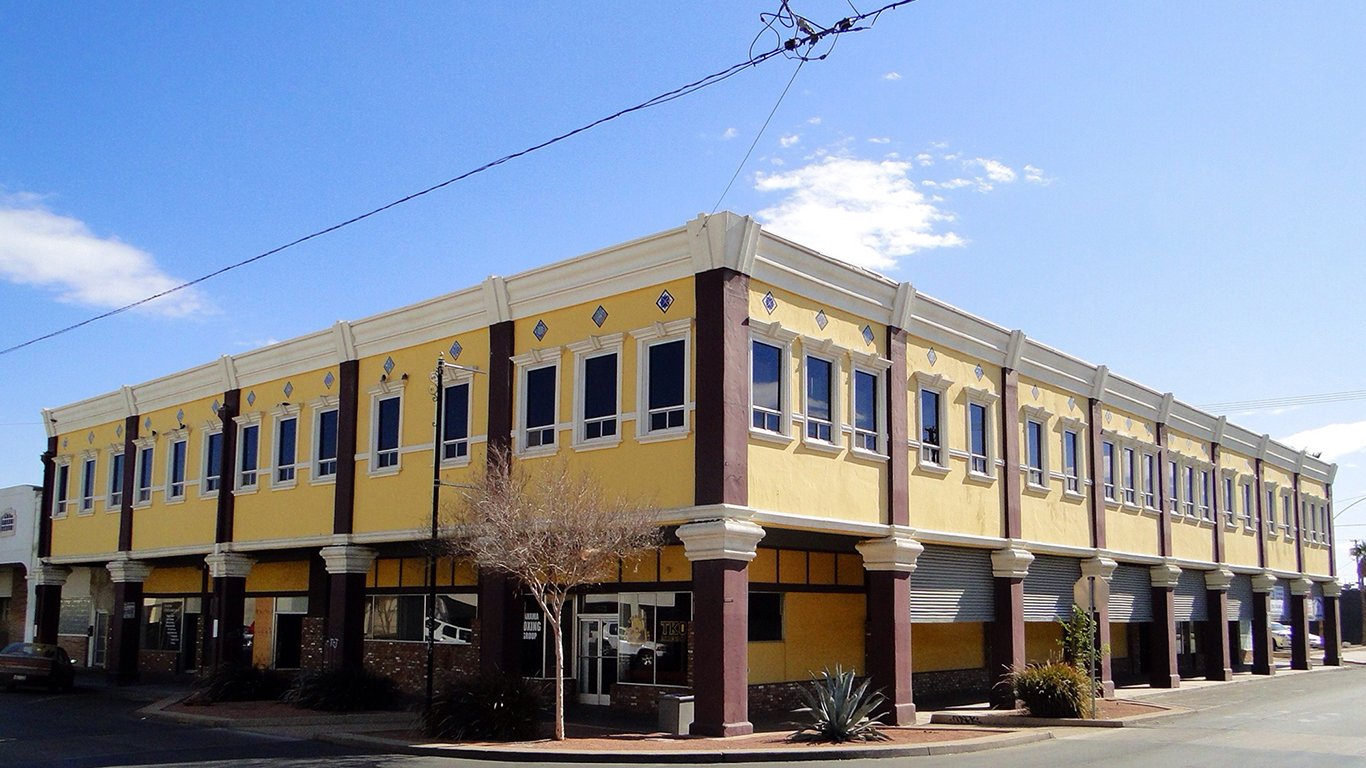
10. Laredo, TX
> Pct. born abroad: 28.3%
> Pct. of foreign-born gained citizenship: 26.6%
> Origin of largest immigrant group: Mexico (94.8% of foreign-born pop.)
> Population increase due to international immigration, 2010-17: +2.8%
The nation’s melting pot metropolitan areas are, generally, either the most affluent in the country or the poorest. Laredo falls squarely into the latter category. Just under one-third of the population lives at or below the poverty line, the highest poverty rate of any U.S. metropolitan area. And almost half of impoverished households have incomes of $10,000 or less a year.
Located along the U.S.-Mexico border, Laredo has the second largest share of Mexican-born residents of any metro area. Some 26.8% of Laredo residents were born in Mexico, more than seven times the 3.7% national figure. Many Mexican immigrants lack a high school diploma, which limits their job opportunities — one reason for the area’s high poverty. Just 67.0% of Laredo’s adults have a high school diploma, the second smallest share in the country.
[in-text-ad]
9. Merced, CA
> Pct. born abroad: 26.4%
> Pct. of foreign-born gained citizenship: 40.3%
> Origin of largest immigrant group: Mexico (72.0% of foreign-born pop.)
> Population increase due to international immigration, 2010-17: +0.9%
Like many cities in the San Joaquin Valley, Merced has attracted large numbers of Hispanic farmworkers to its agriculture industry — the fifth largest in California — over the past several decades. Some 57.5% of the Merced population today is of Hispanic or Latino descent, the 11th largest share of any city.
One factor that contributes to the high level of diversity in Merced is the city’s large Hmong population. The Hmong first began to settle in Merced in the 1970s after the Laotian Civil War, fleeing communist persecution. Hmong immigrants comprised approximately one-fifth of the Merced population by 1997, and they continued to flock to the city in large numbers. While the Hmong population has thinned out in recent years, Merced is home to the fourth largest share of Laos- and Thailand-born residents of any metro area.
[recirclink id=488561]

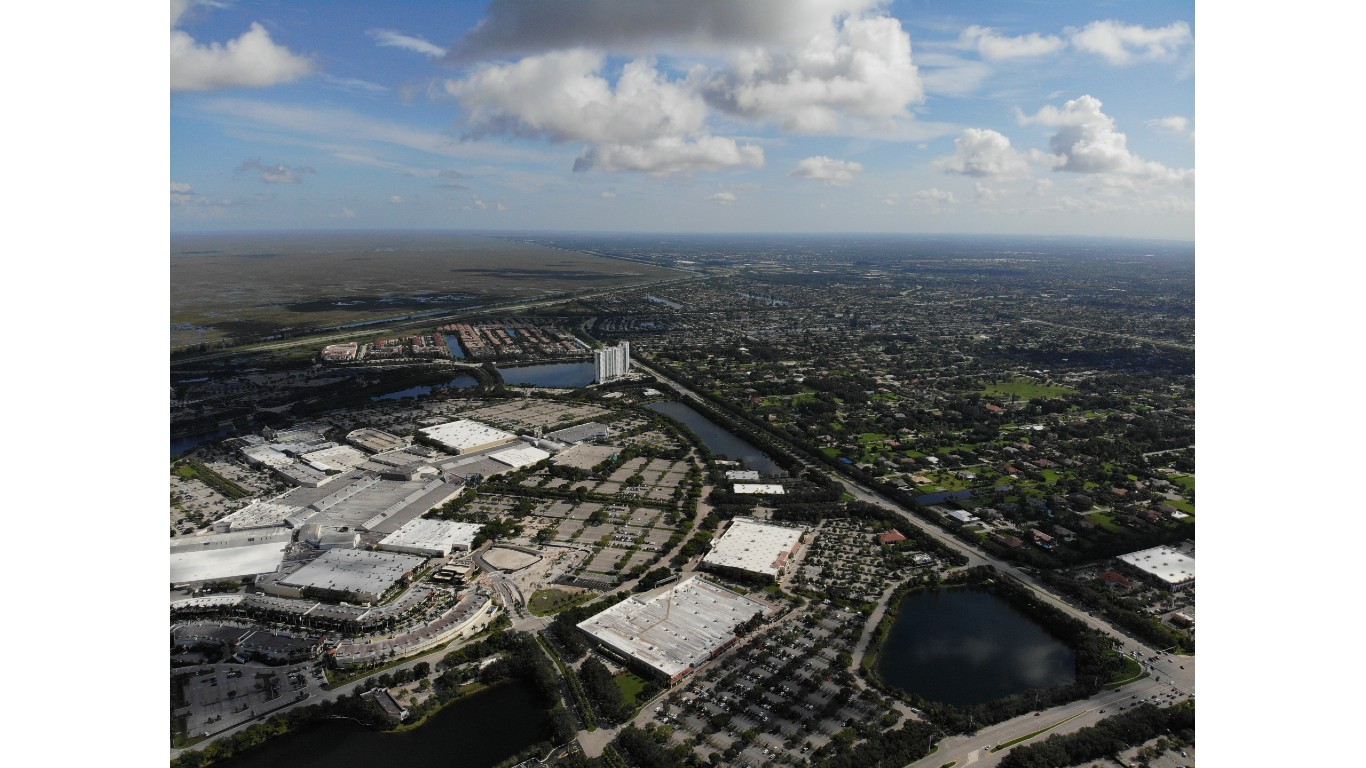
8. Naples-Immokalee-Marco Island, FL
> Pct. born abroad: 27.0%
> Pct. of foreign-born gained citizenship: 45.1%
> Origin of largest immigrant group: Mexico (21.9% of foreign-born pop.)
> Population increase due to international immigration, 2010-17: +5.1%
Unlike many of the melting pot metropolitan areas on this list, Naples has a relatively large white population — 64.2% of the population identifies as white, slightly larger than the national share of 62.0%. However, many of these white residents are not native born. Of the metro area’s 365,000 residents, about 5% were born in Europe, the largest share of any metro area. Also, about one in five Naples residents were born in Latin American countries.
Naples, like many of the nation’s melting pot metro areas, is also one of the fastest growing. The population increased more than sevenfold from 1970 to 2010, much of it due to international migration.
7. El Centro, CA
> Pct. born abroad: 29.9%
> Pct. of foreign-born gained citizenship: 51.0%
> Origin of largest immigrant group: Mexico (92.4% of foreign-born pop.)
> Population increase due to international immigration, 2010-17: +1.7%
Located on the U.S.-Mexico border, El Centro has one of the largest Mexican populations of any U.S. metro area. Many Hispanic workers immigrated to El Centro to work in the nearby Imperial Valley agriculture industry, which is one of the largest producers of spinach, potatoes, cauliflower, broccoli, and onions in California. Some 27.6% of El Centro residents today were born in Mexico, the largest share of any metro area.
El Centro’s workforce may be even more diverse than the city’s population. During the peak harvest season, tens of thousands of farmworkers commute from the Mexican city of Mexicali to agriculture jobs in Imperial Valley. The cross-border commuters may also partially explain the conflicting reports of labor shortages and high unemployment in El Centro. The metro area’s unemployment rate is reported as 19.1%, the highest of any city.
[in-text-ad-2]
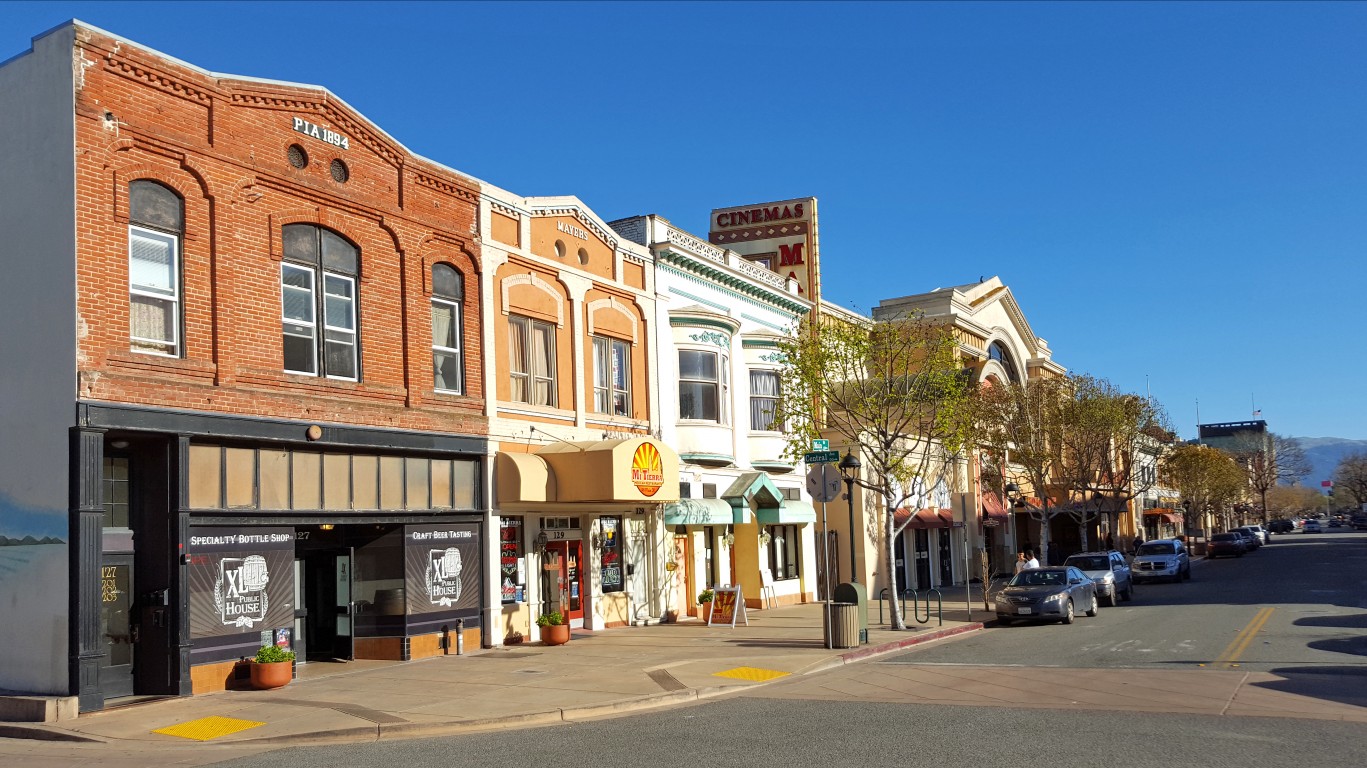
6. Salinas, CA
> Pct. born abroad: 31.1%
> Pct. of foreign-born gained citizenship: 24.8%
> Origin of largest immigrant group: Mexico (74.9% of foreign-born pop.)
> Population increase due to international immigration, 2010-17: +1.6%
Salinas, California, is home to one of the largest agricultural sectors in the country. The area produces more than half the nation’s leaf lettuce and celery, and more than a third of its broccoli and spinach. According to the area’s chamber of commerce, more than one-quarter of area households rely on the agriculture industry for income. Much of the area’s farms are tended to by migrant workers and their families. The vast majority of migrant workers in the United States were born in Mexico. Just under three quarters of Salinas’ foreign born population is from Mexico.
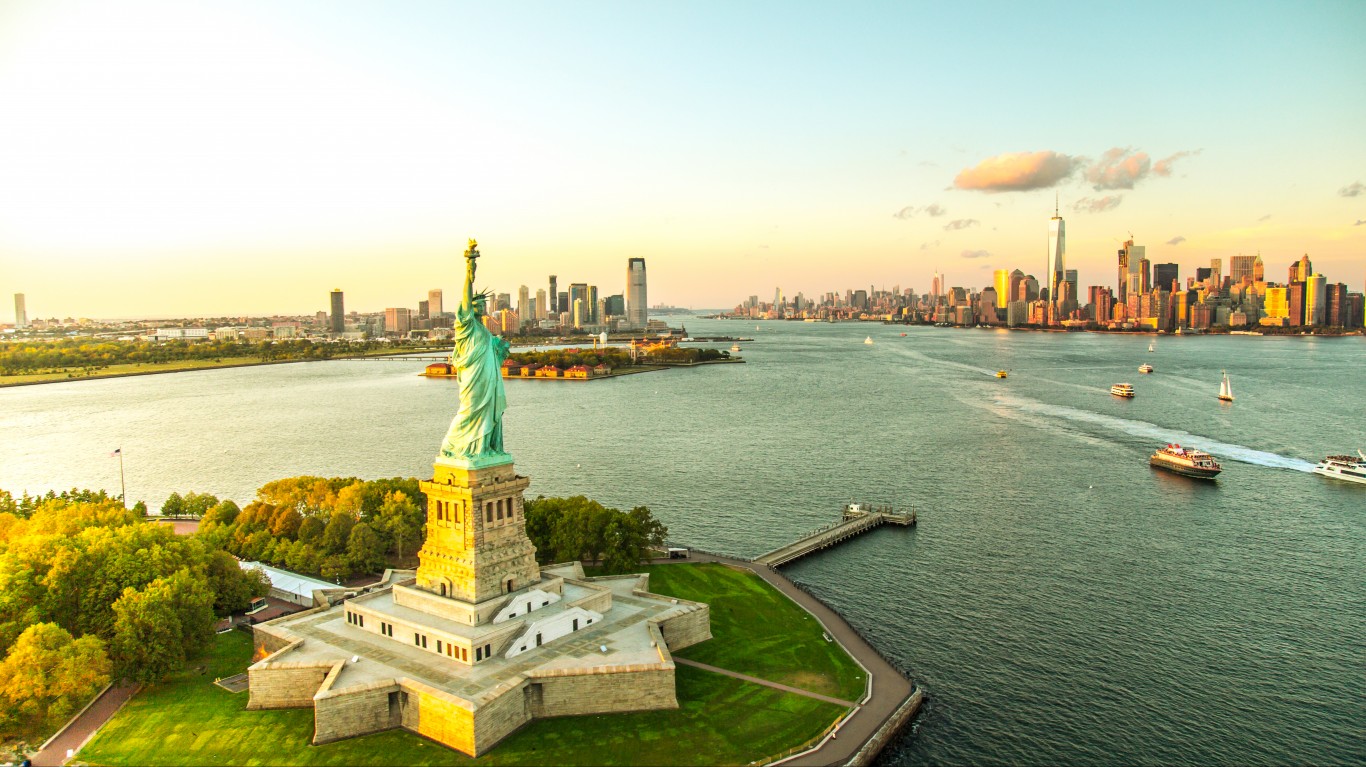
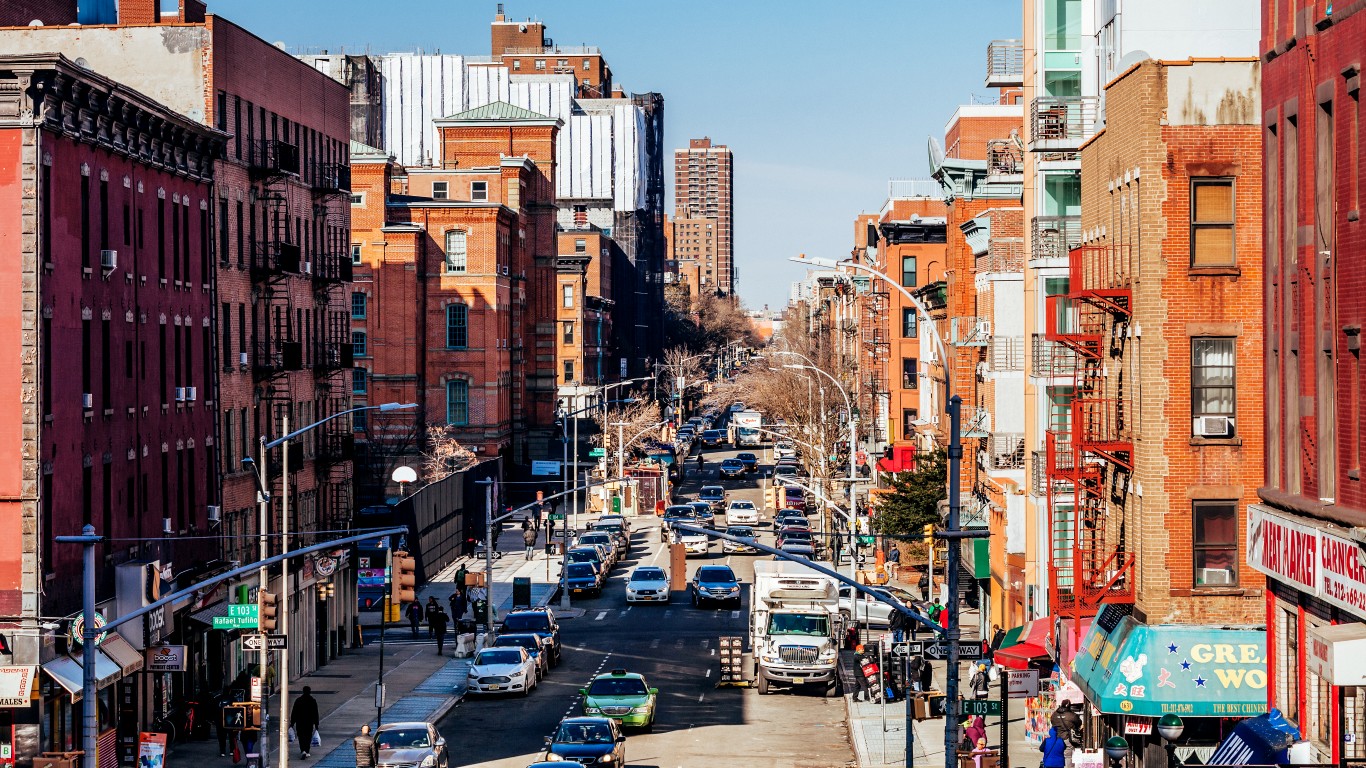
5. New York-Newark-Jersey City, NY-NJ-PA
> Pct. born abroad: 29.3%
> Pct. of foreign-born gained citizenship: 55.3%
> Origin of largest immigrant group: Dominican Republic (10.6% of foreign-born pop.)
> Population increase due to international immigration, 2010-17: +5.5%
New York has long been considered the iconic city of the American melting pot. It has been the primary port of entry to the United States throughout the country’s major waves of immigration. The city also has supported individual cultures to flourish in ethnic enclaves such as Little Italy, Chinatown, and Koreatown in Manhattan; Little Odessa and Little Poland in Brooklyn; and Little India and Little Guyana in Queens.
New York’s foreign-born population — which constitutes 29.3% of the metro area’s population — is composed of all 130 national origins the Census tracks. Some 4.4% of the city’s population was born in Europe, and 8.6% in Asia — respectively the third and 10th largest such shares nationwide. There is a 49.6% chance that two New York City residents picked at random would be from different countries, nearly twice the national figure.
[in-text-ad]
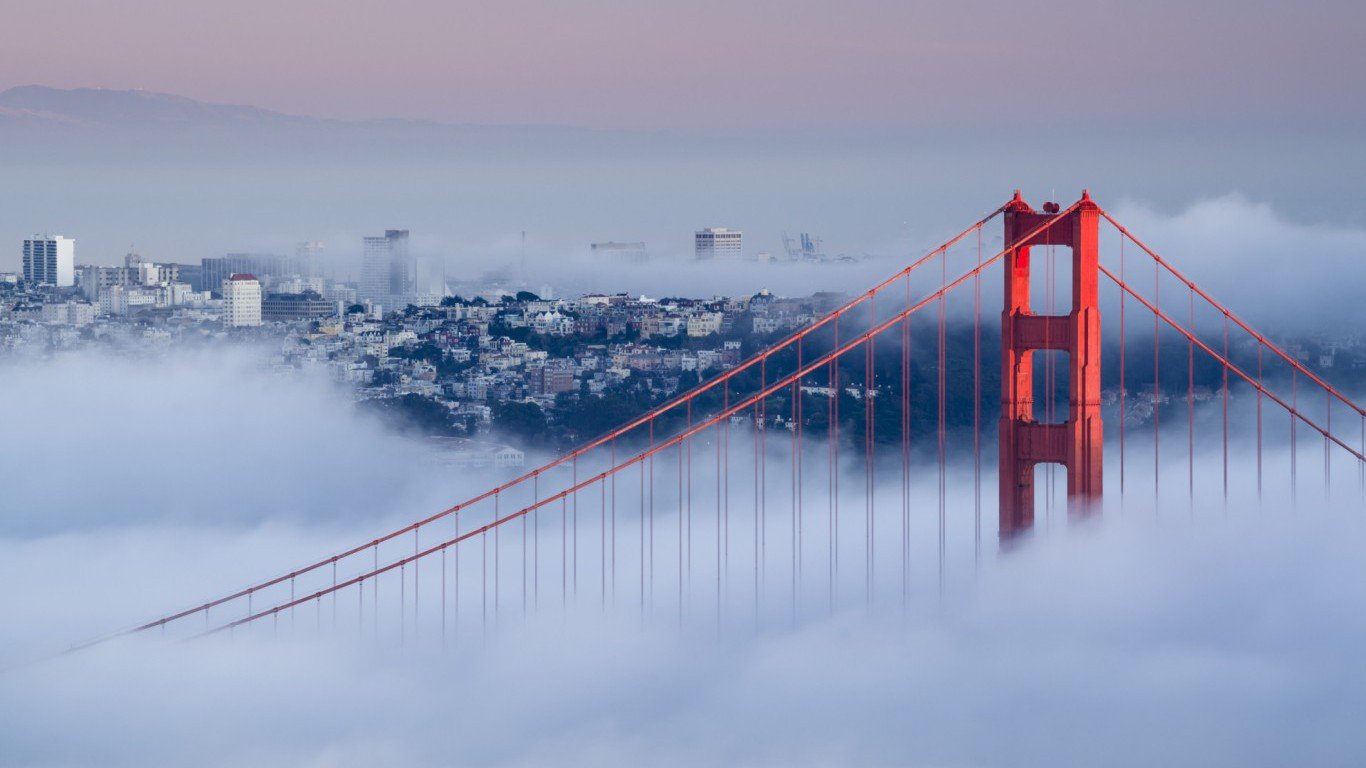
4. San Francisco-Oakland-Hayward, CA
> Pct. born abroad: 30.9%
> Pct. of foreign-born gained citizenship: 55.1%
> Origin of largest immigrant group: China (19.8% of foreign-born pop.)
> Population increase due to international immigration, 2010-17: +4.9%
In most of the melting pot metro areas on this list the largest region of origin of the foreign-born population is Central and South America and the Caribbean. San Francisco is one of two exceptions, and in both cases, the largest share of foreign born residents comes from the Asia. About one in four San Franciscans identify as Asian, and 17.3% of area residents were born in the region.
San Francisco has a long and rich history of serving as a foothold in the United States for Chinese immigrants. The city’s chinatown is arguably the most world-renowned. Of the city’s foreign-born residents, just under 20% are from China.
[recirclink id=488514]
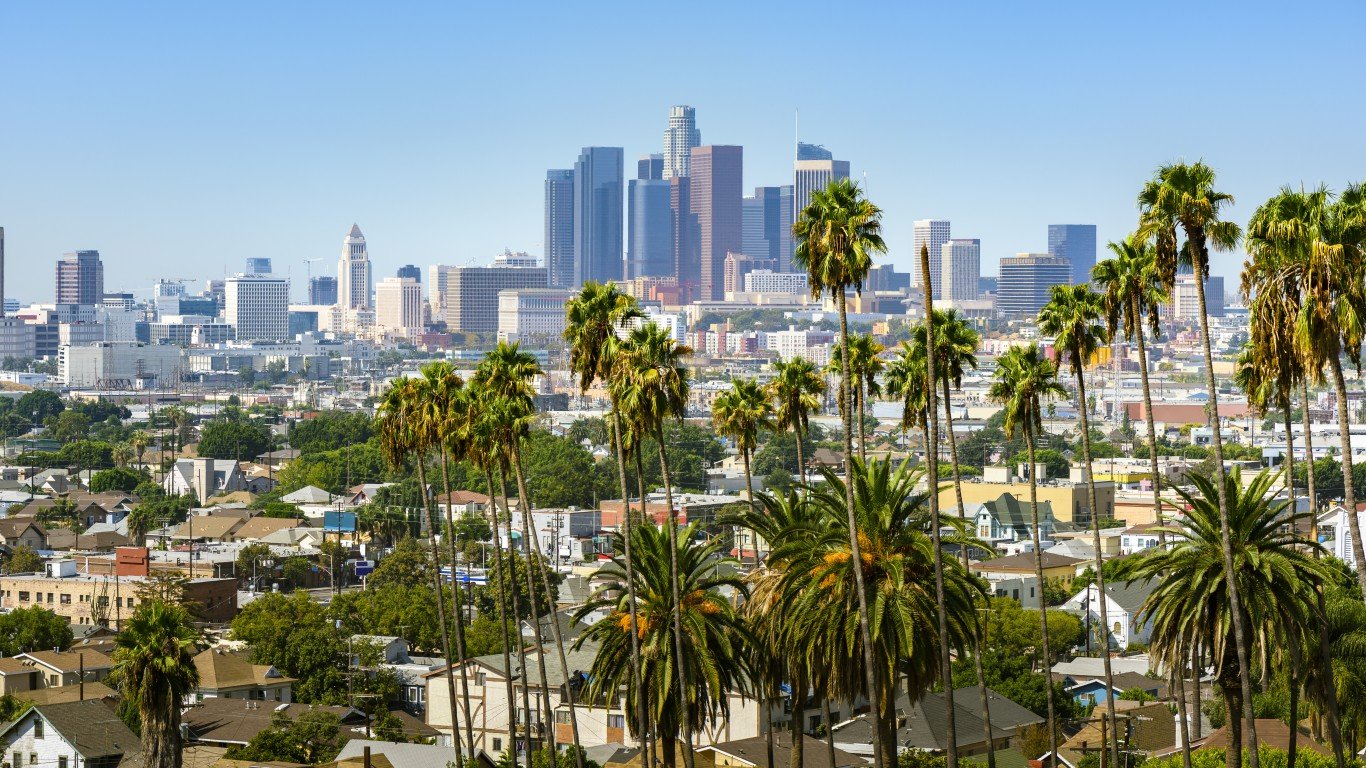
3. Los Angeles-Long Beach-Anaheim, CA
> Pct. born abroad: 33.6%
> Pct. of foreign-born gained citizenship: 51.9%
> Origin of largest immigrant group: Mexico (38.3% of foreign-born pop.)
> Population increase due to international immigration, 2010-17: +3.2%
Multiple waves of immigration have contributed to the high level of diversity in the Los Angeles metro area today. Thousands of Chinese workers came to California in the mid-19th century to work on the construction of the Transcontinental Railroad, many of them settling into what became Chinatown in Los Angeles.
The city’s cultural, ethnic, and racial diversity further increased with the steady arrival throughout the 20th century of immigrants from Mexico and of African Americans from other parts of the United States. Today, 15.2% of the metro area population identifies as Asian, 0.3% as Native Hawaiian or other Pacific islander, and 45.0% as Hispanic or Latino — each among the largest shares of any city. Some of the most ethnically rich neighborhoods include Boyle Heights, Koreatown, and Leimert Park Village.
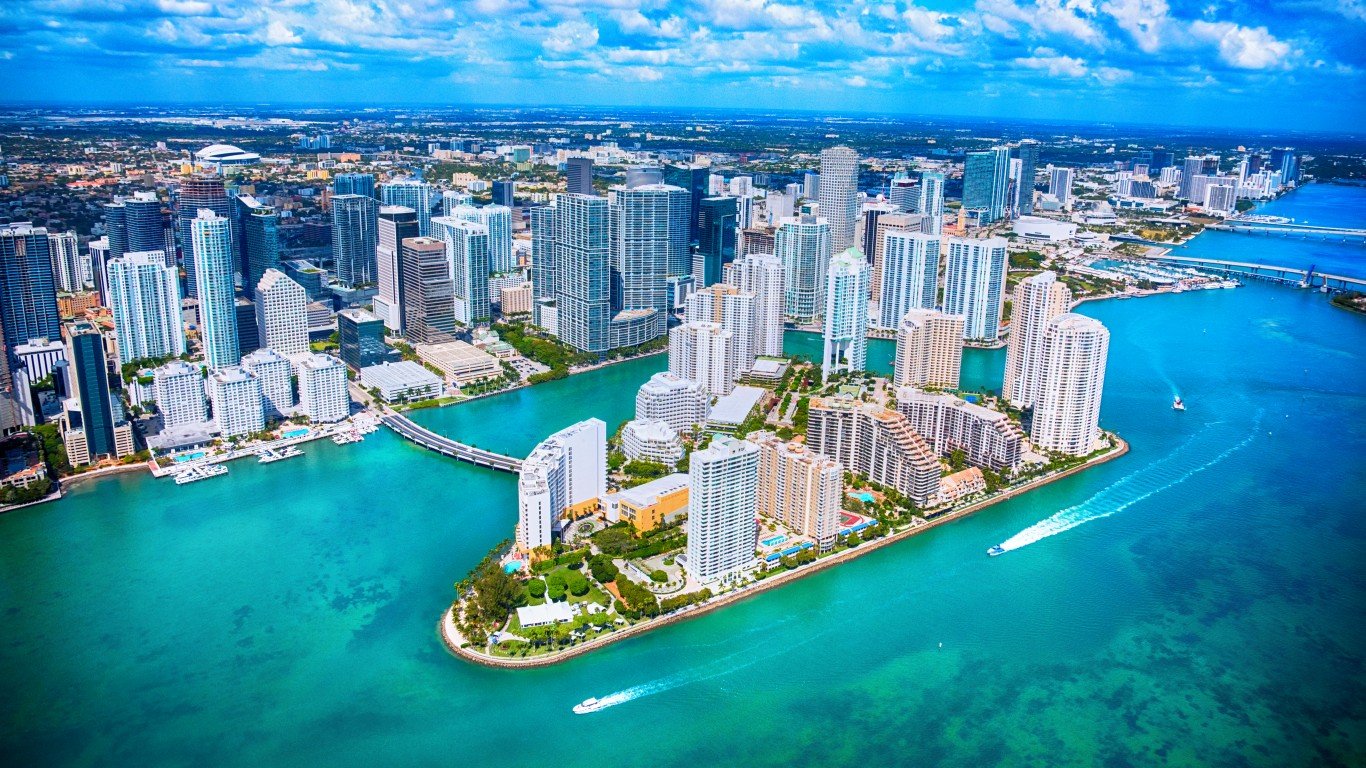
2. Miami-Fort Lauderdale-West Palm Beach, FL
> Pct. born abroad: 40.5%
> Pct. of foreign-born gained citizenship: 57.3%
> Origin of largest immigrant group: Cuba (32.3% of foreign-born pop.)
> Population increase due to international immigration, 2010-17: +9.2%
For centuries, Miami has served as a port of entry for Caribbean migrants into the United States. It also has been a point of entry for Puerto Ricans seeking to move to the mainland. In the city’s Little Havana, exiles from Cuba have found a home away from home, and immigrants from other Spanish-speaking nations have made a home there as well.
Over 40% of Miami’s population was born in a different country, the only U.S. metropolitan area where this is the case. Nearly one-quarter of Miami’s population are foreign-born residents who have become citizens in their lifetimes, also the highest share of any metro area.
[in-text-ad-2]
1. San Jose-Sunnyvale-Santa Clara, CA
> Pct. born abroad: 38.5%
> Pct. of foreign-born gained citizenship: 52.3%
> Origin of largest immigrant group: Mexico (20.7% of foreign-born pop.)
> Population increase due to international immigration, 2010-17: +7.2%
San Jose ranks as the most diverse city in the country. From the late 1800s to the mid-20th century, San Jose’s agriculture industry attracted large numbers of Mexican farmworkers to the area. In recent decades, international immigration has been largely driven by the city’s growing tech industry. The San Jose metro area is home to more than 800 high tech companies and 75% of all Fortune 500 companies. The city’s population grew by 7.2% due to international migration from 2010 to 2017, the third most of any city. Nearly two in five San Jose residents were born outside of the United States, the second most of any metro area. Some 25.4% of residents were born in Asia, the largest share nationwide.