
[cnxvideo id=”722238″ placement=”ros”]The United States has become a far safer country in recent decades. The last time the violent crime rate was higher than five years prior was 1994, when there were 714 violent crimes for every 100,000 people. Over the following five years, the violent crime rate plummeted by 26.7%, the largest five-year decrease since at least 1960.
As of 2017, there were 383 violent crimes for every 100,000 people in the U.S., a 1.3% decrease from five years before. The broad trend, while encouraging, does not reflect the reality on the ground in many cities across the country. In the vast majority of states, there is at least one metro area that is more dangerous now than it was five years ago. In some cases, the incidence of violent crime has more than doubled since 2012.
24/7 Wall St. reviewed five-year changes in violent crime rates in 283 U.S. metro areas that have comparable data to identify, in every state, the city where crime is climbing fastest.
The violent crime rate is a measure of the number of murders, robberies, rapes, and aggravated assaults for every 100,000 people in a given year. Nationwide, aggravated assault is by far the most common violent offense, and in most cities on this list, climbing rates of aggravated assault drove the overall increase in violence.
Just because a city ranks on this list does not mean it is particularly dangerous. Often, these cities are safer than the U.S. as a whole, despite reporting a state-leading surge in violent crime.
Click here to see cities where crime is soaring in every state.
Click here to read our methodology.
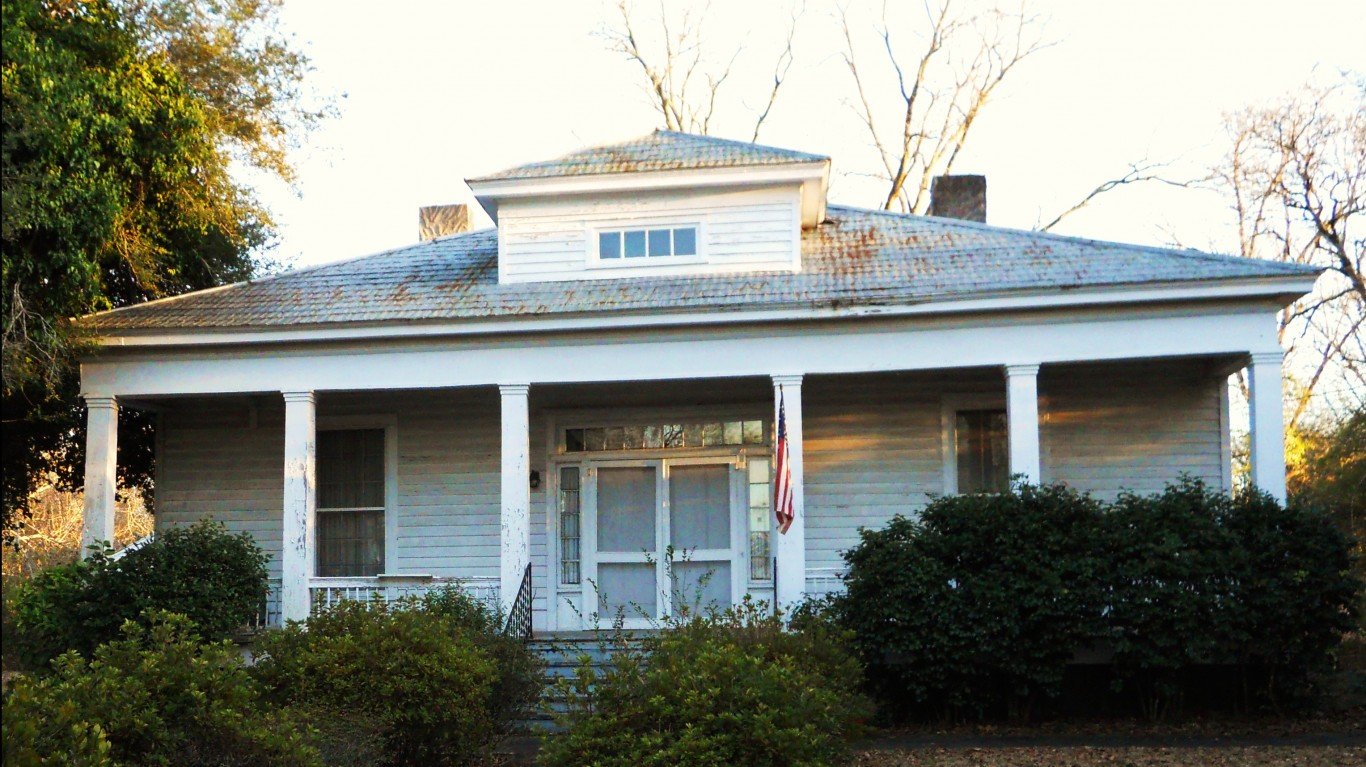
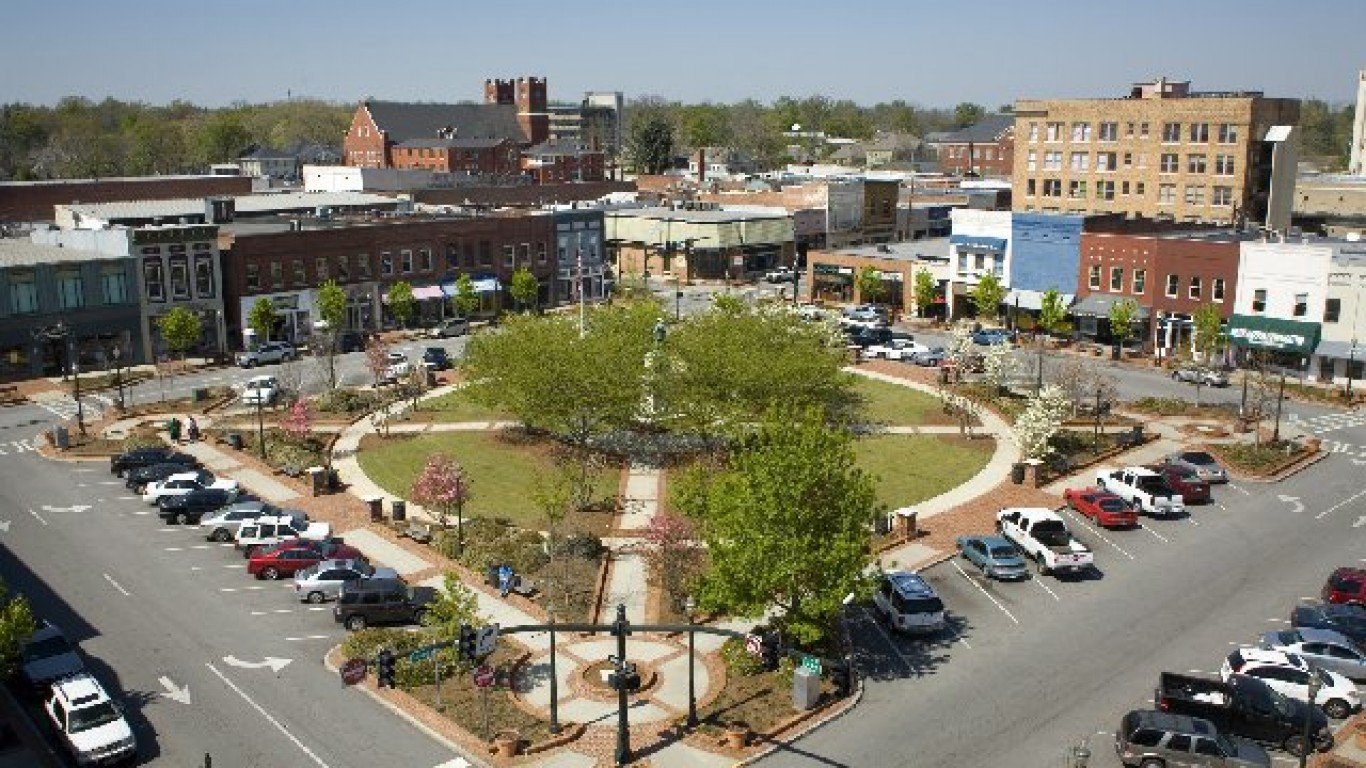
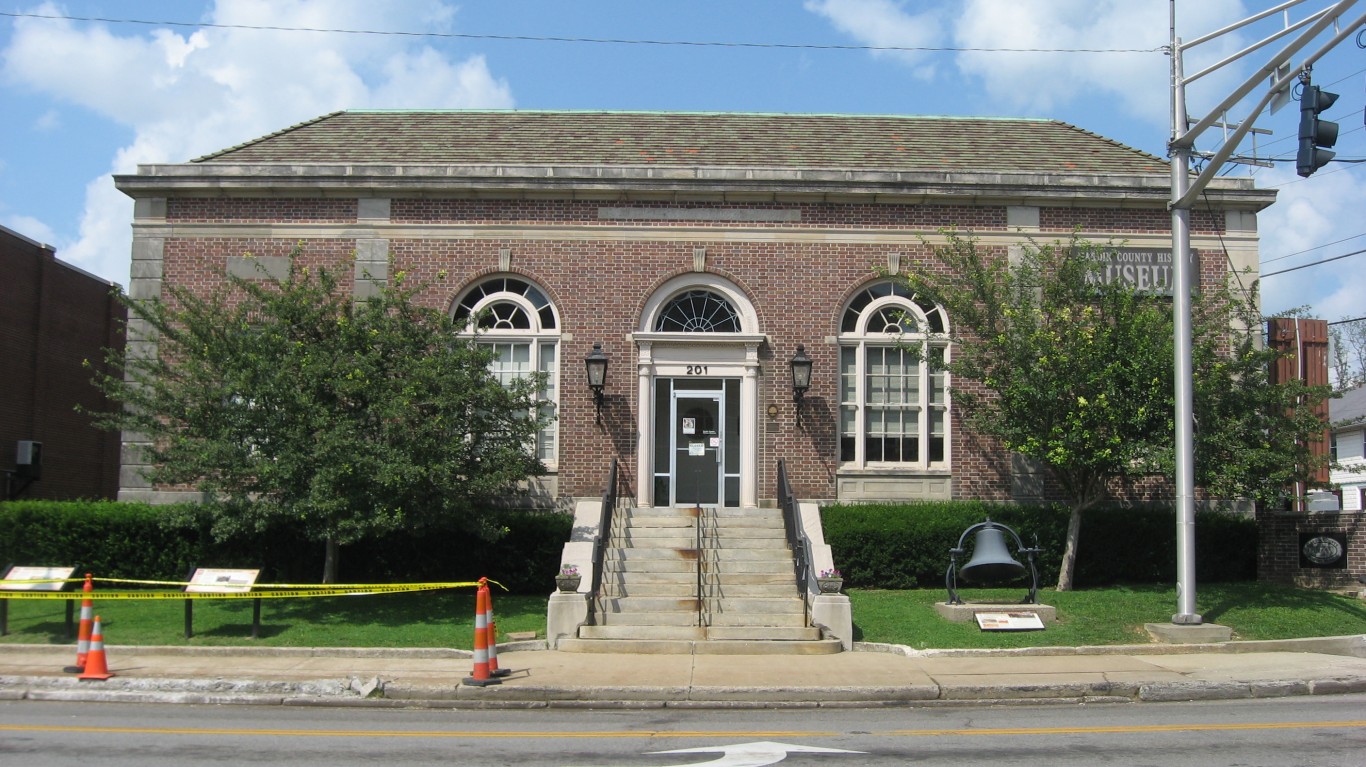
1. Alabama: Auburn-Opelika
> 5-yr. Change in crime rate: +113.7% (metro area) +16.5% (state)
> 2017 violent crimes per 100,000 people: 552 (metro area) 524 (state)
> 2017 murders: 12 (metro area) 404 (state)
> 2017 unemployment: 3.9% (metro area) 4.4% (state)
The violent crime rate in the Auburn-Opelika metro area increased by 113.7% between 2012 and 2017 — the largest increase of any metro area in Alabama and the second largest of any U.S. metro area. Just five years ago, Auburn-Opelika was safer than the U.S. as a whole, with a violent crime rate of 258 incidents per 100,000 residents. That same year, there were 388 violent crimes per 100,000 people nationwide. Now, the metro area’s violent crime rate of 552 incidents per 100,000 is well above the 383 per 100,000 national rate.
While the incidence of every type of violent crime increased in the metro area, including murder and robbery, the incidence of rape and aggravated assault each more than doubled.
[in-text-ad]
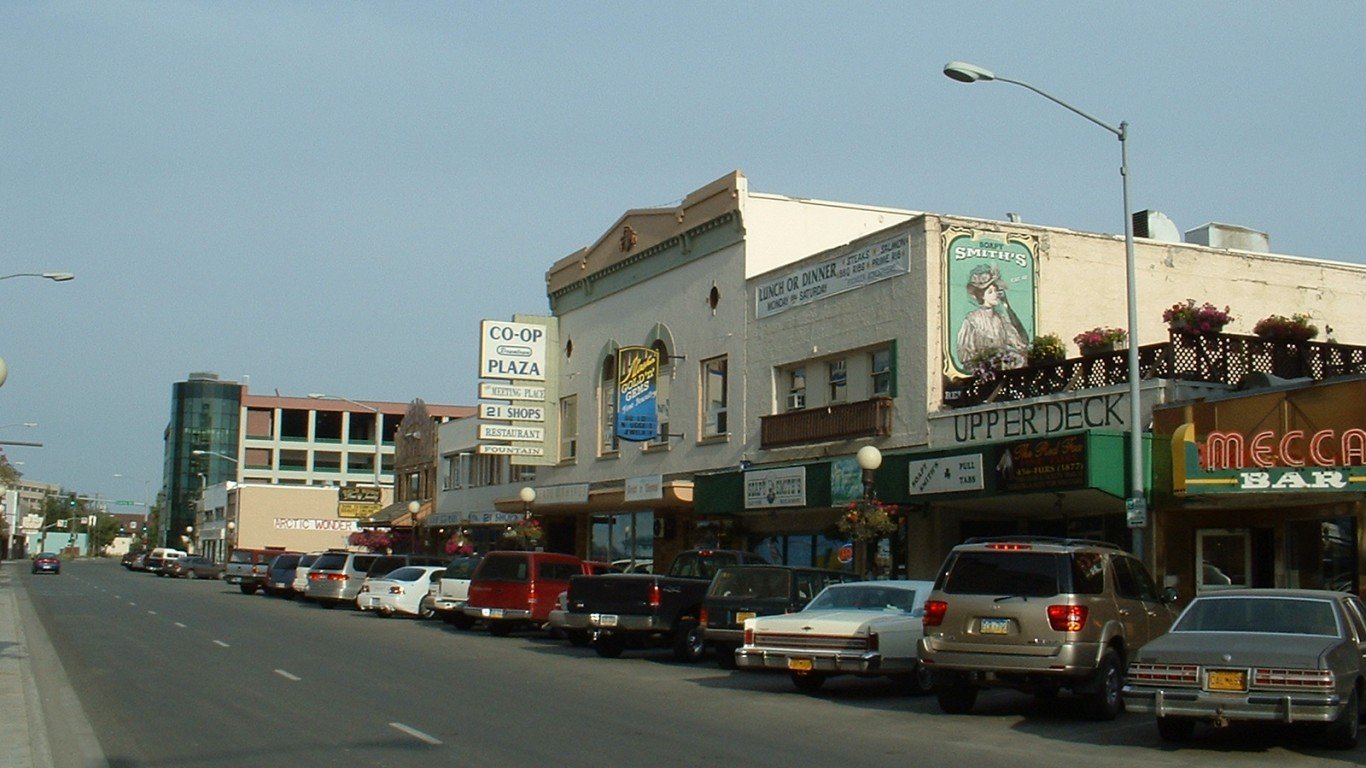
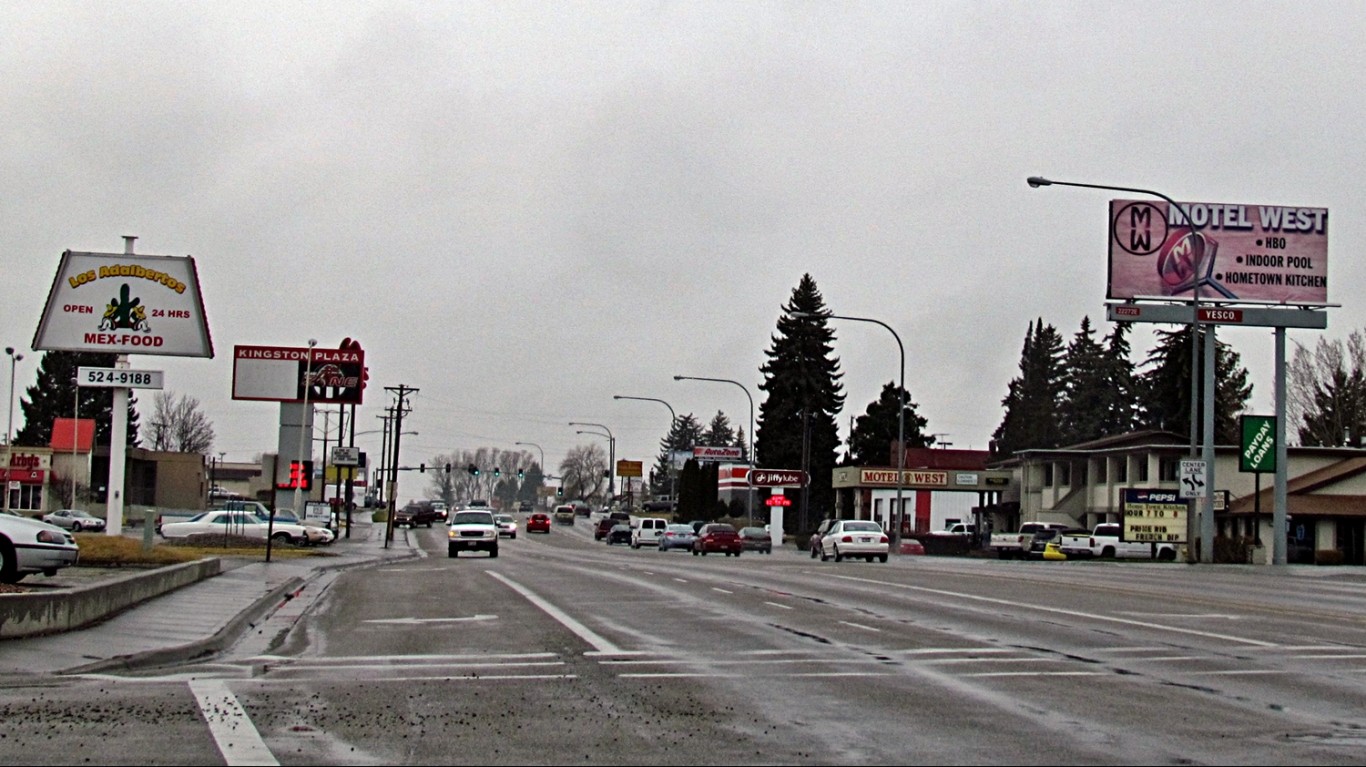
2. Alaska: Fairbanks
> 5-yr. Change in crime rate: +15.0% (metro area) +37.4% (state)
> 2017 violent crimes per 100,000 people: 608 (metro area) 829 (state)
> 2017 murders: 10 (metro area) 62 (state)
> 2017 unemployment: 6.3% (metro area) 7.2% (state)
Fairbanks is the only metro area in Alaska for which 2017 violent crime data is comparable to data from 2012. The violent crime rate in Fairbanks climbed from 529 incidents per 100,000 people to 608 incidents per 100,000 people over that period, a 15% increase. Despite the increase, Fairbanks remains safer than the state as a whole. Over the same period, the violent crime rate in Alaska increased by 37.4%, from 603 incidents to 829 incidents per 100,000 people.
During an August 2018 press conference, former Alaska Attorney General Jahna Lindemuth tied the increase in violence to the state’s opioid crisis. There were 20 drug overdose deaths for every 100,000 people in Alaska in 2017, according to the Centers for Disease Control and Prevention. These are the counties with the worst drug problem in every state.
[recirclink id=488456]
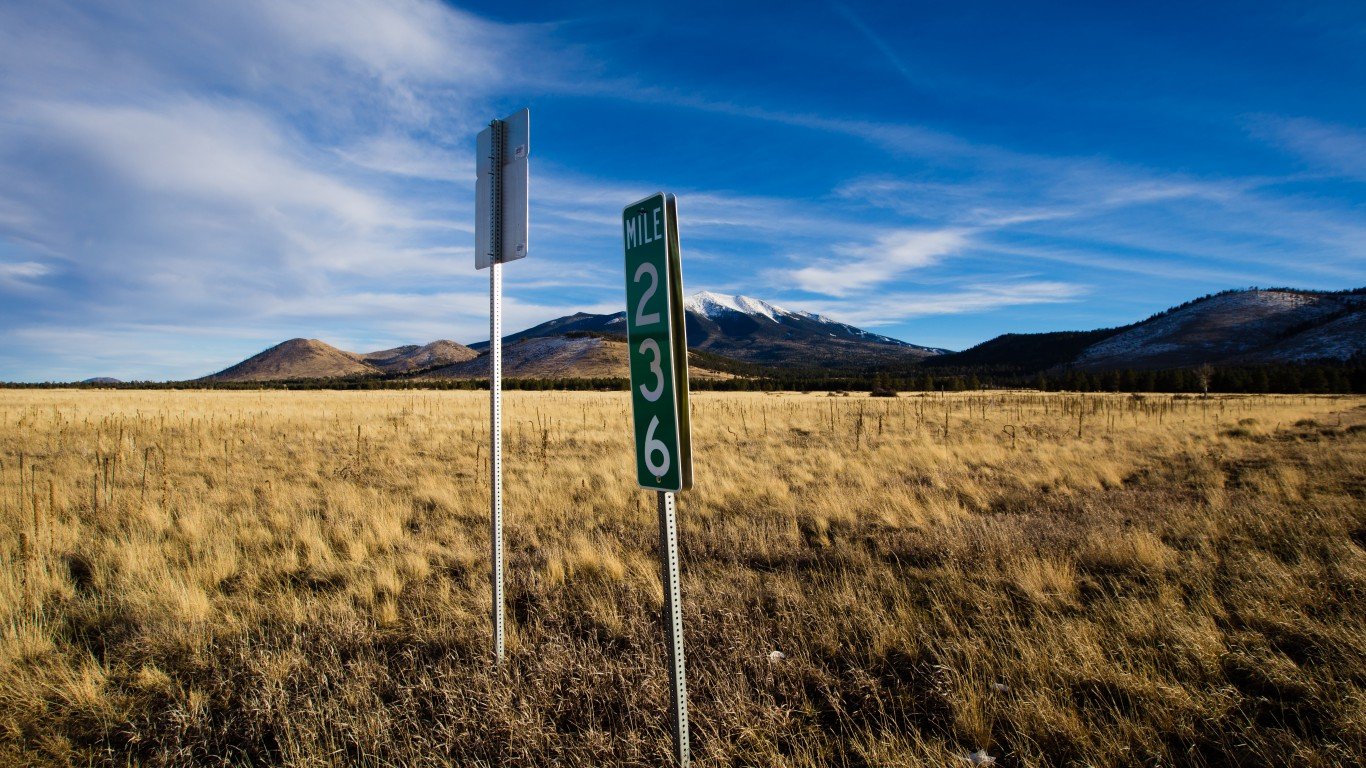
3. Arizona: Flagstaff
> 5-yr. Change in crime rate: +14.6% (metro area) +18.4% (state)
> 2017 violent crimes per 100,000 people: 384 (metro area) 508 (state)
> 2017 murders: 11 (metro area) 416 (state)
> 2017 unemployment: 5.6% (metro area) 4.9% (state)
Of the five metro areas in Arizona for which comparable crime data is available, Flagstaff reported the largest increase in violent crime over the last half decade. The total number of rapes, robberies, murders, and aggravated assault cases for every 100,000 people living in Flagstaff increased by 14.6% from 2012 to 2017. Still, the increase in the metro area was smaller than the 18.4% increase in violent crime across the state as a whole. Partially as a result, Flagstaff remains safer than much of the rest of the state.
The incidence rate of every type of violent crime has gone up in Flagstaff since 2012 — but none has climbed as rapidly as the murder rate. There were 7.8 murders for every 100,000 people in Flagstaff in 2017, a 169% increase from the murder rate of 2.9 per 100,000 in 2012.
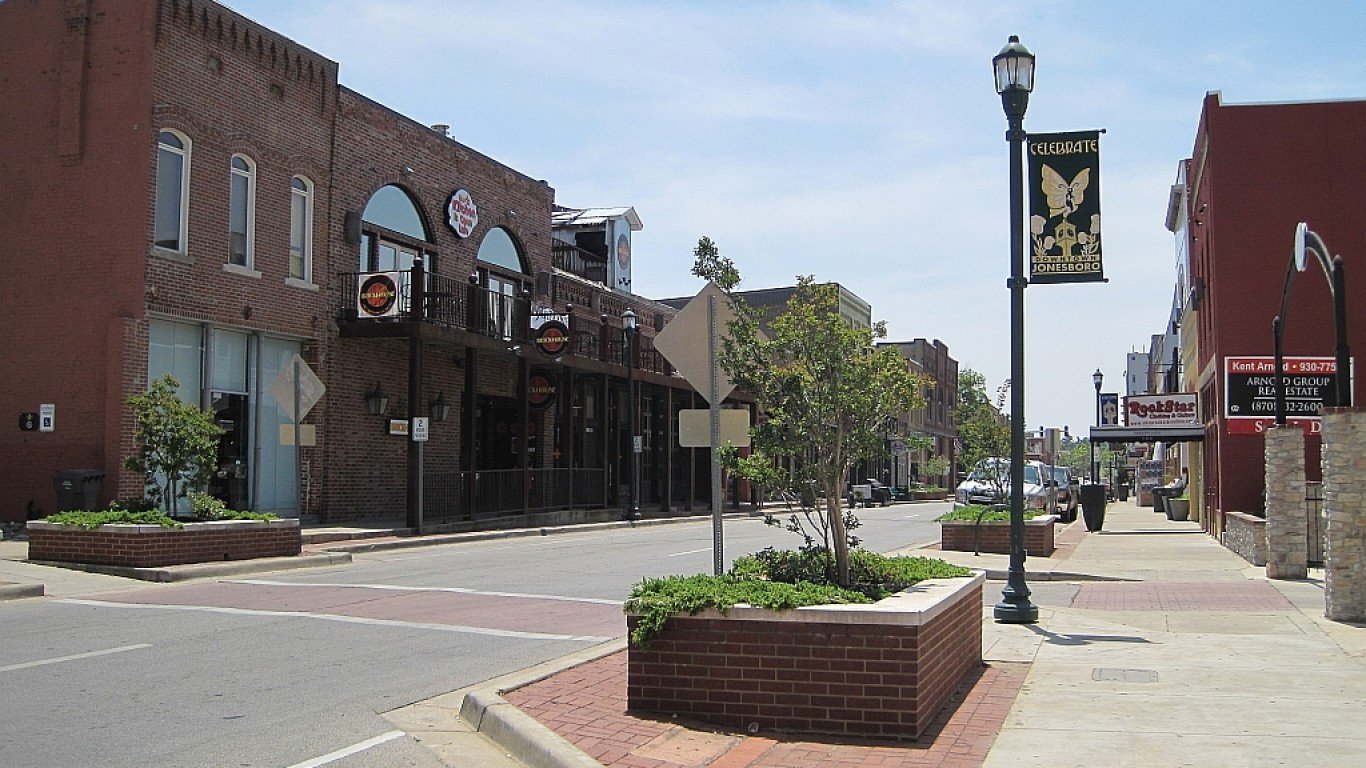
4. Arkansas: Jonesboro
> 5-yr. Change in crime rate: +38.8% (metro area) +18.3% (state)
> 2017 violent crimes per 100,000 people: 454 (metro area) 555 (state)
> 2017 murders: 16 (metro area) 258 (state)
> 2017 unemployment: 3.2% (metro area) 3.7% (state)
The violent crime rate rose in every metro area in Arkansas for which data was available between 2012 and 2017. Jonesboro reported the largest increase as the incidence of violence jumped by 38.8%. Despite the state-leading increase, Jonesboro is safer than much of the rest of Arkansas. The metro area’s violent crime rate of 454 incidents per 100,000 people is below Fort Smith’s rate of 506 per 100,000 and Little Rock’s rate of 799 per 100,000.
Since 2012, the robbery rate in Jonesboro fell by 26.5%. However, the improvement was not enough to offset increases in other categories of violent crime. The rate of aggravated assault soared by 51%, rapes climbed by 78%, and the murder rate more than doubled.
[in-text-ad-2]

5. California: Oxnard-Thousand Oaks-Ventura
> 5-yr. Change in crime rate: +32.4% (metro area) +6.2% (state)
> 2017 violent crimes per 100,000 people: 263 (metro area) 449 (state)
> 2017 murders: 26 (metro area) 1,830 (state)
> 2017 unemployment: 4.5% (metro area) 4.8% (state)
The incidence of violent crime increased by 32.4% in the Oxnard metro area in the last five years, more than in any of the 22 other California metro areas for which data was available. The violent crime rate increased by just 6.2% across California as a whole over the same period.
Despite reporting the highest-in-the-state rise in violence, Oxnard-Thousand Oaks-Ventura is the safest metro area in the state. There were 263 violent crimes for every 100,000 metro area residents in 2017, below both the statewide violent crime rate of 449 per 100,000 and the nationwide rate of 383 per 100,000.

6. Colorado: Pueblo
> 5-yr. Change in crime rate: +42.2% (metro area) +19.2% (state)
> 2017 violent crimes per 100,000 people: 726 (metro area) 368 (state)
> 2017 murders: 11 (metro area) 221 (state)
> 2017 unemployment: 4.3% (metro area) 2.8% (state)
Violent crime spiked by 42.2% in Pueblo, Colorado, between 2012 and 2017. There were 511 violent crimes for every 100,000 Pueblo residents in 2012, compared to the state’s violent crime rate of 309 per 100,000. As of 2017, Pueblo had a violent crime rate of 726 incidents per 100,000 people, compared to 368 per 100,000 across Colorado as a whole.
Violence tends to be more common in poorer areas — and a disproportionately large share of Pueblo residents are facing serious financial hardship. Pueblo’s poverty rate of 18.1% is the highest of any metro area considered in the state. Pueblo is one of 50 cities nationwide to rank among the most dangerous cities in every state.
[in-text-ad]

7. Connecticut: None
> 5-yr. Change in crime rate: -19.4% (state)
> 2017 violent crimes per 100,000 people: 228 (state)
> 2017 murders: 102 (state)
> 2017 unemployment: 4.7% (state)
Connecticut is far safer now than it was five years ago. There were just 228 violent crimes for every 100,000 people in the state in 2017, a 19.4% decrease from 283 violent crimes per 100,000 in 2012. Even in the state’s metro areas — most of which are more dangerous than the state as a whole — crime is down. The violent crime fell over the last five years by 13.5% in Hartford, 17.8% in Bridgeport, 25.7% in New Haven, and a staggering 44.7% in Norwich. Crime is often concentrated in poorer areas, and the share of people living in poverty either declined or remained flat in each of the four Connecticut metro areas reviewed over roughly the same period.
Even New Haven, Connecticut’s most dangerous metro area, has a lower violent crime rate than the U.S. as a whole. There were 307 violent crimes for every 100,000 people in New Haven in 2017 compared to 383 per 100,000 nationwide.
[recirclink id=488594]

8. Delaware: None
> 5-yr. Change in crime rate: -17.2% (state)
> 2017 violent crimes per 100,000 people: 453 (state)
> 2017 murders: 54 (state)
> 2017 unemployment: 4.6% (state)
Dover is the only metro area in Delaware, and over the last five years, the violent crime rate in Dover fell by 20.9%. Though the incidence rate of rapes and murders climbed in Dover, those were more than offset by declining robbery and aggravated assault rates. The decline in violent crime in Dover helped reduce the violent crime rate across the state, as Delaware’s violent crime rate improved by 17.2% over the same period.
Despite the decrease, Dover remains more dangerous that the U.S. as a whole. There were 428 violent crimes for every 100,000 metro area residents in 2017, well above the 383 per 100,000 U.S. violent crime rate.

9. Florida: The Villages
> 5-yr. Change in crime rate: +35.7% (metro area) -16.2% (state)
> 2017 violent crimes per 100,000 people: 234 (metro area) 408 (state)
> 2017 murders: 6 (metro area) 1,057 (state)
> 2017 unemployment: 6.0% (metro area) 4.2% (state)
The Villages is one 50 cities to rank among the fastest growing cities in each state. It also has the fastest growing violent crime rate in Florida. In the last five years, The Villages’ population climbed by 31.3%. Over the same period, the metro area’s violent crime rate shot up by 35.7%. The increase was driven by a surge in aggravated assaults. Still, The Villages is relatively safe. The were 234 violent crimes for every 100,000 metro area residents in 2017, below the state rate of 408 per 100,000 and U.S. rate of 383 per 100,000.
Of the 22 metro areas in Florida with comparable data, The Villages was one of only four to report an increase in violent crime. Across Florida, the incidence of violent crime fell by 16.2% between 2012 and 2017.
[in-text-ad-2]
10. Georgia: Gainesville
> 5-yr. Change in crime rate: +26.7% (metro area) -5.7% (state)
> 2017 violent crimes per 100,000 people: 221 (metro area) 357 (state)
> 2017 murders: 5 (metro area) 703 (state)
> 2017 unemployment: 3.9% (metro area) 4.7% (state)
Of the 12 metro areas in Georgia with comparable data, Gainesville reported the largest increase in violent crime over the last five years. Driven by surges in the rates of rape and aggravated assault, the violent crime rate in Gainesville climbed by 26.7% between 2012 and 2017. The increase was a departure from the statewide trend. Over the same period, Georgia’s violent crime rate fell by 5.7%.
Despite the increase, Gainesville remains a relatively safe city. The 221 violent crimes per 100,000 metro area residents remains well below the 357 per 100,000 state violent crime rate and the 383 per 100,000 national rate.

11. Hawaii: Kahului-Wailuku-Lahaina
> 5-yr. Change in crime rate: +3.9% (metro area) +4.8% (state)
> 2017 violent crimes per 100,000 people: 269 (metro area) 251 (state)
> 2017 murders: 2 (metro area) 39 (state)
> 2017 unemployment: 2.5% (metro area) 2.4% (state)
Kahului-Wailuku-Lahaina is the only metro area in Hawaii with comparable crime data from 2012 and 2017. Over that period, there was a 3.9% uptick in the incidence of violence in the metro area, roughly inline with the 4.8% increase across the state as a whole. The increase in Kahului-Wailuku-Lahaina was driven by spikes in the rates of rape and aggravated assault. Across Hawaii as a whole, aggravated assault was the only category of violent crime to decrease in the last five years.
Both Kahului-Wailuku-Lahaina’s violent crime rate of 269 per 100,000 and Hawaii’s rate of 251 per 100,000 fall well below the national rate of 383 per 100,000.
[in-text-ad]
12. Idaho: Idaho Falls
> 5-yr. Change in crime rate: +45.5% (metro area) +8.9% (state)
> 2017 violent crimes per 100,000 people: 239 (metro area) 226 (state)
> 2017 murders: 2 (metro area) 32 (state)
> 2017 unemployment: 2.6% (metro area) 3.2% (state)
Violent crime in Idaho Falls surged by 45.5% in the last five years. The 64.5% increase in the aggravated assault rate accounted for much of the overall surge.
In stark contrast to the rapid increase in violent crime, the property crime rate in Idaho Falls has fallen precipitously. Property crimes are non-violent offenses that include burglary, larceny, and motor vehicle theft, and over the last five years, the incidence rate of those types of offenses plunged by 31.7%, the sharpest decline of any metro area in the state.
[recirclink id=488561]

13. Illinois: Danville
> 5-yr. Change in crime rate: +61.8% (metro area) +5.8% (state)
> 2017 violent crimes per 100,000 people: 901 (metro area) 439 (state)
> 2017 murders: 10 (metro area) 997 (state)
> 2017 unemployment: 6.3% (metro area) 5% (state)
Over the last five years, the number of people living in Danville, Illinois, fell by 4.9%. Despite a shrinking population, the number of violent crimes committed in the metro area climbed from 454 to 699. Adjusted for population, Danville’s violent crime rate climbed by 61.8% between 2012 and 2017, by far the largest increase of any metro area in the state. Due in part to the surge in crime, Danville now ranks as the most dangerous metro area in the state. Danville’s violent crime rate of 901 incidents per 100,000 is among the highest of any U.S. metro area and well above the state violent crime rate of 439 incidents per 100,000 people.
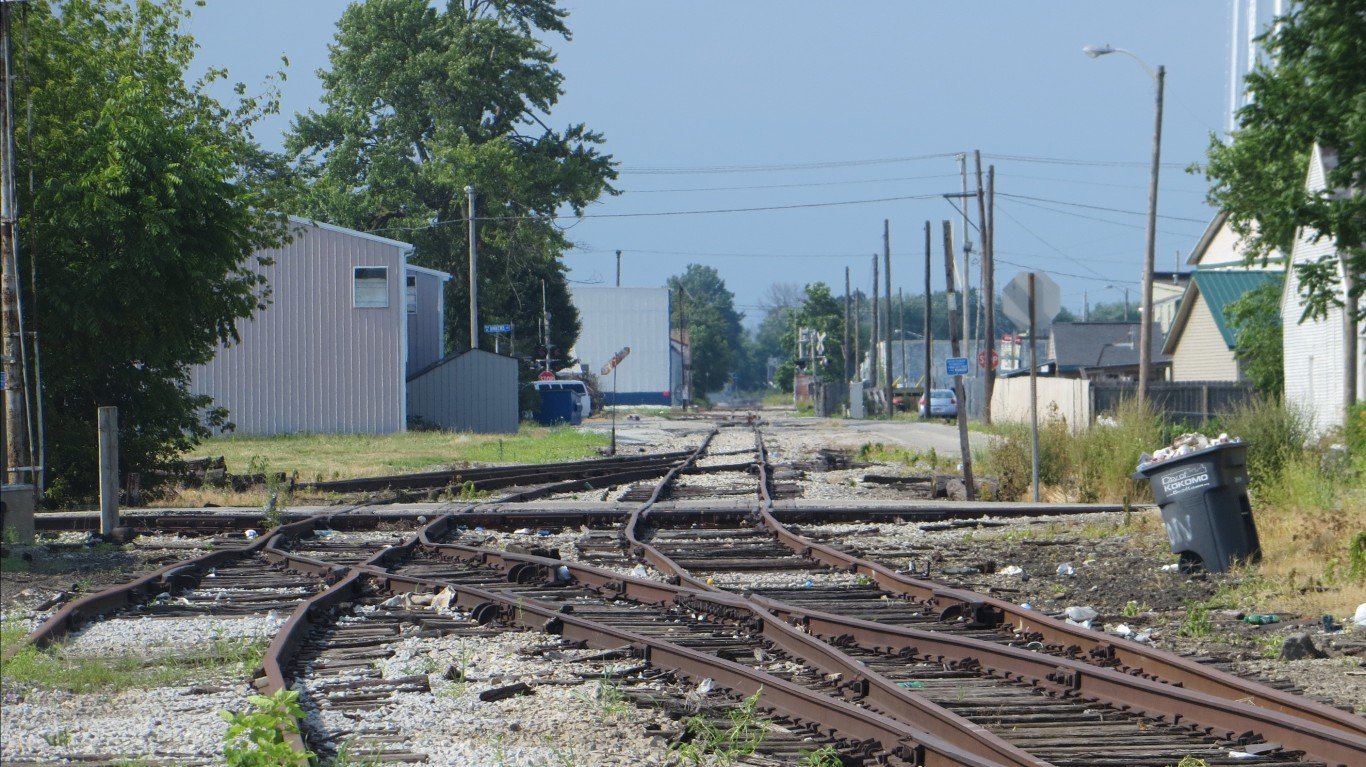
14. Indiana: Kokomo
> 5-yr. Change in crime rate: +122.8% (metro area) +15.4% (state)
> 2017 violent crimes per 100,000 people: 593 (metro area) 399 (state)
> 2017 murders: 6 (metro area) 397 (state)
> 2017 unemployment: 3.8% (metro area) 3.5% (state)
The violent crime rate on Kokomo, Indiana, soared by 122.8% between 2012 and 2017 — the largest increase of any metro area in both the state and the nation. The increase was driven by a surge in the aggravated assault rate, which was nearly three times higher in 2017 than it was five years prior. The climbing incidence of violence in Kokomo contributed to a 15.4% increase in violent crime across Indiana as a whole over the same period.
Due to the increase, Kokomo’s violent crime rate of 593 incidents per 100,000 people is now the second highest in the state, trailing only Indianapolis, where there were 695 incidents per 100,000.
[in-text-ad-2]
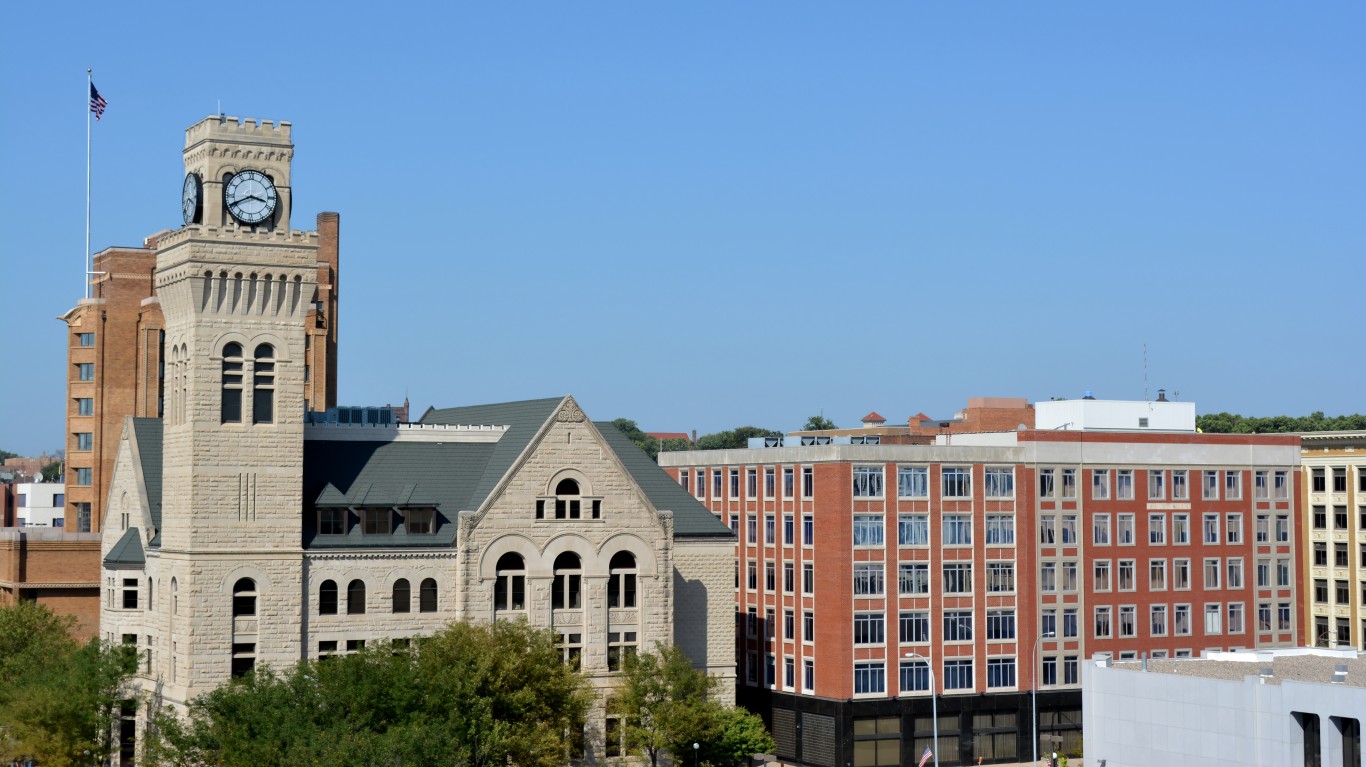
15. Iowa: Sioux City
> 5-yr. Change in crime rate: +37.0% (metro area) +11.2% (state)
> 2017 violent crimes per 100,000 people: 291 (metro area) 293 (state)
> 2017 murders: 3 (metro area) 104 (state)
> 2017 unemployment: 3.2% (metro area) 3.1% (state)
There were a total of 492 reported incidents of violent crime in Sioux City in 2017, up from 361 incidents five years prior. The number of crimes increased even as the metro area population shrunk by 0.5% over that period. As a result, the violent crime rate climbed by 37.0% between 2012 and 2017, faster than any other metro area in Iowa.
Despite the rapidly rising crime rate, Sioux City remains relatively safe. There were 291 violent crimes for every 100,000 metro area residents in 2017, well below the national violent crime rate of 383 per 100,000 and in line with the statewide rate of 293 per 100,000.

16. Kansas: Wichita
> 5-yr. Change in crime rate: +36.9% (metro area) +16.5% (state)
> 2017 violent crimes per 100,000 people: 724 (metro area) 413 (state)
> 2017 murders: 44 (metro area) 160 (state)
> 2017 unemployment: 4.1% (metro area) 3.6% (state)
Five years ago, Wichita, Kansas, had the highest violent crime rate of the state’s three major metropolitan areas and the 51st highest rate of U.S. metro areas considered, at 529 incidents per 100,000 people. That rate rose to 724 reported incidents per 100,000 residents in 2017, climbing to 15th highest of U.S. metro areas in 2017. That 36.9% increase well exceeds the state’s 16.5% increase in violent crime rate.
[in-text-ad]
17. Kentucky: Elizabethtown-Fort Knox
> 5-yr. Change in crime rate: +49.1% (metro area) +1.4% (state)
> 2017 violent crimes per 100,000 people: 113 (metro area) 226 (state)
> 2017 murders: 5 (metro area) 263 (state)
> 2017 unemployment: 4.7% (metro area) 4.9% (state)
The violent crime rate in the Elizabethtown-Fort Knox metro area climbed by 49.1% in the last five years, by far the largest increase of any metro area in the state. Over the same period, Kentucky’s violent crime rate inched up by just 1.4% and the U.S. violent crime rate fell by 1.3%. In Elizabethtown-Fort Knox, the aggravated assault rate more than doubled, and the murder rate more than quadrupled.
Despite the surge in violence, Elizabethtown-Fort Knox remains the safest metro area in the state and one of the safest in the country. There were just 113 violent crimes for every 100,000 Elizabethtown-Fort Knox residents in 2017 — half of Kentucky’s violent crime rate and less than a third of the national violent crime rate of 383 per 100,000.
[recirclink id=488514]

18. Louisiana: Houma-Thibodaux
> 5-yr. Change in crime rate: +11.4% (metro area) +12.1% (state)
> 2017 violent crimes per 100,000 people: 325 (metro area) 557 (state)
> 2017 murders: 10 (metro area) 582 (state)
> 2017 unemployment: 5.5% (metro area) 5.1% (state)
The Houma-Thibodaux metro area in southeastern Louisiana reported an 11.4% increase in violent crime between 2012 and 2017 — the most of any metro area in the state with comparable data. Still, Houma-Thibodaux remains a relatively safe metro area in a dangerous state. Houma-Thibodaux’s violent crime rate of 325 incidents per 100,000 is by far the lowest of any Louisiana metro area. Across the state as a whole, there were 557 violent crimes per 100,000 people in 2017 — well above the national violent crime rate of 383 per 100,000. In Monroe, the state’s most dangerous metro area, there were 935 violent crimes for every 100,000 people in 2017.
19. Maine: Lewiston-Auburn
> 5-yr. Change in crime rate: +7.5% (metro area) -1.4% (state)
> 2017 violent crimes per 100,000 people: 157 (metro area) 121 (state)
> 2017 murders: 0 (metro area) 23 (state)
> 2017 unemployment: 3.1% (metro area) 3.3% (state)
In Lewiston-Auburn, the most dangerous metro area in Maine, the violent crime rate of 157 per 100,000 is less than half the 383 per 100,000 national rate. Lewiston-Auburn was also the only metro area in the state to report an increase in violence in the last five years. The metro area’s crime rate rose by 7.5%, driven by climbing rates of rape and aggravated assault.
Across Maine, there were just 23 homicides in 2017, less than a quarter of the total number of murders in every U.S. metro area considered with a similar population size to Maine. With a violent crime rate of just 121 incidents per 100,000 people, Maine is the safest state in the country.
[in-text-ad-2]

20. Maryland: Baltimore-Columbia-Towson
> 5-yr. Change in crime rate: +26.0% (metro area) +4.9% (state)
> 2017 violent crimes per 100,000 people: 783 (metro area) 500 (state)
> 2017 murders: 413 (metro area) 546 (state)
> 2017 unemployment: 4.3% (metro area) 4.1% (state)
Baltimore-Columbia-Towson is by far the most dangerous metro area in Maryland and one of the most dangerous in the United States. The metro area’s violent crime rate spiked by 26.0% in the last five years and currently stands at 783 incidents per 100,000 people — well above both the statewide violent crime rate of 500 per 100,000 and the national rate of 383 per 100,000. Much of the violence in Baltimore is attributable to gang activity.
Earlier this year, Maryland Gov. Larry Hogan announced plans to commit $13 million to reduce violent crime in Baltimore. Much of that money will be allocated to a new joint strike task force made up of 200 law enforcement officers from federal, state, and local jurisdictions.
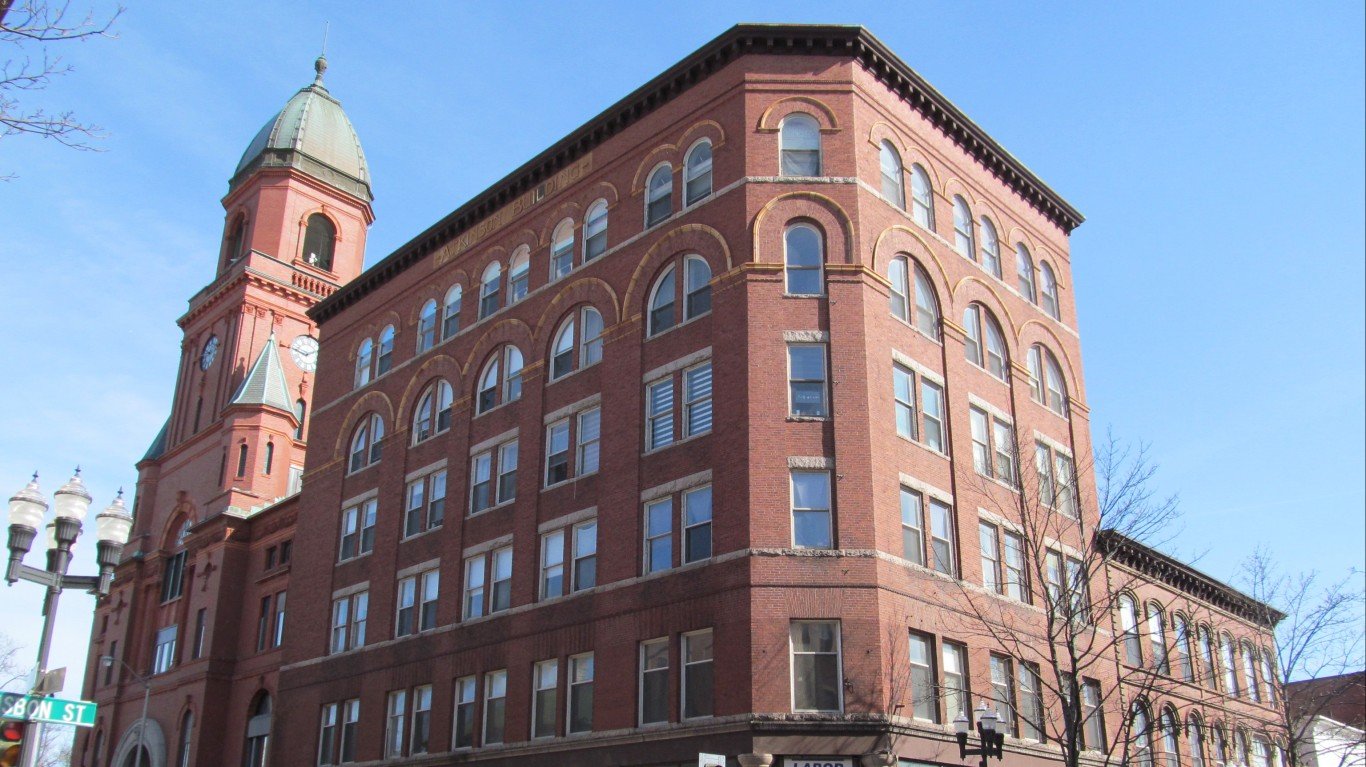
21. Massachusetts: Pittsfield
> 5-yr. Change in crime rate: +60.4% (metro area) -11.7% (state)
> 2017 violent crimes per 100,000 people: 558 (metro area) 358 (state)
> 2017 murders: 4 (metro area) 173 (state)
> 2017 unemployment: 4.4% (metro area) 3.7% (state)
Among major metropolitan areas across Massachusetts, violent crime generally either increased slightly — by 0.8% in Springfield — or fell substantially. In Boston, the violent crime rate fell by 14%, from 355 incidents per 100,000 people in 2012 to 305 per 100,000 in 2017.
The notable major exception in the Bay State was Pittsfield, where the violent crime rate rose from 348 incidents per 100,000 in 2012 — below the national rate at the time — to 558 per 100,000 in 2017, well above the national rate. The 60.4% spike in the violent crime rate is the sixth largest jump of any U.S. metropolitan area. Pittsfield Police Chief Michael Wynn explained that the opioid epidemic has been partially responsible for the increase in reported crime, both violent and non-violent. “At some point, whether it’s to support a habit or in connection with something else, we’re going to find somebody who’s substance addicted during our investigation,” he told a local radio station.
[in-text-ad]
22. Michigan: Kalamazoo-Portage
> 5-yr. Change in crime rate: +39.6% (metro area) -1.0% (state)
> 2017 violent crimes per 100,000 people: 501 (metro area) 450 (state)
> 2017 murders: 16 (metro area) 569 (state)
> 2017 unemployment: 4.5% (metro area) 4.6% (state)
The violent crime rate fell by 1% in Michigan in the last five years. Breaking from the broader trend, Kalamazoo-Portage reported a 39.6% jump in the incidence of violence over the same period, by far the largest increase of any metro area in the state. The increase was driven largely by a 51.2% surge in aggravated assaults.
While violence has become more common in recent years in the metro area, other types of crimes are becoming less common. The property crime rate in Kalamazoo-Portage improved by 5.7% since 2012, driven by declines in larceny and burglary.
[recirclink id=488498]

23. Minnesota: None
> 5-yr. Change in crime rate: +3.2% (state)
> 2017 violent crimes per 100,000 people: 238 (state)
> 2017 murders: 113 (state)
> 2017 unemployment: 3.5% (state)
Minnesota is one of the safest states in the country, with a violent crime rate of just 238 incidents per 100,000 residents. The violent crime rate in each of the state’s five major metropolitan areas is well below the national rate of 383 incidents per 100,000 people. In the metro area with the highest violent crime rate, Minneapolis, there were 100 fewer incidents per 100,000 residents than the national violent crime rate. Rochester, Minnesota’s violent crime rate of 146 per 100,000 is less than half the U.S. rate.
Due to changes in reporting practices, it cannot be determined if the violent crime rate increased in any of Minnesota’s metro areas in the last five years.

24. Mississippi: None
> 5-yr. Change in crime rate: +9.5% (state)
> 2017 violent crimes per 100,000 people: 286 (state)
> 2017 murders: 245 (state)
> 2017 unemployment: 5.1% (state)
Jackson is the only metro area in Mississippi with comparable violent crime rates from 2012 and 2017. Over that period, the violent crime rate dipped by 12.8% in the metro area. Even as the state capital became safer, however, rates of violent crimes increased across Mississippi as a whole. The violent crime rate across the state climbed by 9.5% over the last five years.
If these trends continue, Jackson may soon become safer than the state as a whole. Currently, there are 338 violent crimes for every 100,000 people in Jackson, well above the violent crime rate across Mississippi of 286 per 100,000.
[in-text-ad-2]

25. Missouri: St. Joseph
> 5-yr. Change in crime rate: +32.0% (metro area) +17.6% (state)
> 2017 violent crimes per 100,000 people: 415 (metro area) 530 (state)
> 2017 murders: 8 (metro area) 600 (state)
> 2017 unemployment: 3.4% (metro area) 3.8% (state)
In all of Missouri’s five major metro areas with available data the violent crime rates exceed the national rate of 383 incidents per 100,000 people. Of those, all but one had substantial increases in violent crime over the past five years, a period in which violent crime rates fell nationwide. St.Joseph, Missouri, does not have the highest violent crime rate in the state, but it had the largest increase over the past five years, a 32% spike.
Property crime and violent crime have different drivers, but high levels or growth in one category often corresponds with high levels or growth in the other. St. Joseph’s property crime rate rose by 8% over the last five years, one of the largest increases among all U.S. metro areas. .

26. Montana: Great Falls
> 5-yr. Change in crime rate: +46.0% (metro area) +38.5% (state)
> 2017 violent crimes per 100,000 people: 337 (metro area) 377 (state)
> 2017 murders: 5 (metro area) 41 (state)
> 2017 unemployment: 3.8% (metro area) 4% (state)
Violent crime is on the rise in Montana. The state’s violent crime rate spiked by nearly 39% in the last five years, fueled by climbing rates of violence Missoula, Billings, and Great Falls — the latter of which reported the largest increase. Driven largely by an increase in aggravated assaults, the violent crime rate surged by 46% in Great Falls between 2012 and 2017.
Despite the increase, both Great Falls and Montana remain safer than the U.S. as a whole. The violent crime rates of 337 per 100,000 in Great Falls and 377 per 100,000 across Montana compare favorably to the violent crime rate of 383 per 100,000 nationwide.
[in-text-ad]

27. Nebraska: None
> 5-yr. Change in crime rate: +17.9% (state)
> 2017 violent crimes per 100,000 people: 306 (state)
> 2017 murders: 43 (state)
> 2017 unemployment: 2.9% (state)
Omaha is the only metro area in Nebraska with comparable five year violent crime data. Between 2012 and 2017, the violent crime rate in Omaha fell by 5.6%, from 407 incidents per 100,000 residents to 385 per 100,000. The improvement was a departure from the broader statewide trend. Over the same period, the violent crime rate in Nebraska climbed by 17.9%.
If these trends continue, Omaha may soon become safer than the state as a whole. Currently, there are 385 violent crimes for every 100,000 people in Omaha, well above the violent crime rate across Nebraska of 306 per 100,000.
[recirclink id=488094]
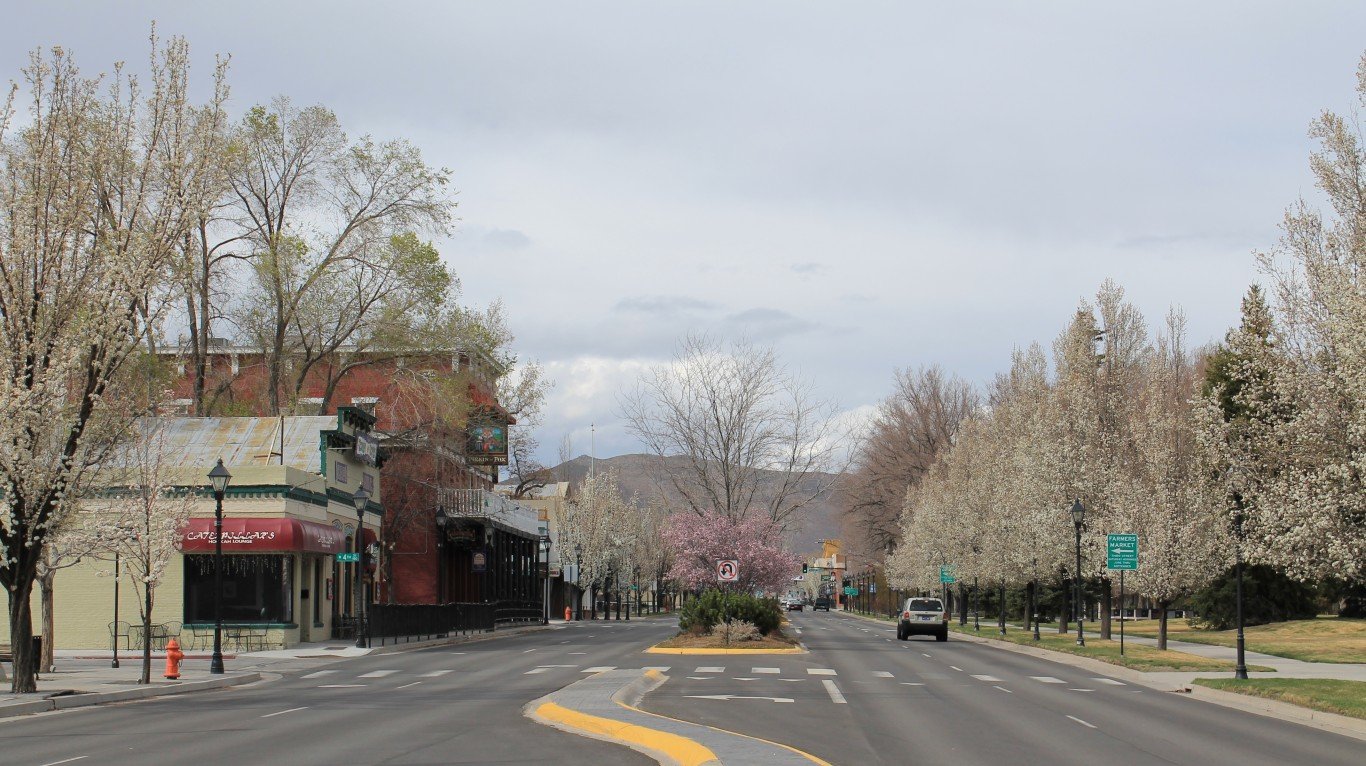
28. Nevada: Carson City
> 5-yr. Change in crime rate: +53.2% (metro area) -8.5% (state)
> 2017 violent crimes per 100,000 people: 360 (metro area) 556 (state)
> 2017 murders: 1 (metro area) 274 (state)
> 2017 unemployment: 5.1% (metro area) 5% (state)
Carson City’s population has declined by 2.1% over the last five years. Over the same period, the number of violent crimes in the metro area spiked from 132 to 198. As a result, the violent crime rate jumped by 53.2% in Carson City, the largest increase of any metro area in the state.
Despite the surge in violence, Carson City remains the safest metro area in the state. There were 360 violent crimes for every 100,000 people in Carson City in 2017 compared to 515 per 100,000 in Reno and 608 per 100,000 in Las Vegas.

29. New Hampshire: Manchester-Nashua
> 5-yr. Change in crime rate: +7.4% (metro area) +5.7% (state)
> 2017 violent crimes per 100,000 people: 266 (metro area) 199 (state)
> 2017 murders: 4 (metro area) 14 (state)
> 2017 unemployment: 2.6% (metro area) 2.7% (state)
Manchester-Nashua is the only metro area in New Hampshire. Driven by a climbing rates of rape and aggravated assault, the violent crime rate in the metro area climbed by 7.4% in the last five years. The increase also contributed to a 5.7% five-year uptick in violent crime across New Hampshire as a whole.
While violence is slightly more common in Manchester now than it was in 2012, property crimes are considerably less common. Between 2012 and 2017, the property crime rate in the metro area fell by 39.2%. The improvement was driven largely by declines in rates of larceny and burglary.
[in-text-ad-2]

30. New Jersey: None
> 5-yr. Change in crime rate: -21.2% (state)
> 2017 violent crimes per 100,000 people: 229 (state)
> 2017 murders: 324 (state)
> 2017 unemployment: 4.6% (state)
New Jersey is one of only a handful of states where no metro area with comparable data reported an increase in the incidence of violent crime from 2012 to 2017. The violent crime rate fell by 5% in Vineland, 16.6% in the capital of Trenton, and 21.2% across the state as a whole.
New Jersey is a far safer place than the U.S. as a whole. There were 229 violent crimes for every 100,000 residents in 2017, well below the national violent crime rate of 383 per 100,000. Vineland-Bridgeton is the most dangerous metro area in the state with a violent crime rate of 521 reported incidents per 100,000 people.
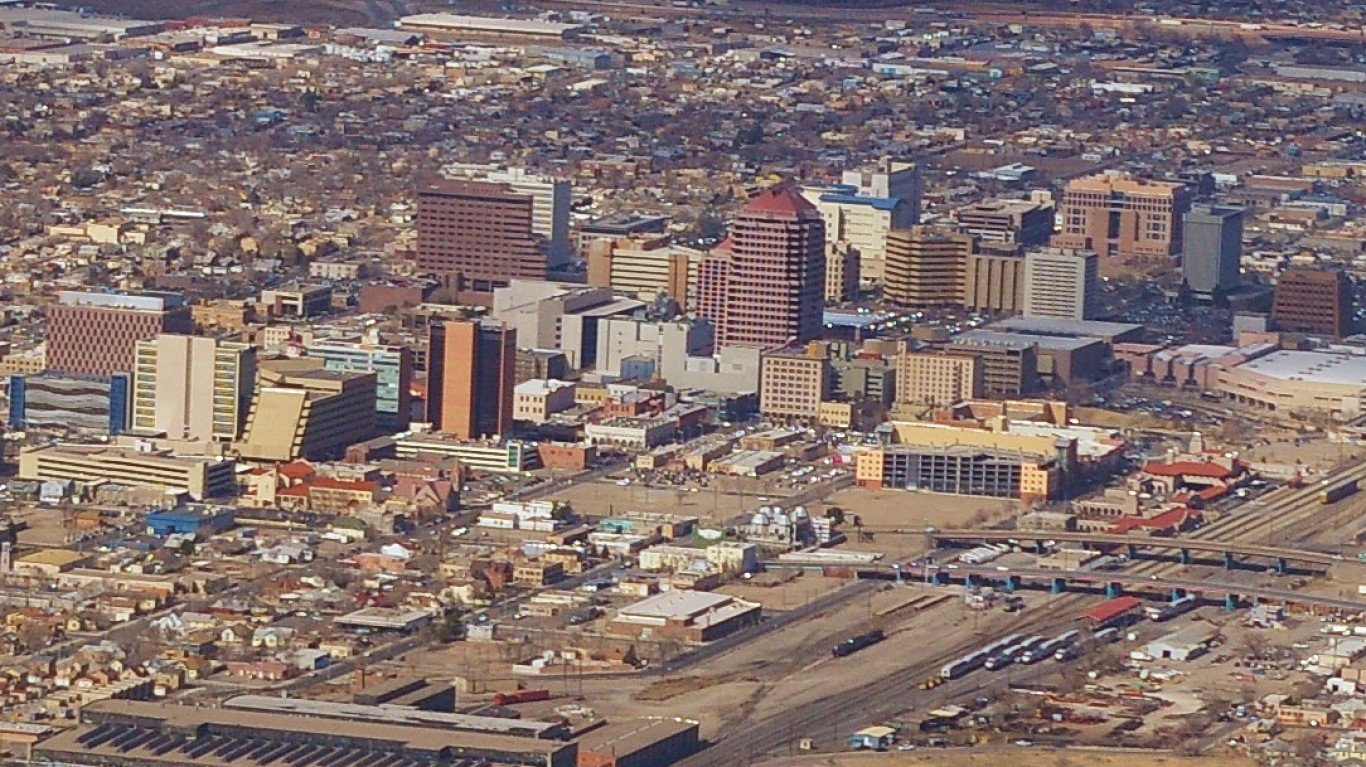
31. New Mexico: Albuquerque
> 5-yr. Change in crime rate: +68.2% (metro area) +40.1% (state)
> 2017 violent crimes per 100,000 people: 1,085 (metro area) 784 (state)
> 2017 murders: 81 (metro area) 148 (state)
> 2017 unemployment: 5.7% (metro area) 6.2% (state)
Albuquerque’s violent crime rate spiked by 68.2% over the last five years. Of the metro areas considered, Albuquerque ranked as the 18th most dangerous in the country five years ago. Now Albuquerque ranks third most dangerous, with a violent crime rate of 1,085 incidents for every 100,000 residents.
Overall, New Mexico is one of the most dangerous states, with a violent crime rate of 784 incidents per 100,000, second only to Alaska. Other nonviolent crimes are also common in the state. For example, over half of the 17,917 reported burglaries in the state in 2017 occured in Albuquerque. In an effort to reduce crime in New Mexico’s largest city, lawmakers gave Bernalillo County District Attorney Raul Torrez, whose jurisdiction includes Albuquerque, an additional $4 million during the 2018 legislative session. New Mexico outranks every other state on our list of the states with the most break-ins.
[in-text-ad]

32. New York: None
> 5-yr. Change in crime rate: -12.3% (state)
> 2017 violent crimes per 100,000 people: 357 (state)
> 2017 murders: 548 (state)
> 2017 unemployment: 4.7% (state)
Due to changes in reporting practices, no metro area in New York state has comparable crime data from 2012 to 2017. Over that period, the violent crime rate across the state as a whole fell by 12.3%. Five years ago, New York’s violent crime rate of 407 incidents per 100,000 people was higher than the national rate of 388 per 100,000 at the time. As of 2017, New York is safer than the nation as a whole, with 357 violent crimes per 100,000 people compared to 383 per 100,000 nationwide.
Even Buffalo’s violent crime rate of 376 reported incidents per 100,000 residents, the highest of any metro area in the state, falls below the U.S. violent crime rate. Of the 10 remaining metro areas in New York, Glens Falls is the safest, with a violent crime rate of just 144 incidents per 100,000 people.
[recirclink id=488247]

33. North Carolina: None
> 5-yr. Change in crime rate: +2.9% (state)
> 2017 violent crimes per 100,000 people: 364 (state)
> 2017 murders: 591 (state)
> 2017 unemployment: 4.6% (state)
Due to changes in reporting practices, no metro area in North Carolina has comparable crime data from 2012 to 2017. Across the state as a whole, the violent crime rate inched up by 2.9% over that period. Meanwhile, the U.S. violent crime rate fell by 1.3%. Despite the increase, North Carolina’s violent crime rate of 364 incidents per 100,000 people is below the national rate of 383 per 100,000.
In Charlotte-Concord-Gastonia, the only metro area in the state for which 2017 data is available, the violent crime rate is 416 incidents per 100,000 people. As is typically the case, aggravated assault is the most common type of violent crime in the metro area.

34. North Dakota: None
> 5-yr. Change in crime rate: +15.0% (state)
> 2017 violent crimes per 100,000 people: 281 (state)
> 2017 murders: 10 (state)
> 2017 unemployment: 2.6% (state)
Bismarck is the only metro area in North Dakota with crime data from 2012 comparable to that of 2017. Over that five year stretch, the violent crime rate in the state capital fell by 9.1%. The improvement was a departure from the broader trend, as North Dakota’s violent crime rate climbed by 15.0% over the same period.
Despite its crime rate declining, violence is more common in Bismarck than in Grand Forks and Fargo, the other two metro areas in the state. Crime is also more common in Bismarck than it is across the state as a whole. There were 322 violent crimes for every 100,000 Bismarck residents in 2017 compared to 281 per 100,000 across North Dakota.
[in-text-ad-2]
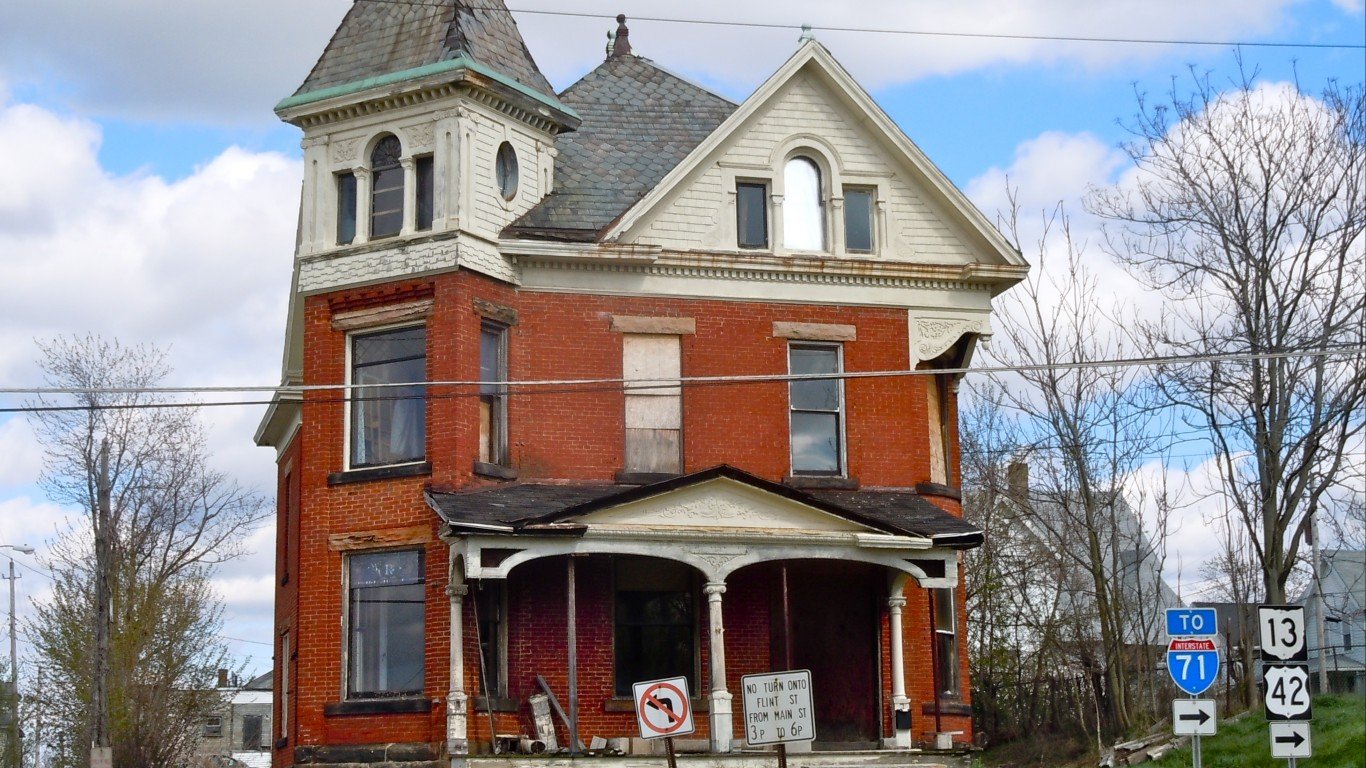
35. Ohio: Mansfield
> 5-yr. Change in crime rate: +37.2% (metro area) -0.7% (state)
> 2017 violent crimes per 100,000 people: 269 (metro area) 298 (state)
> 2017 murders: 7 (metro area) 710 (state)
> 2017 unemployment: 5.5% (metro area) 5% (state)
In most Ohio metro areas, violent crime rates either remained relatively flat or improved substantially over the last five years. Mansfield was a notable exception. The violent crime rate in the metro area climbed by 37.2% between 2012 and 2017. Despite the increase, Mansfield is safer than the state as a whole. There were 269 violent crimes for every 100,000 Mansfield residents in 2017 compared to 298 per 100,000 in Ohio. However, if crime rates continue to rise in Mansfield while they fall statewide, the metro area may not be safer than the state as a whole much longer.

36. Oklahoma: Tulsa
> 5-yr. Change in crime rate: +4.2% (metro area) -2.8% (state)
> 2017 violent crimes per 100,000 people: 566 (metro area) 456 (state)
> 2017 murders: 90 (metro area) 242 (state)
> 2017 unemployment: 4.5% (metro area) 4.3% (state)
All three of Oklahoma’s major metropolitan areas for which data is available — Oklahoma City, Lawton, and Tulsa — have above average violent crime rates, but while the rate declined in the first two cities over the last five years, it increased by 4.2% in Tulsa. The Northeast Oklahoma city ranks among the 50 worst in the country in all four categories of violent crime. It also had the 21st highest motor vehicle theft rate of any metro area in 2017.
[in-text-ad]

37. Oregon: Corvallis
> 5-yr. Change in crime rate: +25.1% (metro area) +13.8% (state)
> 2017 violent crimes per 100,000 people: 139 (metro area) 282 (state)
> 2017 murders: 3 (metro area) 104 (state)
> 2017 unemployment: 3.3% (metro area) 4.1% (state)
Of all metro areas in Oregon for which comparable data is available, Corvallis reported the steepest increase in violent crime over the last five years. The rates of rape, robbery, and aggravated assault all increased between 2012 and 2017, and the murder rate in the city more than doubled. Overall, the metro area’s violent crime rate climbed by 25.1% in the last five years, while the incidence of violence across the state as a whole increased 13.8%.
Despite the surge in violence, Corvallis is a safe city in a relatively safe state. The metro area’s violent crime rate of 139 incidents per 100,000 and Oregon’s violent crime rate of 282 per 100,000 are each well below the national rate of 383 per 100,000.
[recirclink id=488174]
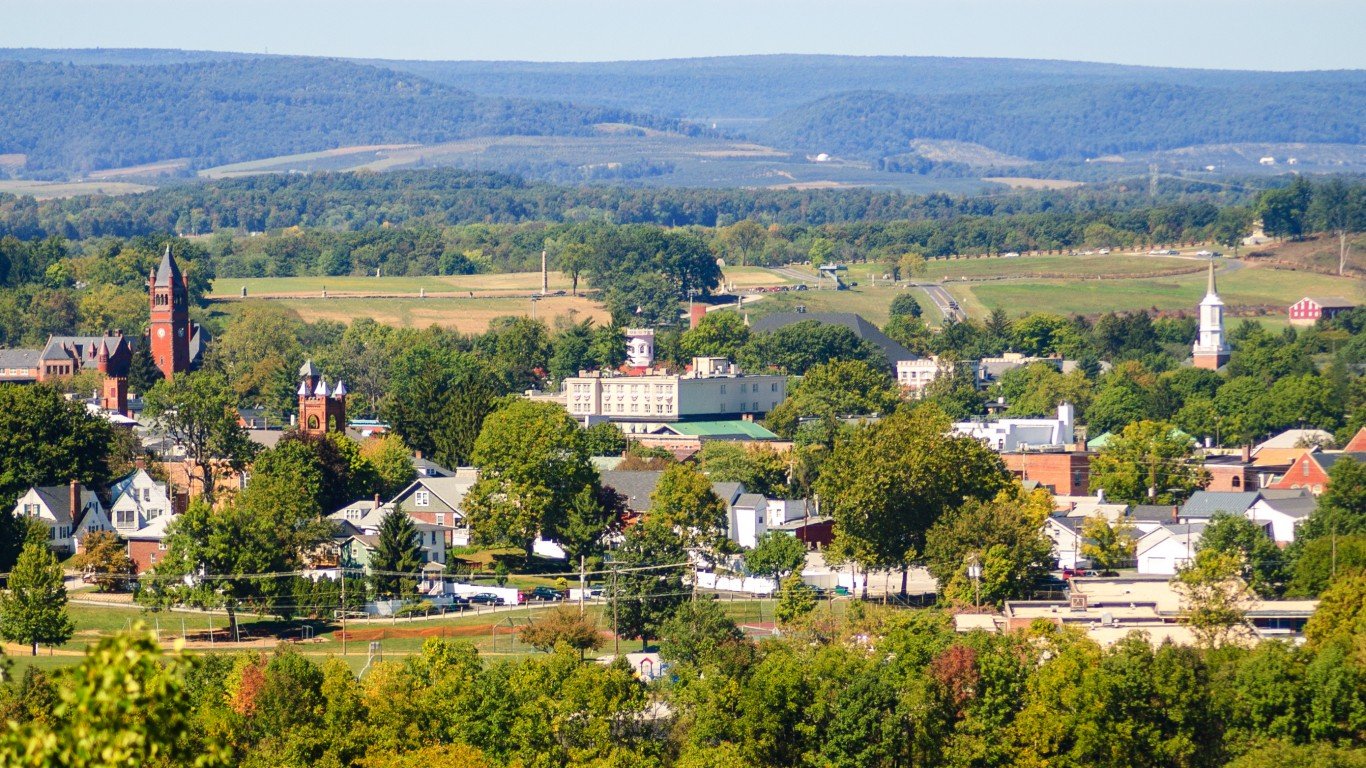
38. Pennsylvania: Gettysburg
> 5-yr. Change in crime rate: +27.7% (metro area) -10.2% (state)
> 2017 violent crimes per 100,000 people: 141 (metro area) 313 (state)
> 2017 murders: 1 (metro area) 739 (state)
> 2017 unemployment: 3.7% (metro area) 4.9% (state)
Pennsylvania’s violent crime rate fell by 10.2% between 2012 and 2017. Over that period, most cities in the state also reported declining crime rates. Gettysburg was a notable exception. Across the broader Gettysburg metro area, the violent crime rate increased by 27.7% between 2012 and 2017. Over that period, the robbery rate more than doubled, and the rape rate nearly doubled. Of the other 12 Pennsylvania metro areas for which comparable data is available, Lancaster is the only one to also report a sharp increase in violent crime. During the five-year period, Lancaster’s violent crime rate jumped by 24.1% to 208 incidents per 100,000 people — slightly higher than Gettysburg’s violent crime rate of 141 per 100,000.

39. Rhode Island: None
> 5-yr. Change in crime rate: -8.0% (state)
> 2017 violent crimes per 100,000 people: 232 (state)
> 2017 murders: 20 (state)
> 2017 unemployment: 4.5% (state)
Rhode Island’s lone major metropolitan area, Providence, has a history of organized crime. Despite this, crime is both uncommon and on the decline in the state capital. The city’s rates of murder, robbery, and aggravated assault each fell by more than 10% over the last five years. Property crime in the city also fell substantially over that period, including a nearly 50% decline in the burglary rate.
Falling crime in Providence might be due to an improving employment situation in the city. In 2012, 10% of Providence’s labor force was unemployed, roughly 2 percentage points above the national annual unemployment rate that year. As of 2017, Providence’s unemployment rate had fallen to 4.5%, roughly in line with the national unemployment rate.
[in-text-ad-2]

40. South Carolina: Florence
> 5-yr. Change in crime rate: +53.7% (metro area) -9.4% (state)
> 2017 violent crimes per 100,000 people: 836 (metro area) 506 (state)
> 2017 murders: 48 (metro area) 390 (state)
> 2017 unemployment: 4.8% (metro area) 4.3% (state)
Between 2012 and 2017, the number of people living in Florence, South Carolina, fell by 0.9%. Despite the population decline, the number of violent crimes in the city climbed from 1,132 to 1,724. As a result, the violent crime rate across the broader metro area surged by 53.7%, and Florence now ranks among the most dangerous metro areas in the United States. There were 836 violent crimes for every 100,000 Florence residents in 2017, more than double the 383 per 100,000 national violent crime rate.
Florence’s surging crime rate was a stark departure from the broader trend across the state as a whole. Over the last five years, every other metro area in South Carolina with comparable data reported a decline in violent crime, and the state’s violent crime rate improved by 9.4%.
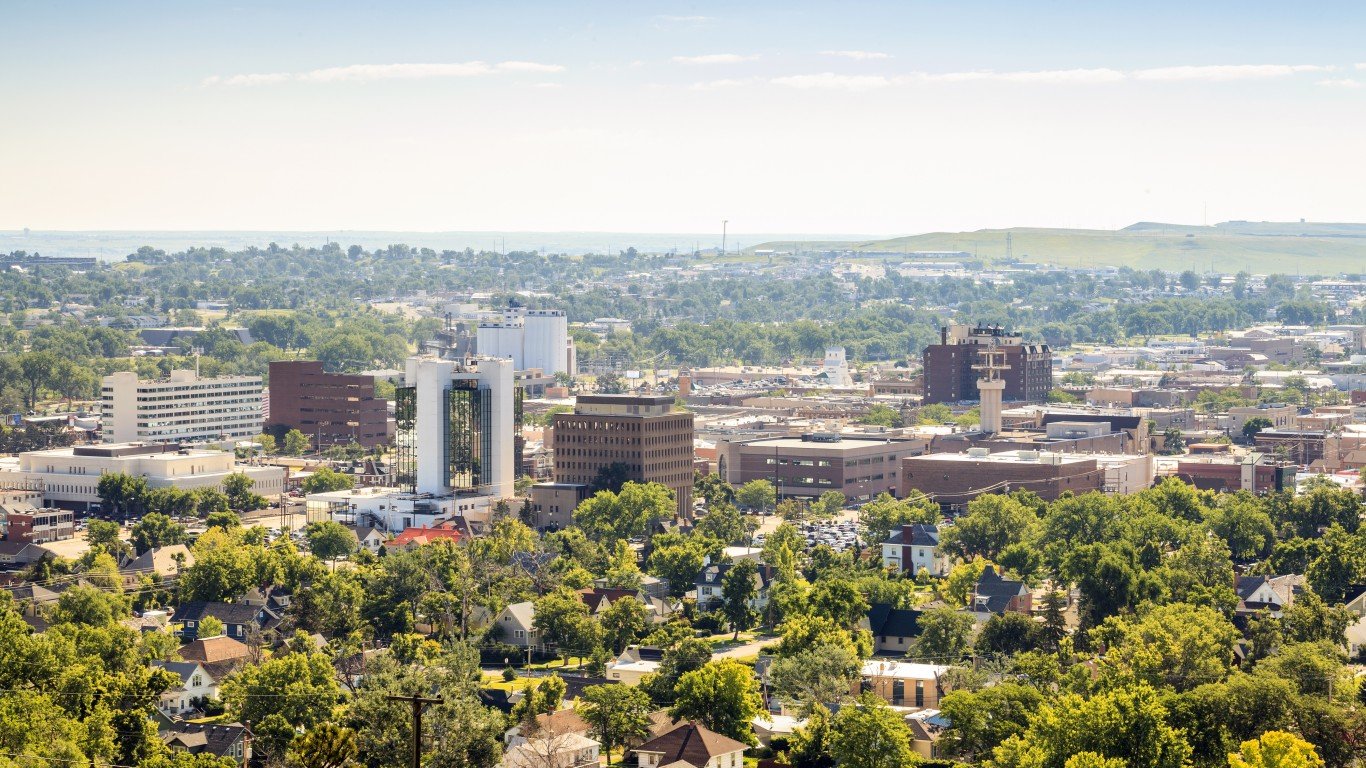
41. South Dakota: Rapid City
> 5-yr. Change in crime rate: +25.5% (metro area) +34.7% (state)
> 2017 violent crimes per 100,000 people: 480 (metro area) 434 (state)
> 2017 murders: 7 (metro area) 25 (state)
> 2017 unemployment: 3.5% (metro area) 3.3% (state)
The violent crime rate climbed by 25.5% in Rapid City, South Dakota, over the last five years. In Sioux Falls, the only other metro area in the state, the violent crime rate rose by a relatively modest 17.2%. Rapid City is also more dangerous than Sioux Falls. There were 480 violent crimes for every 100,000 metro area residents in 2017 compared to 355 per 100,000 in Sioux Falls. There were 434 violent crimes in for every 100,000 people across South Dakota as a whole.
As violent crime rates climbed in Rapid City, the overall property crime rate fell by 16.6%. Not all property crime rates improved, however. Motor vehicle theft became 33.9% more common in the last five years — and Rapid City has the dubious distinction of being the motor vehicle theft capital of the state.
[in-text-ad]

42. Tennessee: Memphis
> 5-yr. Change in crime rate: +10.6% (metro area) +1.2% (state)
> 2017 violent crimes per 100,000 people: 1,168 (metro area) 652 (state)
> 2017 murders: 220 (metro area) 527 (state)
> 2017 unemployment: 4.3% (metro area) 3.7% (state)
Tennessee has the third highest violent crime rate of any state, and Memphis is one of the major reasons why. Memphis had the highest violent crime rate of any U.S. city in 2012, and things have only gotten worse. The city’s violent crime rate rose from 1,056 incidents per 100,000 residents in 2012 to 1,168 to per 100,000 in 2017.
While murder represents a small share of total violent crimes, it is worth noting that the number of homicides in Memphis increased by more than 40%, from 155 to 220.
[recirclink id=487977]

43. Texas: Amarillo
> 5-yr. Change in crime rate: +20.6% (metro area) +7.4% (state)
> 2017 violent crimes per 100,000 people: 634 (metro area) 439 (state)
> 2017 murders: 17 (metro area) 1,412 (state)
> 2017 unemployment: 3.0% (metro area) 4.3% (state)
After reporting a 20.6% surge in violent crime, Amarillo is now one of the most dangerous metro areas in Texas, second only to Odessa. There were 634 violent crimes for every 100,000 people in Amarillo in 2017 — well above the 439 per 100,000 statewide violent crime rate and the 383 per 100,00 national rate.
Though, overall, violent crime increased in Amarillo, not all types of violent crime became more common in the metro area. The robbery rate fell by by 14.9% between 2012 and 2017. The improvement was not nearly enough to offset the rates of rape, aggravated assault, and homicide, which soared over the same period by 82.8%, 22.9%, and 52.4%, respectively.
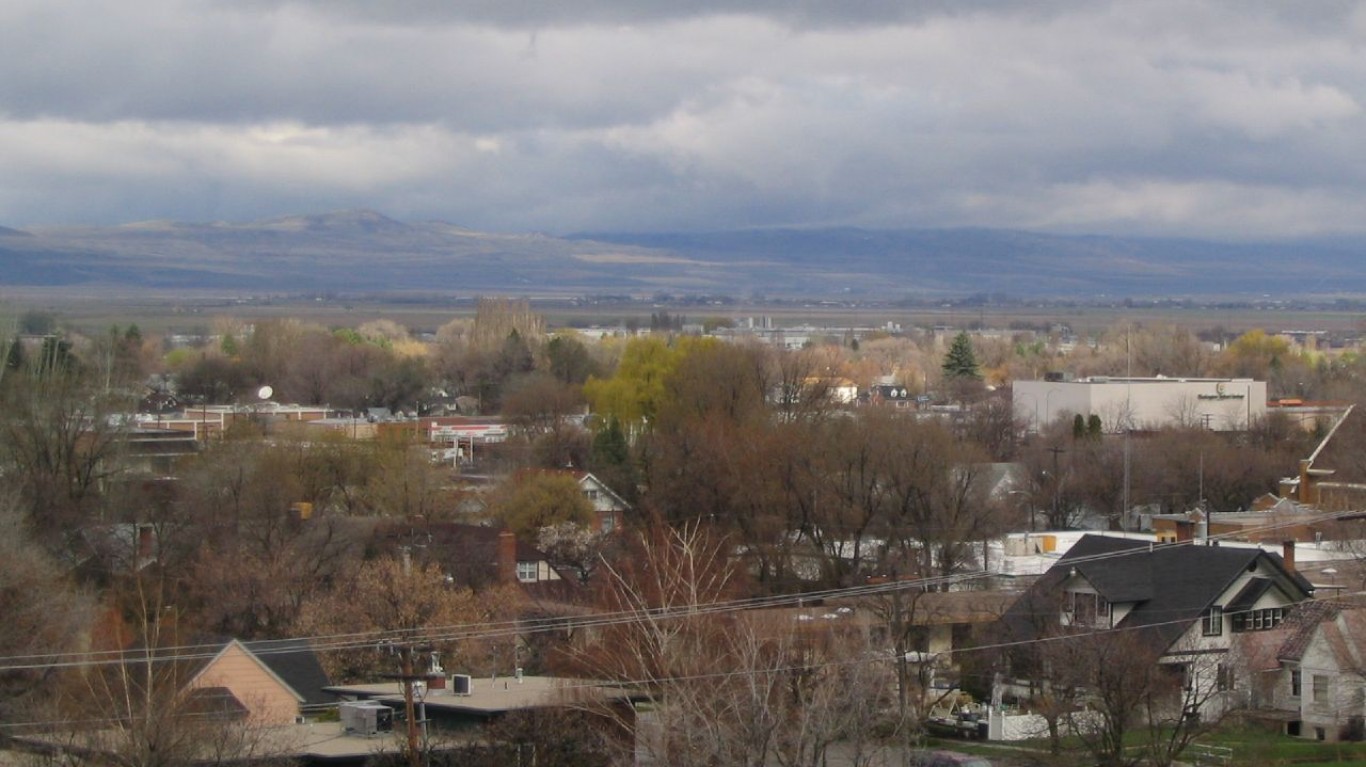
44. Utah: Logan
> 5-yr. Change in crime rate: +49.3% (metro area) +16.1% (state)
> 2017 violent crimes per 100,000 people: 80 (metro area) 239 (state)
> 2017 murders: 4 (metro area) 73 (state)
> 2017 unemployment: 2.7% (metro area) 3.2% (state)
The violent crime rate soared by nearly 50% in Logan, Utah, between 2012 and 2017, the largest increase of any metro area in the state. The increase was driven almost entirely by a 123.6% surge in the metro area’s rape rate. Despite the increasing violent crime rate, Logan remains one of the safest cities in the United States. There were only 80 violent crimes for every 100,000 people in the city in 2017, about a fifth of the national violent crime rate of 383 per 100,000.
[in-text-ad-2]

45. Vermont: None
> 5-yr. Change in crime rate: 14.0% (state)
> 2017 violent crimes per 100,000 people: 143 (state)
> 2017 murders: 8 (state)
> 2017 unemployment: 3.0% (state)
The three safest states in the country are located in the New England region, and Vermont is one of them. There were 143 violent crimes for every 100,000 people in the state in 2017 — the second lowest rate of any state and less than half the national violent crime rate of 383 per 100,000.
Burlington, the only metro area in the Green Mountain State, lacks comparable crime data between 2012 and 2017. Burlington’s 2017 violent crime rate of 178 incidents per 100,000 people, while higher than the statewide rate, is well below the U.S. violent crime rate. As is the case across Vermont, aggravated assault is most commonly reported crime in Burlington.

46. Virginia: Lynchburg
> 5-yr. Change in crime rate: +23.4% (metro area) +9.5% (state)
> 2017 violent crimes per 100,000 people: 192 (metro area) 208 (state)
> 2017 murders: 7 (metro area) 453 (state)
> 2017 unemployment: 4.3% (metro area) 3.8% (state)
Violent crime is a relatively minor issue in Virginia compared to most states. The state’s violent crime rate of 208 incidents per 100,000 residents is the fourth lowest among states, and all six metro areas with available data in the state have violent crime rates below the national rate.
The violent crime rate in Lynchburg increased by 23.4% in the past five years, but even with that increase, the metro area’s violent crime rate of 192 incidents per 100,000 people is still well below the national rate. Lynchburg’s robbery rate of 25 incidents per 100,000 residents is just slightly over one-quarter of the national robbery rate of 98 robberies per 100,000 Americans.
[in-text-ad]

47. Washington: Walla Walla
> 5-yr. Change in crime rate: +46.6% (metro area) +3.0% (state)
> 2017 violent crimes per 100,000 people: 336 (metro area) 305 (state)
> 2017 murders: 1 (metro area) 230 (state)
> 2017 unemployment: 5.0% (metro area) 4.8% (state)
Violent crime is more common now in most of the metro areas in Washington than it was half a decade ago. Overall, the violent crime rate inched up by 3.0% across the state between 2012 and 2017. Of the state’s 11 metro areas with a comparable crime data, Walla Walla reported the largest increase in violent crime over the last five years. Driven by increases in reported rapes and aggrevated assaults, the violent crime rate in Walla Walla surged by 46.6%.
Despite increased rates of violence across the state, every metro area in Washington — including Walla Walla — has a lower violent crime rate than the national rate of 383 per 100,000.
[recirclink id=487572]
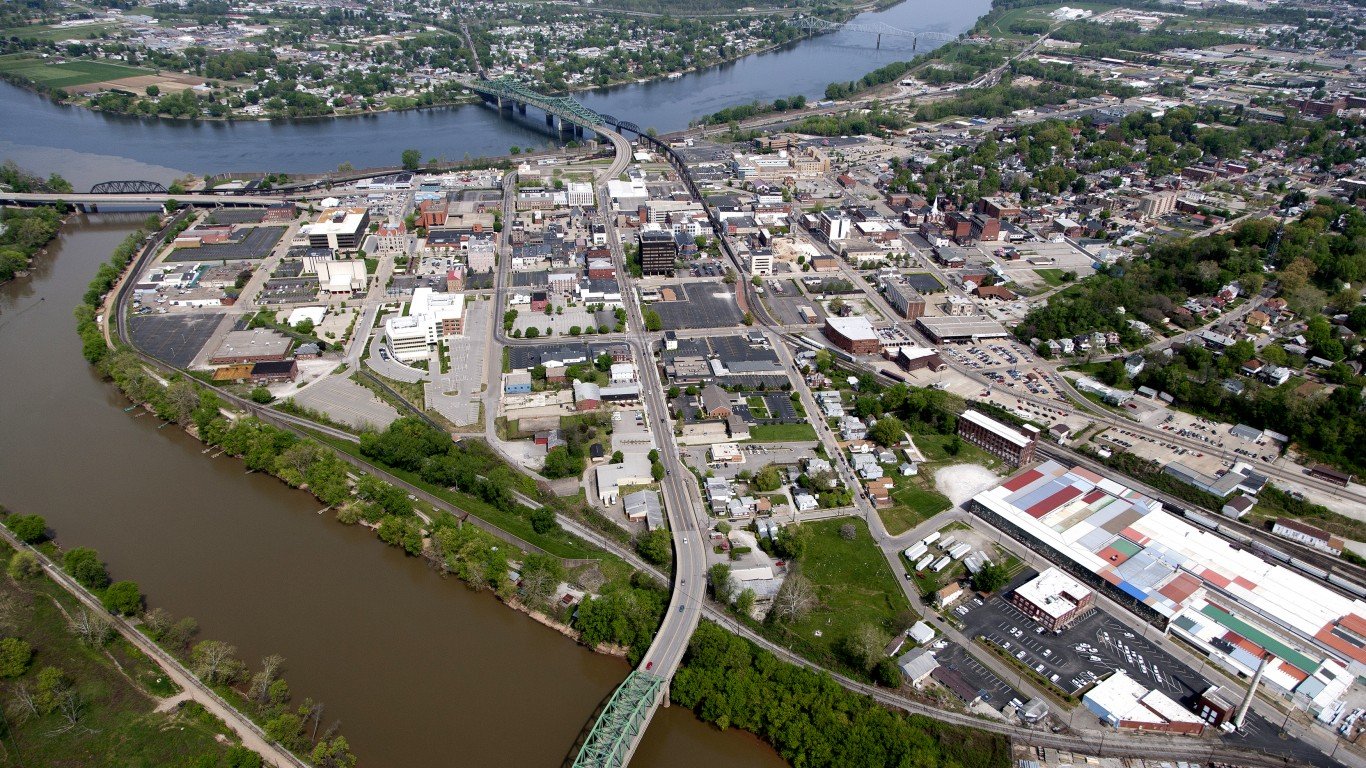
48. West Virginia: Parkersburg-Vienna
> 5-yr. Change in crime rate: +29.3% (metro area) +10.9% (state)
> 2017 violent crimes per 100,000 people: 436 (metro area) 351 (state)
> 2017 murders: 8 (metro area) 85 (state)
> 2017 unemployment: 5.6% (metro area) 5.2% (state)
Of West Virginia’s four metropolitan areas with available data, only the Parkersburg-Vienna area has a violent crime rate higher than the national rate of 382 incidents per 100,000 people. Parkersburg is also the state’s metro area with the largest increase in violent crime over the last five years.
The rise in violent crime has been uneven in the metro area. Aggravated assault represents the most common type of violent crime, and Parkersburg’s violent crime increase is due mostly to a 35% surge in the aggravated assault rate. Meanwhile, the robbery rate in Parkersburg plummeted.

49. Wisconsin: Wausau
> 5-yr. Change in crime rate: +28.1% (metro area) +14.0% (state)
> 2017 violent crimes per 100,000 people: 160 (metro area) 320 (state)
> 2017 murders: 4 (metro area) 186 (state)
> 2017 unemployment: 3.0% (metro area) 3.3% (state)
The violent crime rate increased in five metro areas in Wisconsin over the last five years. Nowhere did rates of violence increase faster in the state than Wausau. The central Wisconsin metro area reported a 28.1% increase in the incidence of violent crime between 2012 and 2017. Across the state as a whole, the violent crime rate increased by a relatively modest 14.0%.
Despite the increase, Wausau remains a relatively safe city. There were just 160 violent crimes for every 100,000 area residents in 2017 — a fraction of the violent crime rate of 681 per 100,000 in Milwaukee, the most dangerous metro area in Wisconsin.
[in-text-ad-2]

50. Wyoming: Cheyenne
> 5-yr. Change in crime rate: +22.4% (metro area) +17.9% (state)
> 2017 violent crimes per 100,000 people: 295 (metro area) 238 (state)
> 2017 murders: 5 (metro area) 15 (state)
> 2017 unemployment: 3.7% (metro area) 4.2% (state)
The violent crime rate climbed by 17.9% in Wyoming between 2012 and 2017, rising in each of state’s metro areas — by 11.9% in Casper and 28.1% in Cheyenne. Not only did Cheyenne have the largest increase in the incidence of violent crime, but also it is the most dangerous metro area in the state. There were 295 violent crimes for every 100,000 people in Cheyenne in 2017 compared to 220 per 100,000 in Casper and 238 per 100,000 across the state.
Cheyenne also has Wyoming’s highest property crime rate. There were 2,843 property crimes for every 100,000 people in Cheyenne in 2017, compared to 2,615 per 100,000 in Casper.
Methodology
Based on figures published by the FBI’s Uniform Crime Report, 24/7 Wall St. identified the metropolitan statistical area where crime rates rose the most in each state from 2012 to 2017. In order to be considered, areas had to retain the same geographic boundaries during the period covered, and they had to retain consistent reporting practices. A number of states have no metropolitan areas that met these criteria. These states were Minnesota, New York, North Carolina, and Vermont. In addition, seven other states have no metropolitan area where the violent crime rate increased between 2012 and 2017. We also reviewed annual unemployment figures from the Bureau of Labor Statistics for 2012 and 2017 as well as unemployment figures from December 2018. We also considered data from the Census Bureau’s 2017 American Community Survey on household income, educational attainment rates, and poverty.
Contact [email protected] for any questions or corrections.