[cnxvideo id=”847796″ placement=”ros”]Almost one in four American households reported being food insecure at some point in 2017.
Low-income households with children and Americans with disabilities are among the most likely to be food insecure. However, thanks to the Supplemental Nutrition Assistance Program — or SNAP — many of these Americans do not go hungry.
SNAP began as a temporary relief program during the Great Depression and became a permanent assistance program in 1964 under President Lyndon Johnson. In its first year, the Food Stamp Program, as it was then known, had a budget of $75 million. As of fiscal 2017, the SNAP budget soared to $70 billion.
One of the most widely used federal programs, SNAP helped over 40 million Americans afford groceries in a typical month in 2018. The size and scope of the SNAP program, however, is not static. During the Great Recession, the number of SNAP-eligible households increased considerably, as did the recipiency rate. But economic conditions have improved, and SNAP recipiency has fallen in each of the last five years.
Because the size of the SNAP caseload is closely tied to the strength of the economy, varying social and economic conditions can affect recipiency on a regional level. 24/7 Wall St. reviewed recipiency rates in all U.S. metro areas to identify the cities where the largest share of people rely on SNAP benefits to afford food. As might be expected, many of the places on this list are low income areas. These are the cities with the highest poverty rates.
Nationwide, 11.7% of Americans rely on SNAP benefits. In several cities on this list, the SNAP recipiency rate is more than double the national rate.
Not only do the vast majority of cities on this list have higher unemployment than the national average, but many are also home to large shares of the most vulnerable populations, including poor single-parent families, the disabled, adults with less than a high school education, and retirees on a low fixed income. SNAP recipiency rates tend to be higher in cities in the South and Western United States. They also tend to be higher in places with weak economic conditions, like high unemployment. To be sure, two metro areas on this list are located — at least partially — in the state with the worst economy.
In addition to federally funded SNAP benefits, state governments offer welfare to families in need. However, some states are less generous in the benefit amount, some more restrictive in who is eligible, and some would provide benefits for shorter duration. While some states provide generous help to needy residents, these are the states where welfare helps the fewest families.
Click here to see the cities with the most people on food stamps
Click here to read our methodology
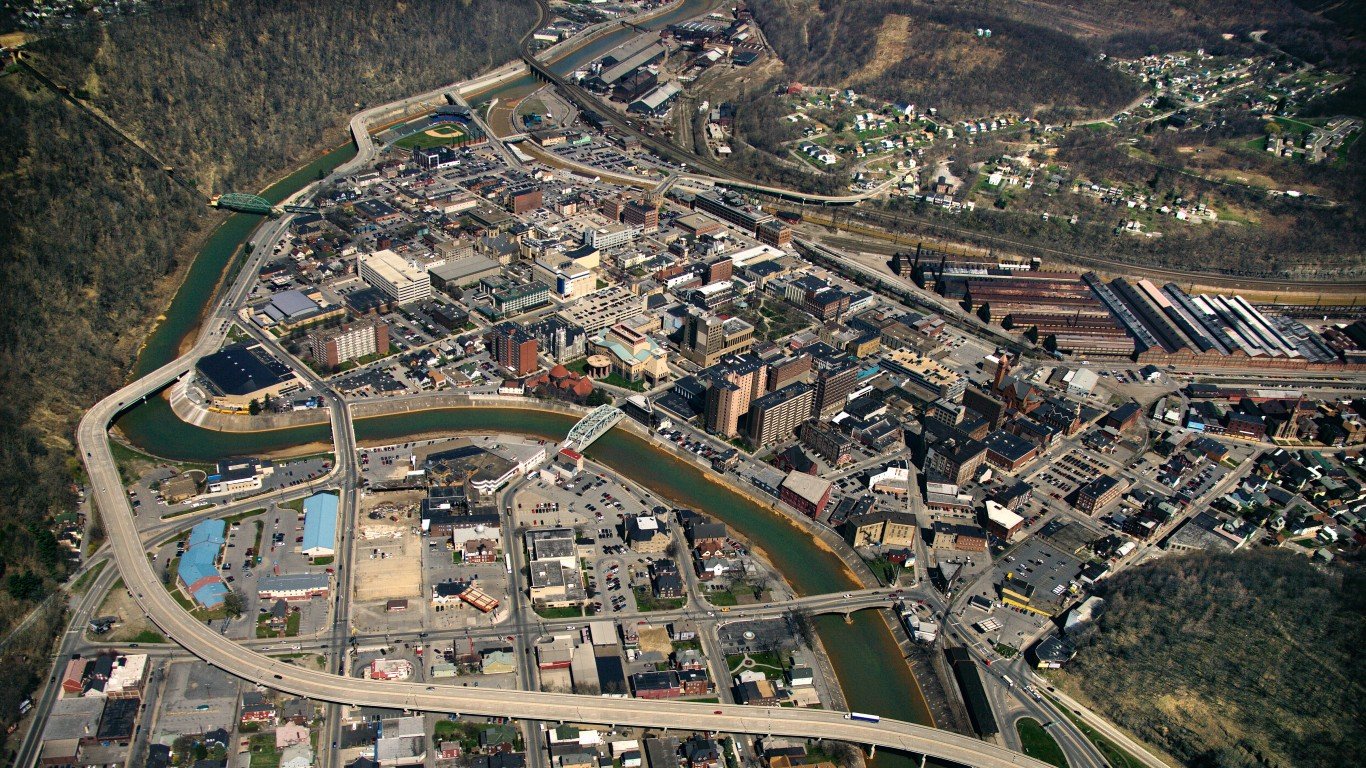
28. Johnstown, PA
> Households with SNAP benefits: 18.7%
> Poverty rate: 15.1%
> Pop. with a disability: 17.8% (highest 20%)
> May unemployment: 4.3% (highest 20%)
[in-text-ad]
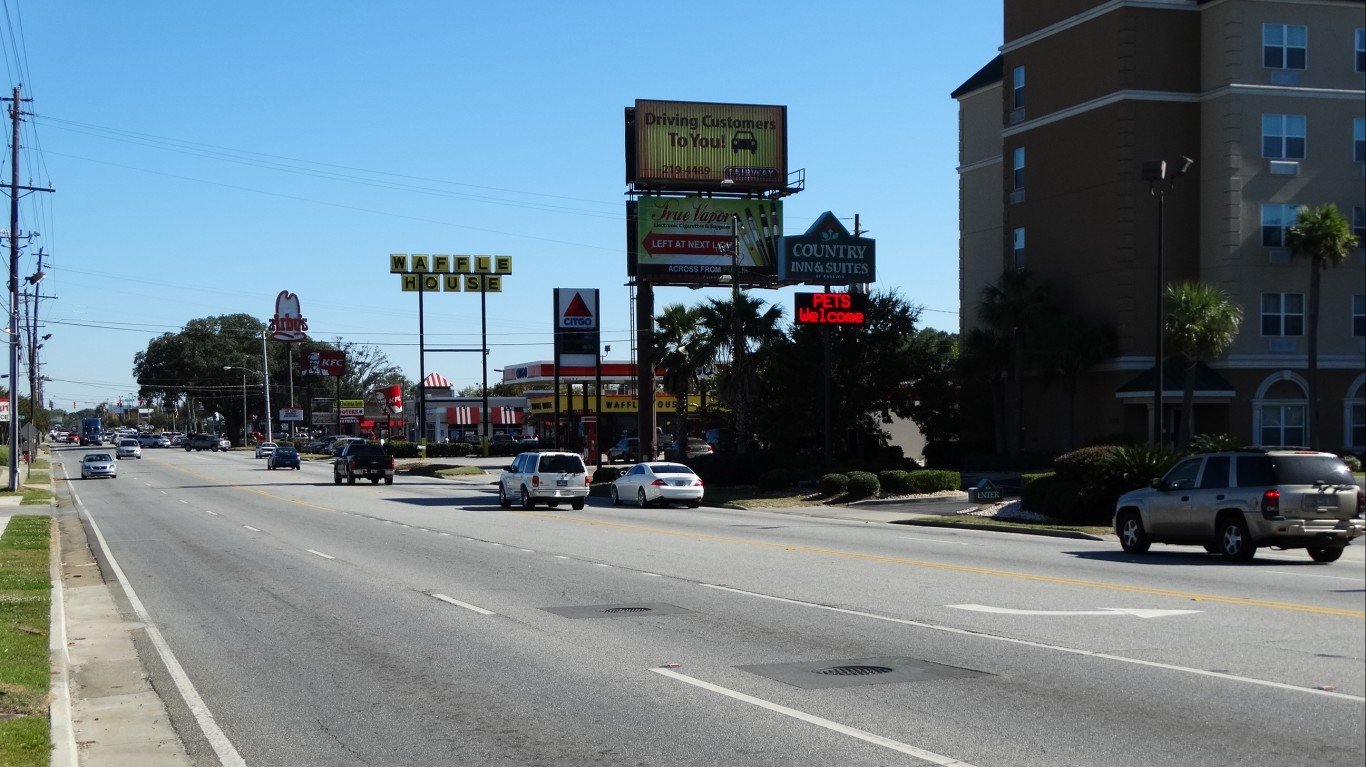
27. Valdosta, GA
> Households with SNAP benefits: 18.8%
> Poverty rate: 26.0% (highest 10%)
> Pop. with a disability: 10.1% (lowest 20%)
> May unemployment: 3.3%
[recirclink id=506264]
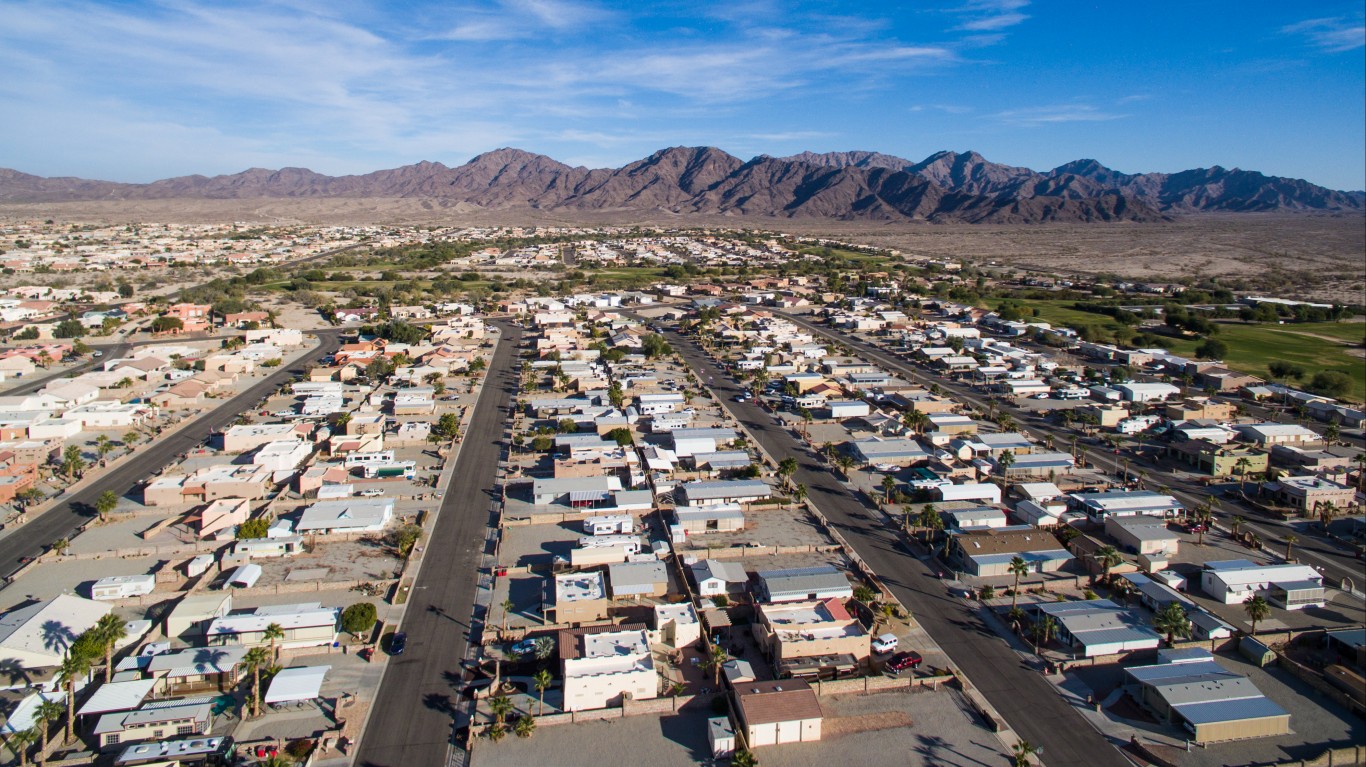
26. Yuma, AZ
> Households with SNAP benefits: 18.9%
> Poverty rate: 18.3% (highest 20%)
> Pop. with a disability: 12.0%
> May unemployment: 17.1% (highest 10%)

25. Rocky Mount, NC
> Households with SNAP benefits: 18.9%
> Poverty rate: 18.6% (highest 20%)
> Pop. with a disability: 16.8% (highest 20%)
> May unemployment: 5.5% (highest 10%)
[in-text-ad-2]

24. Pueblo, CO
> Households with SNAP benefits: 18.9%
> Poverty rate: 18.1% (highest 20%)
> Pop. with a disability: 20.3% (highest 10%)
> May unemployment: 3.7%

23. Goldsboro, NC
> Households with SNAP benefits: 19.0%
> Poverty rate: 21.2% (highest 10%)
> Pop. with a disability: 16.5%
> May unemployment: 4.4% (highest 20%)
[in-text-ad]
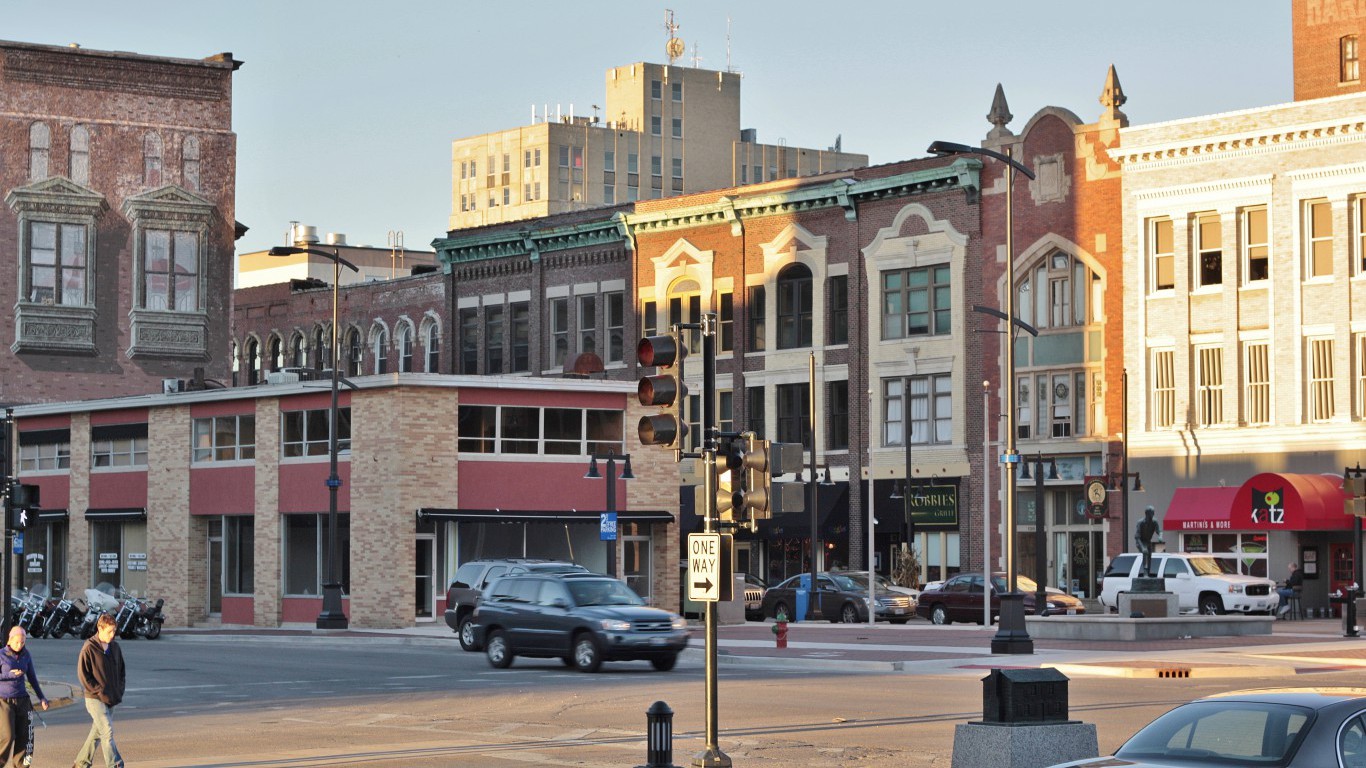
22. Decatur, IL
> Households with SNAP benefits: 19.0%
> Poverty rate: 12.8%
> Pop. with a disability: 15.6%
> May unemployment: 4.5% (highest 20%)
[recirclink id=552140]

21. Altoona, PA
> Households with SNAP benefits: 19.1%
> Poverty rate: 14.6%
> Pop. with a disability: 20.1% (highest 10%)
> May unemployment: 3.5%

20. Florence, SC
> Households with SNAP benefits: 19.3%
> Poverty rate: 19.3% (highest 20%)
> Pop. with a disability: 18.0% (highest 20%)
> May unemployment: 3.6%
[in-text-ad-2]

19. El Paso, TX
> Households with SNAP benefits: 19.3%
> Poverty rate: 21.1% (highest 10%)
> Pop. with a disability: 12.1%
> May unemployment: 3.2%

18. Grants Pass, OR
> Households with SNAP benefits: 19.4%
> Poverty rate: 17.4%
> Pop. with a disability: 18.7% (highest 10%)
> May unemployment: 4.3% (highest 20%)
[in-text-ad]

17. Beckley, WV
> Households with SNAP benefits: 19.7%
> Poverty rate: 20.0% (highest 10%)
> Pop. with a disability: 26.1% (highest 10%)
> May unemployment: 4.5% (highest 20%)
[recirclink id=526426]

16. Huntington-Ashland, WV-KY-OH
> Households with SNAP benefits: 19.8%
> Poverty rate: 20.9% (highest 10%)
> Pop. with a disability: 21.1% (highest 10%)
> May unemployment: 4.5% (highest 20%)

15. Merced, CA
> Households with SNAP benefits: 19.9%
> Poverty rate: 23.8% (highest 10%)
> Pop. with a disability: 13.4%
> May unemployment: 7.3% (highest 10%)
[in-text-ad-2]

14. Springfield, MA
> Households with SNAP benefits: 20.1%
> Poverty rate: 15.5%
> Pop. with a disability: 15.9%
> May unemployment: 0.0% (highest 10%)

13. Fresno, CA
> Households with SNAP benefits: 20.2%
> Poverty rate: 21.1% (highest 10%)
> Pop. with a disability: 14.6%
> May unemployment: 6.4% (highest 10%)
[in-text-ad]

12. Farmington, NM
> Households with SNAP benefits: 21.2%
> Poverty rate: 24.8% (highest 10%)
> Pop. with a disability: 14.8%
> May unemployment: 4.9% (highest 10%)
[recirclink id=520373]

11. Longview, WA
> Households with SNAP benefits: 21.7%
> Poverty rate: 17.2%
> Pop. with a disability: 23.8% (highest 10%)
> May unemployment: 6.2% (highest 10%)
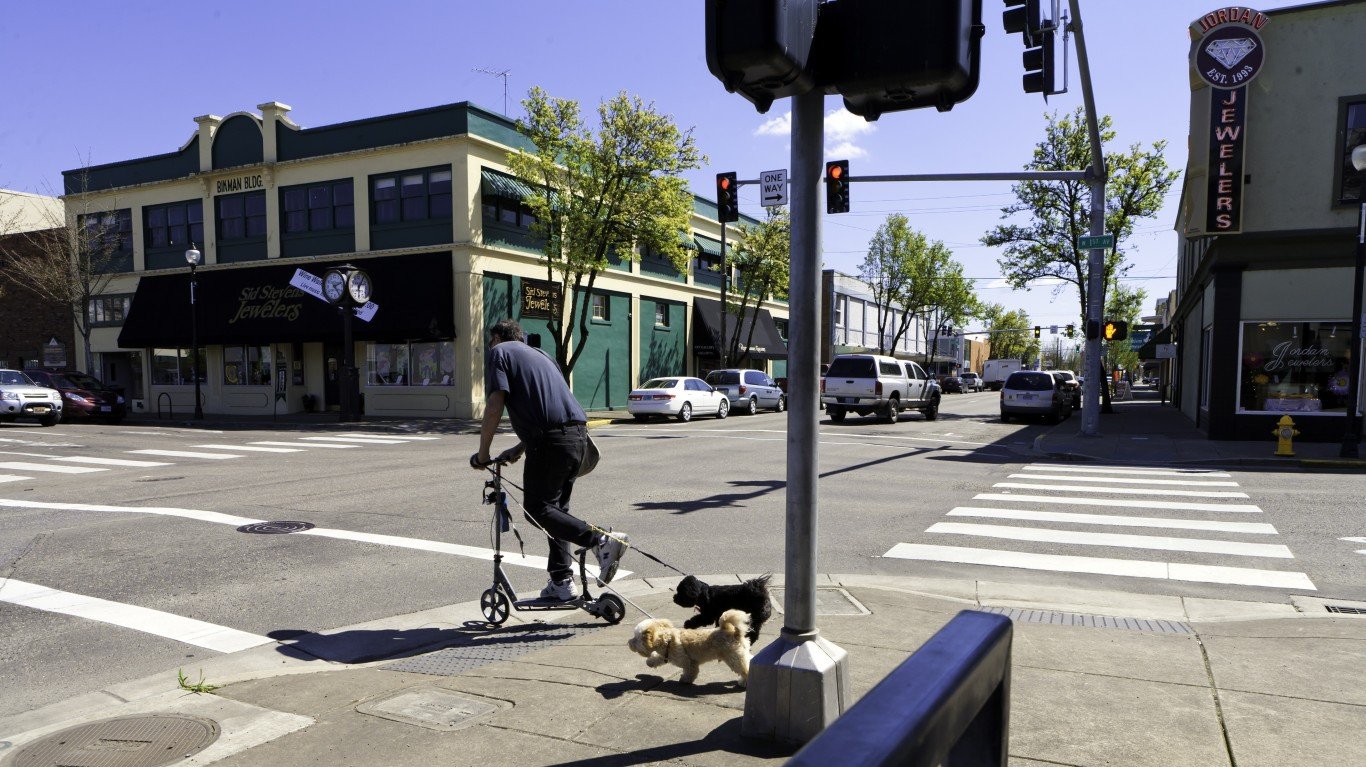
10. Albany, OR
> Households with SNAP benefits: 22.0%
> Poverty rate: 14.6%
> Pop. with a disability: 15.6%
> May unemployment: 3.8%
[in-text-ad-2]
9. El Centro, CA
> Households with SNAP benefits: 22.5%
> Poverty rate: 20.7% (highest 10%)
> Pop. with a disability: 15.4%
> May unemployment: 16.4% (highest 10%)
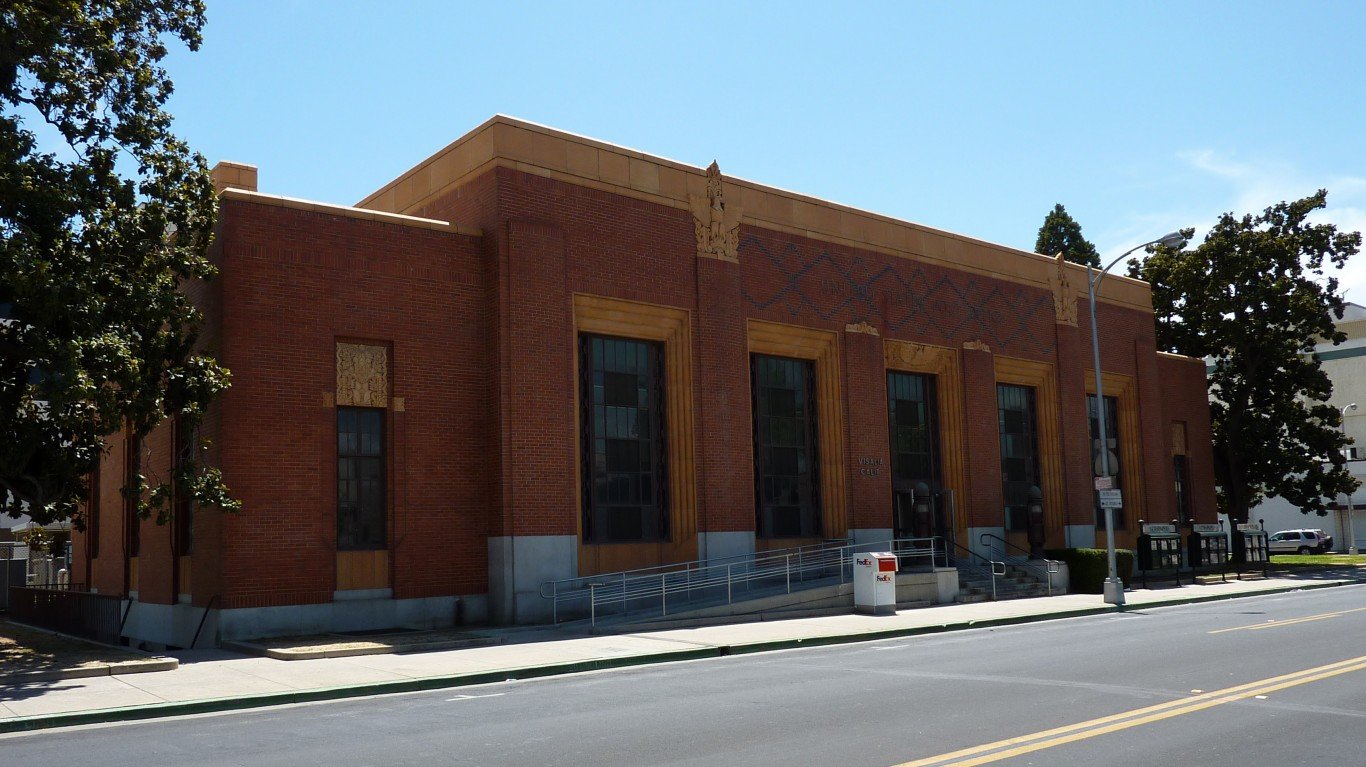
8. Visalia-Porterville, CA
> Households with SNAP benefits: 22.7%
> Poverty rate: 24.6% (highest 10%)
> Pop. with a disability: 11.1% (lowest 20%)
> May unemployment: 8.1% (highest 10%)
[in-text-ad]
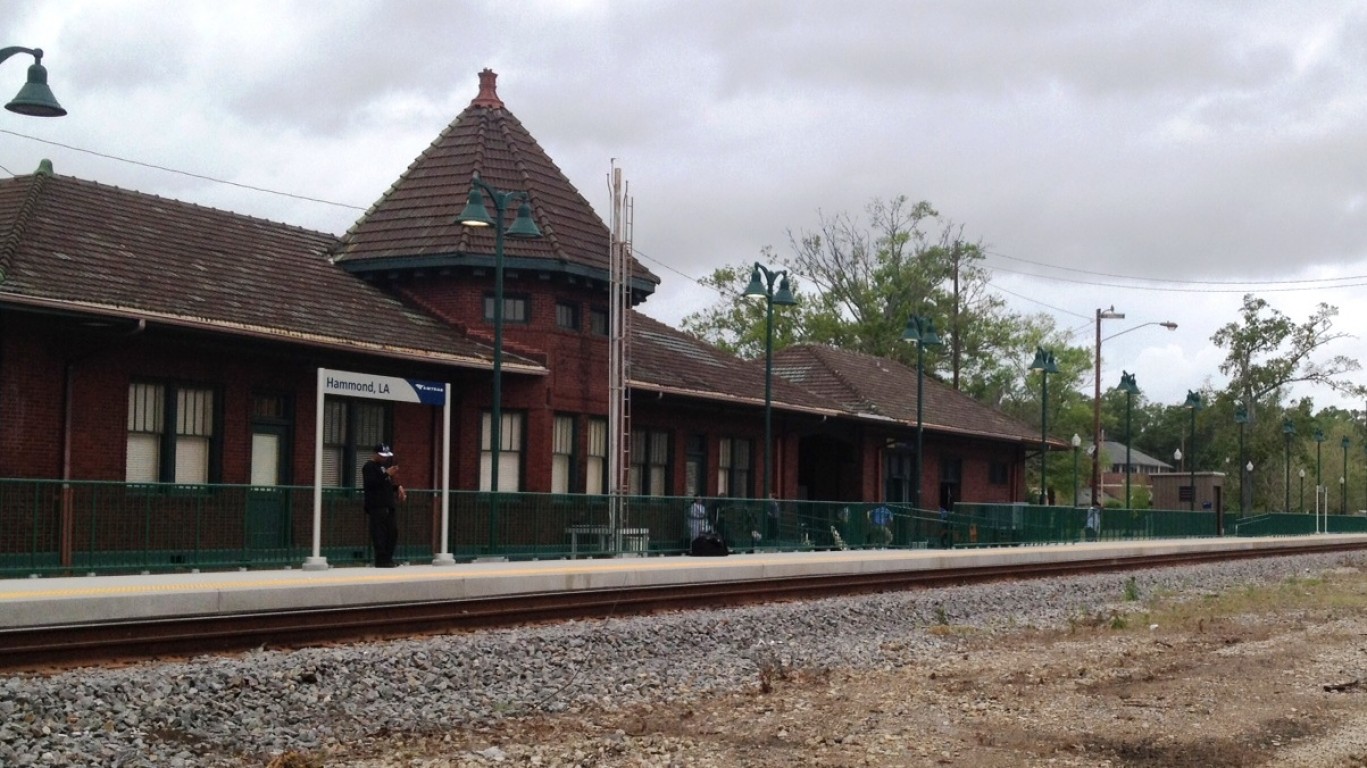
7. Hammond, LA
> Households with SNAP benefits: 22.7%
> Poverty rate: 20.7% (highest 10%)
> Pop. with a disability: 20.0% (highest 10%)
> May unemployment: 4.6% (highest 20%)
[recirclink id=497115]
6. Brownsville-Harlingen, TX
> Households with SNAP benefits: 22.8%
> Poverty rate: 27.9% (highest 10%)
> Pop. with a disability: 12.7%
> May unemployment: 4.6% (highest 20%)

5. Albany, GA
> Households with SNAP benefits: 24.1%
> Poverty rate: 24.7% (highest 10%)
> Pop. with a disability: 15.8%
> May unemployment: 4.2%
[in-text-ad-2]

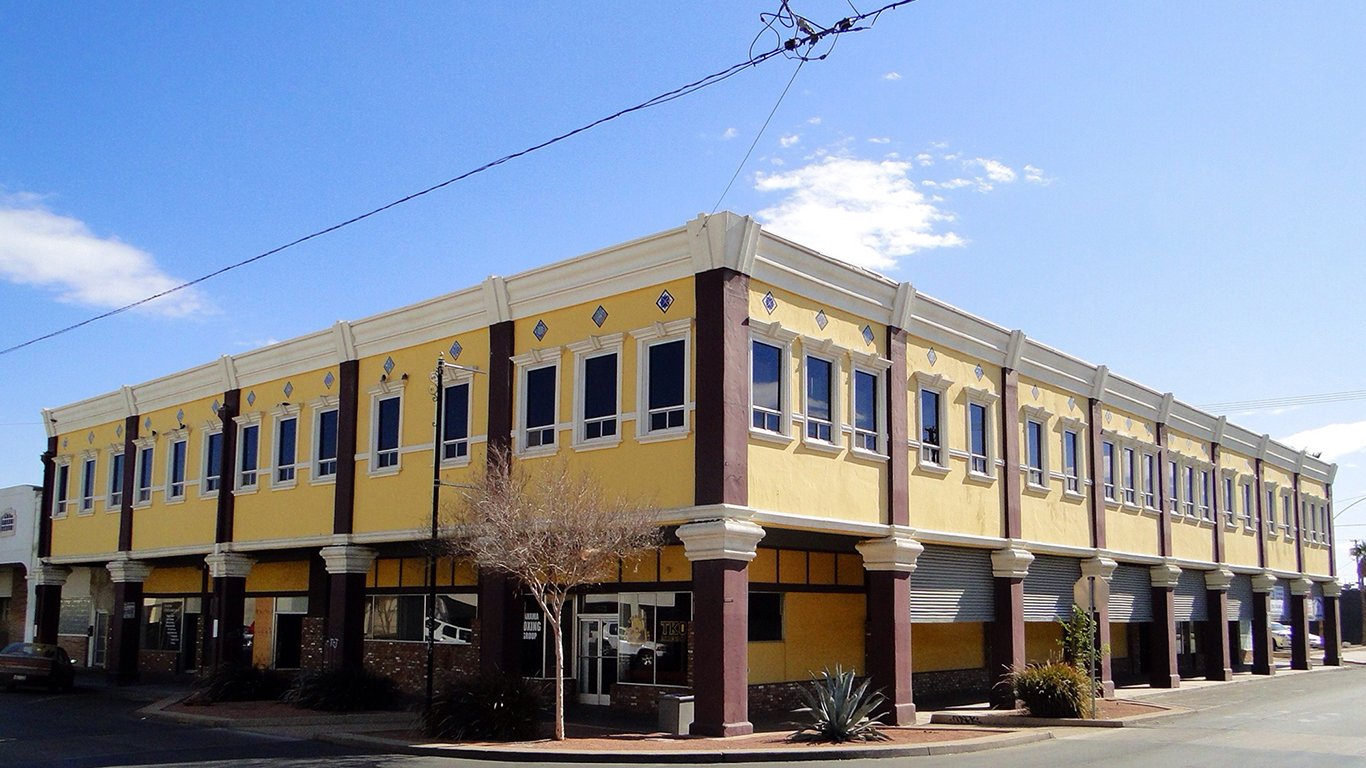
4. Yakima, WA
> Households with SNAP benefits: 24.2%
> Poverty rate: 18.1% (highest 20%)
> Pop. with a disability: 13.8%
> May unemployment: 6.8% (highest 10%)
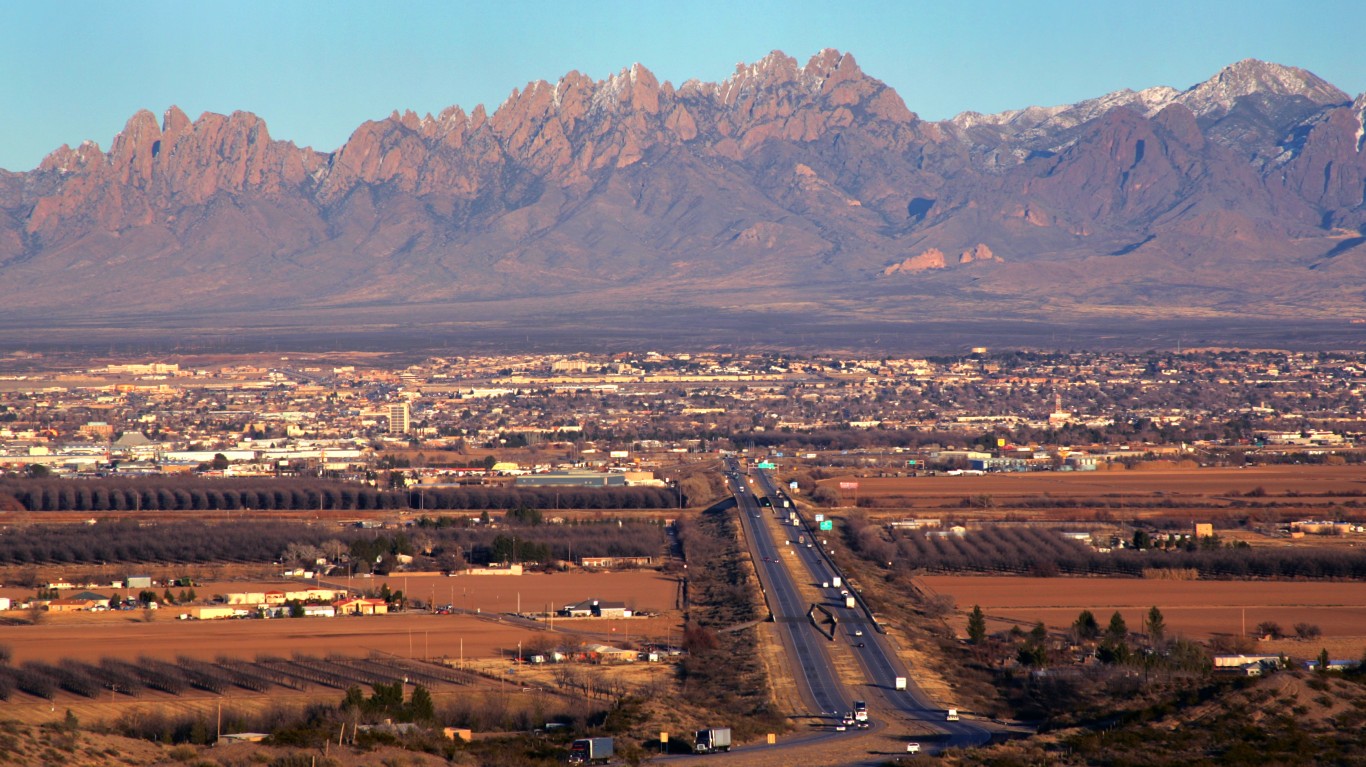
3. Las Cruces, NM
> Households with SNAP benefits: 26.4%
> Poverty rate: 28.1% (highest 10%)
> Pop. with a disability: 17.0% (highest 20%)
> May unemployment: 5.3% (highest 10%)
[in-text-ad]
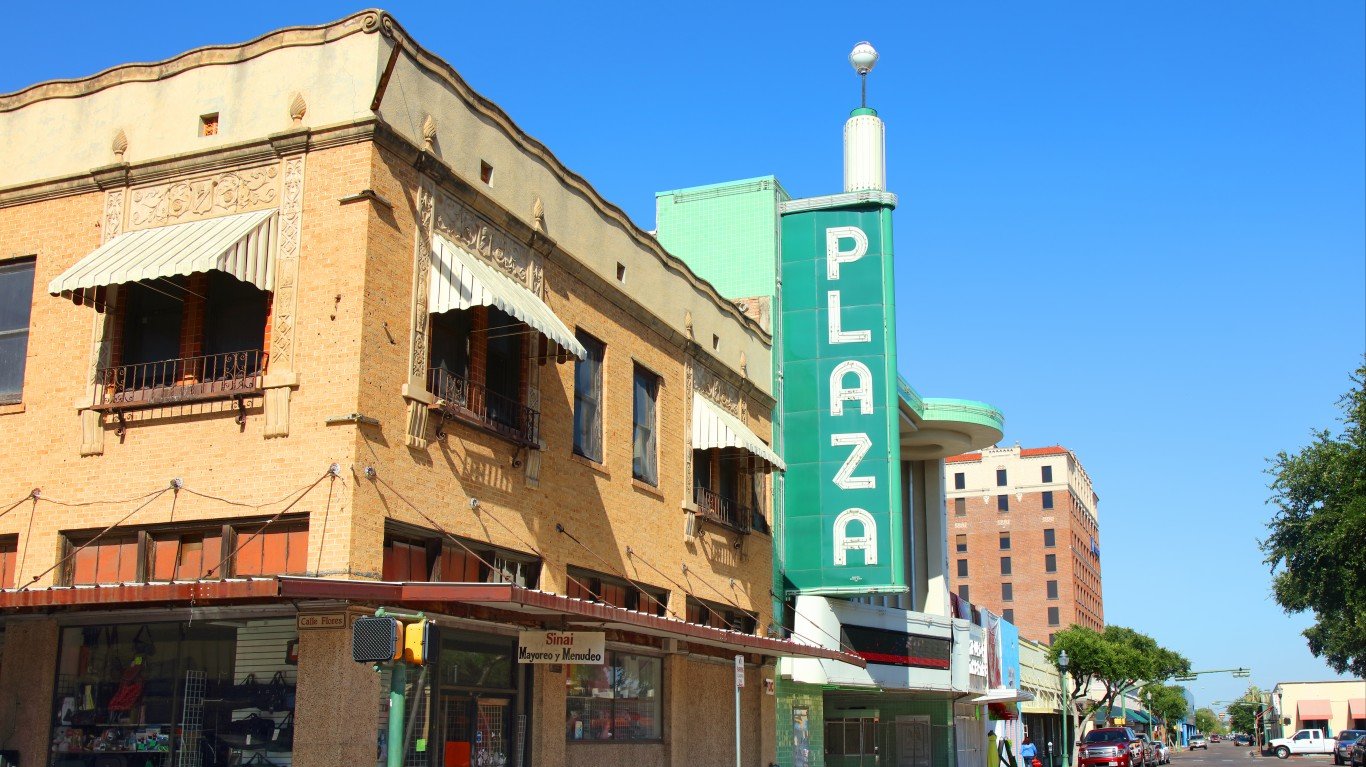
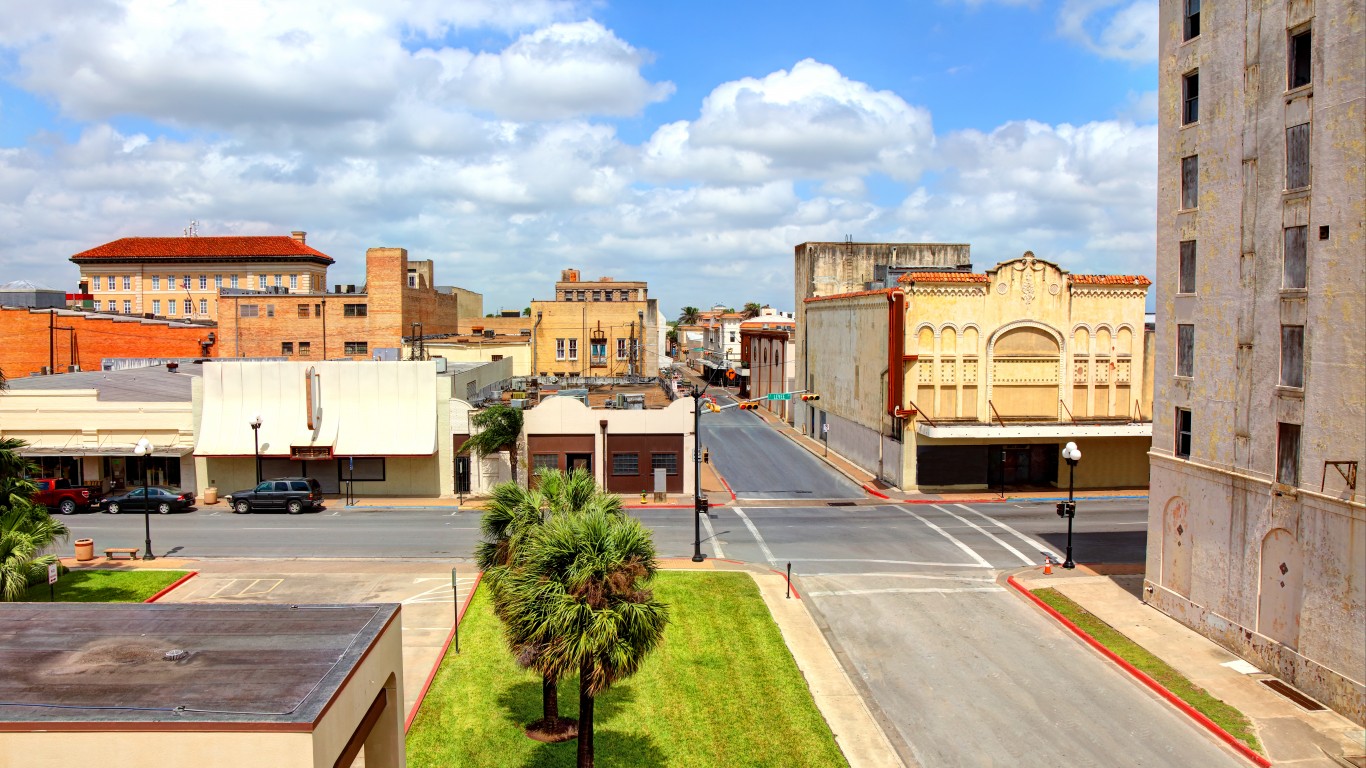
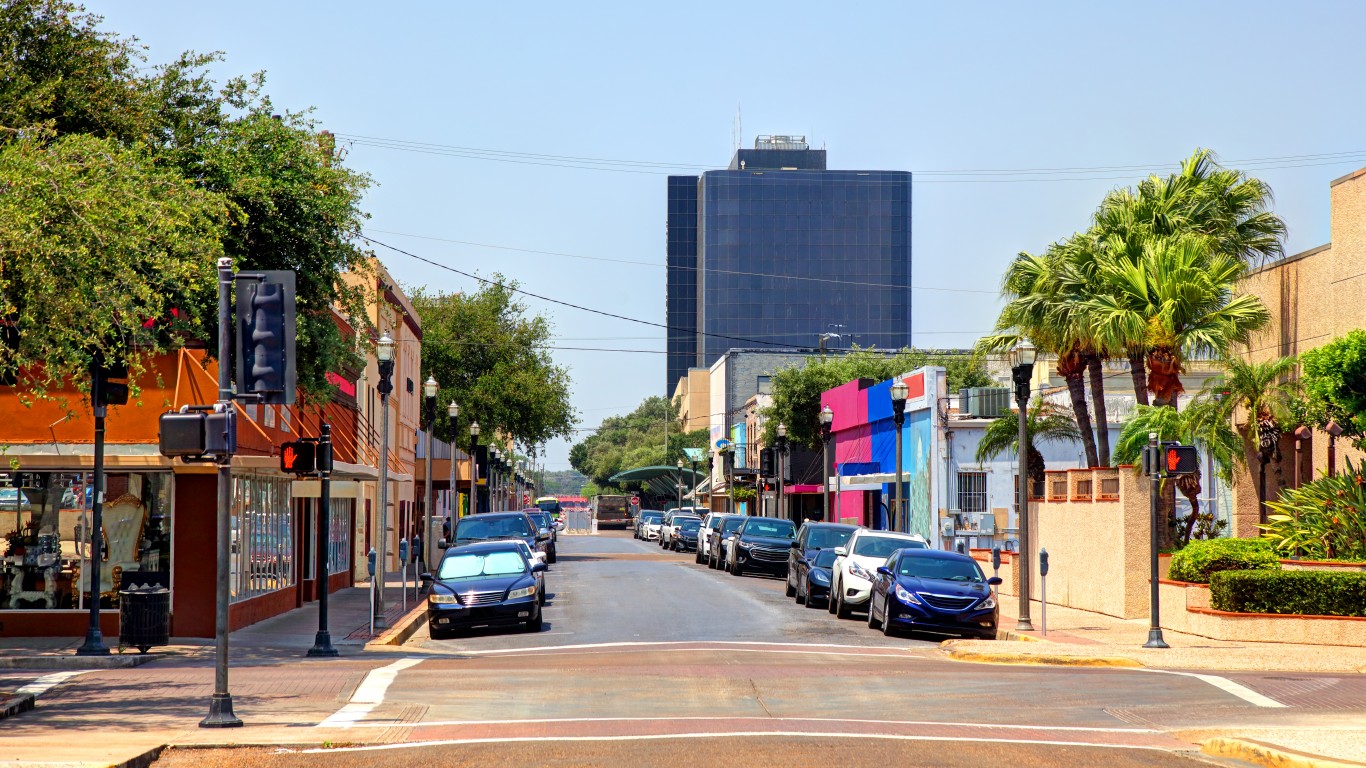
2. Laredo, TX
> Households with SNAP benefits: 28.0%
> Poverty rate: 28.0% (highest 10%)
> Pop. with a disability: 10.8% (lowest 20%)
> May unemployment: 3.2%
[recirclink id=546650]
1. McAllen-Edinburg-Mission, TX
> Households with SNAP benefits: 30.5%
> Poverty rate: 30.0% (highest 10%)
> Pop. with a disability: 14.1%
> May unemployment: 5.0% (highest 10%)
Methodology
To identify the cities with the most people receiving SNAP benefits, 24/7 Wall St. reviewed the SNAP recipiency rate in all U.S. metro areas. SNAP recipiency rates, as well as poverty, educational attainment, retirement income, and disability rates are one year estimates from the U.S. Census Bureau’s 2017 American Community Survey. Unemployment rates are seasonally adjusted for May 2019 and are from the Bureau of Labor Statistics.
Contact [email protected] for any questions or corrections.