[cnxvideo id=”857682″ placement=”ros”]Since President Lyndon B. Johnson declared the “war on poverty” in 1964, the share of U.S. children living in poverty has been cut in nearly half. According to analysis from the D.C.-based think tank Center on Budget and Policy Priorities, the reduction in child poverty is largely due to various safety net programs created as part of Johnson’s Great Society initiative, as well as several key refundable tax credit programs aimed at low-income working families with children.
The effect of federal subsidies and tax credits on poverty in America can be assessed with the supplemental poverty rate, a measure of poverty that takes into account government assistance and refundable tax credits as well as expenses and cost of living that is meant to provide a more accurate picture of how many families have the resources available to meet basic needs. The supplemental poverty measure can also reveal the states where poverty is worse than you think.
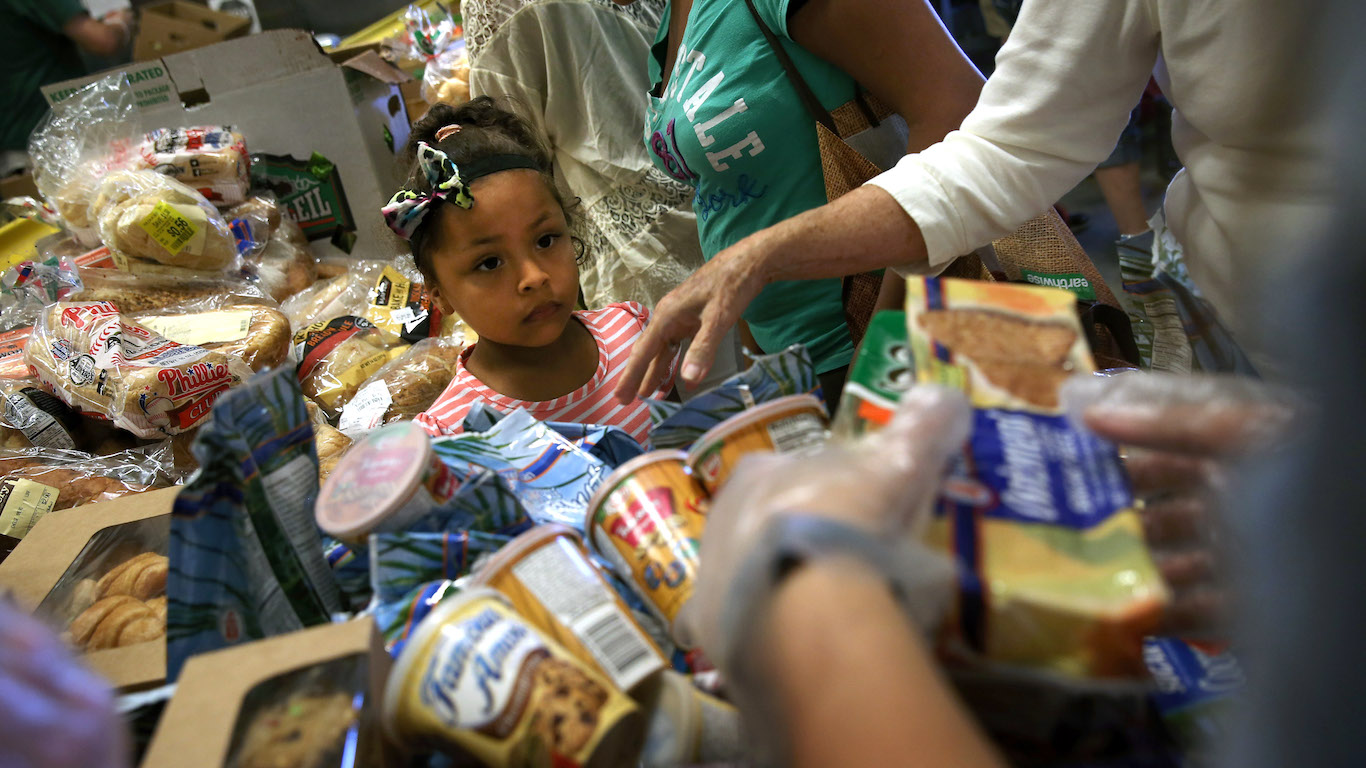
The subsidies and tax credits measured by the supplemental poverty rate include the federal Supplemental Nutrition Assistance Program (SNAP, formerly food stamps), housing subsidies, school lunch subsidies, energy subsidies, subsidies from the federal Women, Infants, and Children (WIC) program, the earned income tax credit (EITC), and the child tax credit.
To determine the states where public programs lift the most children out of poverty, 24/7 Wall St. calculated the change in the number of children living in poverty as measured by the supplemental poverty rate and the number of children living in poverty when anti-poverty subsidies and tax credits are factored out with data from the U.S. Census Bureau.
Click here to see the full list of the states where public programs lift the most children out of poverty
Click here to read our detailed findings and methodology

15. New Mexico
> Change in no. of poor children due to public programs: -47.9%
> Supplemental child poverty rate: 14.4% (15th highest)
> Supplemental child poverty rate w/o public programs: 27.6% (10th highest)
> Avg. child tax credit payments per household: $328.41 (7th highest)
The child supplemental poverty rate in New Mexico is 14.4%, the 15th highest of any state. But while child poverty is worse in New Mexico than in a majority of states, it would be far worse without government assistance. The average household in New Mexico — with or without children — receives $2,358 a year from programs such as the SNAP, school lunch subsidies, and child tax credits, the most of any state. After factoring out the money from public programs, New Mexico’s supplemental child poverty rate rises to 27.6% — the 10th highest of any state.
In total, however, money from public programs reduces the number of children in poverty by 47.9% in New Mexico, the 15th highest improvement of any state and higher than the national figure. Nationwide, the number of children living in poverty improves by 41.8% thanks to public programs.
[in-text-ad]

14. Tennessee
> Change in no. of poor children due to public programs: -48.0%
> Supplemental child poverty rate: 13.7% (19th highest)
> Supplemental child poverty rate w/o public programs: 26.4% (12th highest)
> Avg. child tax credit payments per household: $271.00 (25th lowest)
Many of the states where public programs lift the most children out of poverty tend to be poorer states, where residents would have the greatest need for government assistance. After factoring out the effects of anti-poverty programs like food stamps, housing subsidies, and the child tax credit, Tennessee’s supplemental child poverty rate rises from 13.7% — the 19th highest of any state — to 26.4%, the 12th highest.
The average Tennessee household receives $1,809 in subsidies and tax credits a year, which helps reduce the total number of children in poverty in the state by 48.0%. The SNAP program accounts for 27.4% of all subsidies and tax credits Tennessee households receive, the sixth largest share of any state.
[recirclink id=488456]

13. New Hampshire
> Change in no. of poor children due to public programs: -48.3%
> Supplemental child poverty rate: 6.9% (the lowest)
> Supplemental child poverty rate w/o public programs: 13.4% (the lowest)
> Avg. child tax credit payments per household: $155.75 (the lowest)
While many of the states where public programs have the largest effect on child poverty are also the poorest, New Hampshire is relatively wealthy and has the lowest child poverty rate in the country. The supplemental child poverty rate in the Granite State of 6.9% is less than half the national rate of 14.6%. Without the effect of public programs such as SNAP, housing subsidies, and the child tax credit, the supplemental child poverty rate in New Hampshire nearly doubles to 13.4%. In total, government assistance reduces the number of children in poverty in the state by 48.3%, more than the 41.8% national reduction.

12. Minnesota
> Change in no. of poor children due to public programs: -48.7%
> Supplemental child poverty rate: 8.0% (4th lowest)
> Supplemental child poverty rate w/o public programs: 15.6% (2nd lowest)
> Avg. child tax credit payments per household: $235.72 (11th lowest)
Minnesota is one of only four states that completely matches the federal child and dependent care tax credit for eligible families. Households with two or more children earning less than $25,750 a year can receive up to $1,440 in credits, and households with incomes up to $39,400 are eligible for smaller amounts.
Public programs reduce the number of children in poverty in Minnesota by 48.7%, more than the 41.8% national average. Assistance from the WIC program accounts for 4.0% of all subsidies and tax credits received in Minnesota, the largest share of any state. School lunch subsidies account for 14.2%, and housing subsidies for 15.9%, the seventh and ninth largest such shares, respectively.
[in-text-ad-2]

11. Ohio
> Change in no. of poor children due to public programs: -48.8%
> Supplemental child poverty rate: 11.8% (19th lowest)
> Supplemental child poverty rate w/o public programs: 23.1% (23rd highest)
> Avg. child tax credit payments per household: $280.67 (21st highest)
Because of financial assistance from public programs such as food stamps, lunch subsidies, and child tax credits, the supplemental child poverty rate is 11.8% in Ohio — the 19th lowest. Without government assistance, the supplemental childhood poverty rate in the state would be 23.1%, the 23rd highest. SNAP accounts for 27.2% of all government assistance dollars received in Ohio, far more than the 22.3% national share.
One reason for the large impact of government programs in Ohio is the high recipiency rate of public benefits. According to data from the Census Bureau’s ACS, some 23.6% of poor families in Ohio receive some form of public assistance income, the seventh largest share of any state.

10. Arkansas
> Change in no. of poor children due to public programs: -49.1%
> Supplemental child poverty rate: 12.7% (25th highest)
> Supplemental child poverty rate w/o public programs: 24.9% (17th highest)
> Avg. child tax credit payments per household: $277.12 (24th highest)
Arkansas has a relatively young population, which may make child care a greater financial burden on the state’s working-age population and further necessitate the need of government anti-poverty programs.
Like in many states with larger young populations, government assistance has a relatively large impact on child poverty in Arkansas. The average household — with or without children — receives $1,698 in assistance, which reduces the number of children in poverty by nearly half. School lunch programs account for 14.8% of subsidies and tax credits received by Arkansas households, the fifth largest share of any state.
[in-text-ad]

9. Nebraska
> Change in no. of poor children due to public programs: -49.3%
> Supplemental child poverty rate: 10.7% (15th lowest)
> Supplemental child poverty rate w/o public programs: 21.1% (19th lowest)
> Avg. child tax credit payments per household: $353.70 (4th highest)
Nebraska is one of only four states that completely matches the federal child and dependent care tax credit for eligible families. Families with incomes of $22,000 or less can receive the full amount of the federal CDCTC from the state, with the credit reduced by 10% for every $1,000 the family earns above the $22,000 threshold.
The average Nebraska household — with or without children — receives $353.70 in child tax credits and $284.44 in school lunch subsidies a year, each the fourth most of any state. Nebraska residents receive an average of $1,894 in subsidies and credits per household, which reduces the number of children in poverty by 49.3% — more than the 41.8% national reduction.
[recirclink id=488594]

8. South Dakota
> Change in no. of poor children due to public programs: -49.4%
> Supplemental child poverty rate: 9.4% (6th lowest)
> Supplemental child poverty rate w/o public programs: 18.5% (12th lowest)
> Avg. child tax credit payments per household: $277.93 (23rd highest)
Public programs such as SNAP, WIC, and school lunch subsidies reduce the number of children in poverty in South Dakota by 49.4%, more than the 41.8% national reduction.
Like in many states where public programs have the largest impact on child poverty, South Dakota has a relatively young population, which may make child care expenses a greater burden on the working age population. Nearly one in every four state residents are under age 18, the sixth largest share of any state. Annual child care expenses amount to nearly $978 per South Dakota household — with children and without — $263 more than the national average.

7. Maine
> Change in no. of poor children due to public programs: -50.1%
> Supplemental child poverty rate: 10.1% (13th lowest)
> Supplemental child poverty rate w/o public programs: 20.2% (16th lowest)
> Avg. child tax credit payments per household: $247.72 (15th lowest)
In Maine, public assistance programs such as food stamps, school lunch subsidies, and child tax credits help reduce the total number of children in poverty by 50.1%, far more than the 41.8% national reduction. The SNAP program accounts for 30.2% of all government assistance dollars received in Maine, the largest share of any state.
One factor that may account for the large impact of government programs in Maine is the state’s high recipiency rate of public benefits. According to Census data, 24.8% of poor families in Maine receive some form of public assistance income, the fourth largest share of any state.
[in-text-ad-2]

6. Oklahoma
> Change in no. of poor children due to public programs: -50.2%
> Supplemental child poverty rate: 11.7% (18th lowest)
> Supplemental child poverty rate w/o public programs: 23.5% (21st highest)
> Avg. child tax credit payments per household: $356.50 (3rd highest)
Oklahoma is one of only four states with its own version of the federal earned income tax credit, child tax credit, and child and dependent care credit assistance programs. Oklahoma residents who qualify for the federal ETIC are eligible to receive 5% of the federal credit amount, and families who qualify for the federal child tax credit and child and dependent care credit assistance programs may claim either 5% of the federal CTC amount or 20% of the federal CDCTC — whichever is greater.
The average Oklahoma household receives $804.52 in EITCs and $356.50 in child tax credits, the fifth and third most of any state, respectively. In total, public programs reduce the number of children in poverty in Oklahoma by 50.2%, far more than the 41.8% national reduction.

5. Mississippi
> Change in no. of poor children due to public programs: -50.9%
> Supplemental child poverty rate: 15.1% (11th highest)
> Supplemental child poverty rate w/o public programs: 30.7% (5th highest)
> Avg. child tax credit payments per household: $301.62 (16th highest)
Mississippi is one of the states with the worst economies, and its supplemental child poverty rate of 15.1% is the 11th highest in the country. And child poverty in Mississippi would be even worse without government assistance. After factoring out public programs such as the SNAP, school lunch subsidies, and the child tax credit, Missippi’s supplemental child poverty rate rises to 30.7% — the fifth highest of any state. In total, public programs reduce the number of children in poverty by 50.9%, far more than the 41.8% national reduction.
[in-text-ad]

4. Idaho
> Change in no. of poor children due to public programs: -52.8%
> Supplemental child poverty rate: 8.9% (5th lowest)
> Supplemental child poverty rate w/o public programs: 18.8% (13th lowest)
> Avg. child tax credit payments per household: $423.44 (the highest)
After factoring out government programs such as food stamps, housing subsidies, and tax credits, the supplemental child poverty rate in Idaho rises from 8.9% — the fifth lowest of any state — to 18.8%, the 13th lowest. In total, public programs reduce the number of children in poverty by 52.8%, far more than the 41.8% national reduction.
Idaho is one of only six states with its own child tax credit program. The Idaho child tax credit follows the same eligibility guidelines as the federal program, and in 2018, it rose from $130 per qualifying child a year to $205. Total child tax credits in Idaho amount to $423.44 per household — qualifying and non-qualifying — the most of any state and approximately $140 more than the U.S. average.
[recirclink id=488561]

3. Rhode Island
> Change in no. of poor children due to public programs: -54.3%
> Supplemental child poverty rate: 9.9% (12th lowest)
> Supplemental child poverty rate w/o public programs: 21.7% (21st lowest)
> Avg. child tax credit payments per household: $206.65 (5th lowest)
Rhode Island is one of several small, relatively wealthy states where government assistance still has a great effect on child poverty. The typical household in Rhode Island earns $63,870 a year, about $3,500 more than the U.S. median. Public programs such as the SNAP, school lunch subsidies, and child tax credits reduce the supplemental child poverty rate in Rhode from 21.7% — the 21st lowest of any state — to 9.9%, the 12th lowest, and cuts the total number of children in poverty by more than half.
One reason for the large impact of government programs in Rhode Island is the high recipiency rate of public benefits. According to data from the ACS, 32.9% of poor families in Rhode Island receive some form of public assistance income, the largest share of any state.

2. Iowa
> Change in no. of poor children due to public programs: -56.1%
> Supplemental child poverty rate: 8.0% (3rd lowest)
> Supplemental child poverty rate w/o public programs: 18.1% (9th lowest)
> Avg. child tax credit payments per household: $322.14 (11th highest)
The average household in Iowa — with and without children — receives $322.14 a year in child tax credits, the 11th most of any state. The average household also receives $54.85 a year from the federal WIC program, the eighth most of any state. Adjusted for the state’s low cost of living — goods and services cost 10.2% less in Iowa than they do nationwide — the amount of government assistance received by Iowa households ranks even higher relative to other states.
In total, public programs reduce the number of children living in poverty in Iowa by 56.1%, the largest reduction of any state other than Kansas.
[in-text-ad-2]

1. Kansas
> Change in no. of poor children due to public programs: -60.5%
> Supplemental child poverty rate: 7.3% (2nd lowest)
> Supplemental child poverty rate w/o public programs: 18.5% (11th lowest)
> Avg. child tax credit payments per household: $316.88 (14th highest)
In 2017, Kansas reinstated its own version of the federal child and dependent care tax credit, which provides eligible families with 18.8% of the federal CDCTC amount in the 2019 tax year, and 25.0% in 2020 and all years thereafter. Tax credits such as the CDCTC, other child tax credits, earned income tax credits, and other welfare subsidies reduce the number of children living in poverty in Kansas by 60.5%, by far the largest reduction of any state.
Like many states on this list, Kansas has a relatively large child population, which makes the cost of raising a child a greater burden on the working-age population and further necessitates the help of government anti-poverty programs. Of all state residents, 24.5% are under age 18, a larger share than in all but six other states.
Detailed Findings
While the federal government administers many of the largest anti-poverty programs, state governments have the ability to significantly reduce child poverty through tax credits. There are 29 states with their own version of the federal EITC, 23 states with a child and dependent care tax credit program, and six states with their own version of the child tax credit. Four states — Oklahoma, Colorado, New York, and California — have all three. These programs typically have the same eligibility requirements as the federal programs they complement and offer qualifying households some percentage of the federal credit amount.
Many of the states where public programs have the greatest impact on poverty are among America’s poorest states and may therefore be in the greatest need of government assistance. In 12 of the 15 states on this list, the median household income is below the $60,336 national figure.
States relying the most on government assistance also tend to have a high ratio of children to adults, adding greater financial burden to the working-age population and further necessitating the need for public benefits programs. In 10 of the 15 states where public programs lift the most children out of poverty, the child dependency ratio is greater than the national proportion of 37 children for every 100 adults aged 18 to 64.
Methodology
To determine the states where public programs lift the most children out of poverty, 24/7 Wall St. calculated the change in the number of children living in poverty under the supplemental definition of poverty and when public anti-poverty programs are excluded. The supplemental rate includes public assistance programs as well as cost of living measures. 24/7 Wall St. factored out any anti-poverty subsidies and tax credits (to see how effective are government programs in each state). Data came from the U.S. Census Bureau.
To factor out anti-poverty subsidies and tax credits, we subtracted the total value of dollars received from the Supplemental Nutrition Assistance Program (SNAP, formerly food stamps), housing subsidies, school lunch subsidies, energy subsidies, subsidies from the Women, Infants, and Children program (WIC), earned income tax credits, and child tax credits from the total value of a household’s resources. All data are three-year averages of the Census Bureau’s supplemental poverty research file for the years 2015, 2016, and 2017. Data on regional price parity, or cost of living, came from the Bureau of Economic Analysis and is for 2017. Data on median household income, the ratio of children under 18, and the share of poor families receiving social security income or public assistance income (the recipiency rate) came from the Census Bureau’s 2017 American Community Survey.
Contact [email protected] for any questions or corrections.