[cnxvideo id=”863572″ placement=”ros”]
The U.S. economy added 224,000 jobs in June 2019, far exceeding economists expectations of 140,000 new jobs. The better than expected June jobs report marks 105 consecutive months of jobs growth — the longest in U.S. history.
Over the last five years alone, overall employment in the United States climbed by 7.3%, driven in large part by massive hiring in the trade, transportation, and utilities sector. Partially as a result, the unemployment rate dipped from 6.1% in May 2014, to 3.4% in May 2019 — a low not seen since the 1960s.
Job growth has not been even nationwide, and in some U.S. cities, employment has grown at double and even triple the national pace. 24/7 Wall St. reviewed five-year changes in employment — the number of people working — at the metro area level to identify the cities adding the most jobs. Over the past half decade, overall employment rose anywhere from 16.9% to over 25% in the 20 cities on this list. These cities are almost entirely concentrated in the Southern and Western United States.
In many of the cities on this list, the presence of major companies — often, the largest company in the state — help bolster economic conditions. Examples on this list include Boise, Idaho, where grocery chain Albertsons is headquartered, and Charlotte, North Carolina, home to the headquarters of Bank of America. Here is a full list of the largest company in every state.
Growth in overall employment rarely happens rapidly without an increase a population. A growing population typically leads to growing demand for goods and services, which results in upticks in hiring. Every city on this list has had faster population growth than the U.S. as a whole in the last five years, and all but one of them have reported population growth of at least double the 3.5% national growth rate. Here are the fastest growing places in every state.
Click here to see the cities adding the most jobs
Click here to read our methodology

20. Bellingham, WA
> 5 yr. employment increase: 16.9% (+15,858 jobs)
> Highest growth industry: Government (+1,900 jobs)
> May 2019 unemployment: 4.7%
> Median household income: $61,186
Bellingham is one of four metro areas in Washington state to rank on this list. In the last five years, the number of people working in the metro area climbed by 16.9% — more than double the comparable 7.3% national job growth. Growth was driven primarily by the public sector, as the number of people working in government climbed by nearly 2,000 in the last five years. The manufacturing sector also added net 1,500 jobs.
Employment growth in Bellingham’s public sector is likely driven by the increased demand for government services that often accompanies a rapidly growing population. The 9.5% population growth rate between mid-2013 and mid-2018 in Bellingham was well more than double the 3.5% national population growth rate over the same period.
[in-text-ad]

19. Naples-Immokalee-Marco Island, FL
> 5 yr. employment increase: 17.2% (+25,885 jobs)
> Highest growth industry: Leisure and hospitality (+4,800 jobs)
> May 2019 unemployment: 2.8%
> Median household income: $66,048
Naples, Florida, is one of the fastest growing metro areas in the United States. In the last five years, the number of people living in the area climbed by 11.6%, more than triple the 3.5% national population growth over the same period. In order to accommodate the new residents, the city’s education and health services sector added net new 4,300 positions, and the trade, transportation, and utilities added 3,400 jobs.
The fastest growing industry in the area, however, was leisure and hospitality, which added 4,800 net new jobs. Across all industries, total employment climbed by nearly 26,000 in the Naples metro area in the last five years.
[recirclink id=562217]

18. Idaho Falls, ID
> 5 yr. employment increase: 17.3% (+10,481 jobs)
> Highest growth industry: Professional and business services (+2,900 jobs)
> May 2019 unemployment: 2.0%
> Median household income: $54,515
Idaho is one of the fastest growing states in the country, and Idaho Falls is one of the fastest growing cities. In the last five years, the number of people living in the metro area increased by over 12,000, an 8.8% bump. Job growth kept pace with growing demand, as over roughly the same period, total employment climbed by nearly 10,500, or a 17.3% increase — more than in all but 17 other metro areas nationwide.
The rapid job growth in Idaho Falls has lead to one of the lowest jobless rates in the country. Just 2.0% of workers in the metro area are unemployed, down from 4.0% half a decade ago and well below the 3.4% national unemployment rate.

17. Charlotte-Concord-Gastonia, NC-SC
> 5 yr. employment increase: 17.4% (+196,663 jobs)
> Highest growth industry: Professional and business services (+36,800 jobs)
> May 2019 unemployment: 3.7%
> Median household income: $61,156
Charlotte-Concord-Gastonia is the only North Carolina metro area to rank on this list. In the last five years, the metro area added nearly 197,000 jobs, a 17.4% increase. Nationwide, total employment climbed by just 7.3% over the same period.
Professional and business services added a net of 36,800 jobs in the metro area since 2014, more than every other industry over the same period. Jobs in the professional and business services sector often require a college education — and Charlotte is a relatively well-educated part of the country. Of all metro area adults, 35.5% have a bachelor’s degree or higher, well above the 32.0% national share.
[in-text-ad-2]

16. Austin-Round Rock, TX
> 5 yr. employment increase: 18.0% (+180,965 jobs)
> Highest growth industry: Professional and business services (+42,200 jobs)
> May 2019 unemployment: 2.2%
> Median household income: $73,800
Thanks largely to a net gain of 42,200 new jobs in the professional and business services sector, total employment increased by 18.0% in the Austin-Round Rock metro area in the last five years. Some of the largest employers in the metro area include tech giants like Apple, IBM, Amazon, and Dell, as well as the University of Texas at Austin.
Jobs in the professional and business services sector often require a college education — and Austin has one of the best-educated populations in the country. Nearly 45% of adults in the metro area have a bachelor’s degree or higher, well above the 32.0% share of adults nationwide.

15. Kennewick-Richland, WA
> 5 yr. employment increase: 18.3% (+21,431 jobs)
> Highest growth industry: Education and health services (+3,300 jobs)
> May 2019 unemployment: 5.1%
> Median household income: $63,617
There are 21,431 more people working in the Kennewick-Richland metro area today than there were half a decade ago, the largest net increase of any of the four Washington metro areas on this list. Rapid population growth in recent years has driven up demand for public services, which partially explains the employment increase in education and health services. The sector added more jobs than any other sector since 2014.
Despite the near nation-leading increase in employment, joblessness is a bigger problem in Kennewick-Richland than it is nationwide on average. As of May, the unemployment rate in the metro area stood at 5.1%, well above the comparable national unemployment rate of 3.4%.
[in-text-ad]

14. Fayetteville-Springdale-Rogers, AR-MO
> 5 yr. employment increase: 18.4% (+42,625 jobs)
> Highest growth industry: Trade, transportation, and utilities (+7,400 jobs)
> May 2019 unemployment: 2.3%
> Median household income: $56,038
Fayetteville-Springdale-Rogers is the only metro area in Arkansas to rank on this list. Overall employment climbed by 18.4% over the last five years, thanks in part to rapidly growing employment in the professional and business services sector as well as government. The industry that added the most jobs, however, was trade, transportation, and utilities, adding 7,400 net new jobs since 2014.
Though the size of the labor force in the area also grew rapidly over that period, the number of jobs grew even faster, and unemployment declined. The jobless rate in the metro area fell from 4.6% in May 2014 to 2.3% in May 2019, a 2.3 percentage point decline.
[recirclink id=561552]

13. Olympia-Tumwater, WA
> 5 yr. employment increase: 18.5% (+21,139 jobs)
> Highest growth industry: Education and health services (+3,500 jobs)
> May 2019 unemployment: 4.7%
> Median household income: $71,765
Washington has more metro areas on this list than any other state. In Olympia-Tumwater, employment grew by 18.5% in the last five years, more than in all but a dozen other cities nationwide.
In recent years, the metro area has been among the 50 fastest growing nationwide, with 9.4% population growth between mid-2013 and mid-2018. Population growth results in growing demand for public services, and over the last five years, the two fastest growing industries in the metro area were education and health care and government, which added 3,500 and 3,400 net new jobs, respectively.

12. Wenatchee, WA
> 5 yr. employment increase: 19.3% (+10,190 jobs)
> Highest growth industry: Leisure and hospitality (+1,800 jobs)
> May 2019 unemployment: 4.9%
> Median household income: $58,990
Employment rose by 19.3% in Wenatchee over the last five years — faster than in every other metro area in Washington state and all but 11 metro areas nationwide. Since May 2014, no sector reported a net decline in jobs, and the leisure and hospitality industry and education and health services sectors each reported a net increase in employment of over 1,000.
Despite the near nation-leading increase in employment growth, joblessness remains a bigger problem in Wenatchee than it is nationwide on average. As of May, the unemployment rate in the metro area stood at 4.9%, well above the comparable national unemployment rate of 3.4%.
[in-text-ad-2]

11. Greeley, CO
> 5 yr. employment increase: 19.4% (+26,871 jobs)
> Highest growth industry: Trade, transportation, and utilities (+2,500 jobs)
> May 2019 unemployment: 2.2%
> Median household income: $68,884
Greeley is one of two Colorado metro areas to rank on this list. In the last five years, employment climbed by 19.4% in the metro area, more than double the 7.3% national employment growth rate over the same period. Partially as a result, the area has one of the lowest jobless rates of any city. Just 2.2% of the labor force in Greeley was unemployed in May, well below the 3.4% national unemployment rate.
Trade, transportation, and utilities added a net of 2,500 jobs, more than every other industry. Manufacturing and government each added over 2,000 jobs in the last five years as well.

10. Gainesville, GA
> 5 yr. employment increase: 19.4% (+16,411 jobs)
> Highest growth industry: Trade, transportation, and utilities (+2,200 jobs)
> May 2019 unemployment: 2.8%
> Median household income: $61,977
There are 16,411 more people working in Gainesville, Georgia, now than there were half a decade ago. The 19.4% increase in employment was the highest in Georgia over that time and 10th highest nationwide. The trade, transportation, and utilities sector added a net of over 2,000 new jobs in the metro area, and retail trade added over 1,000.
Like other cities on this list, Gainesville is growing rapidly. Between 2013 and 2018, the metro area’s population grew by 8.4%, more than double the national population growth of 3.5%.
[in-text-ad]
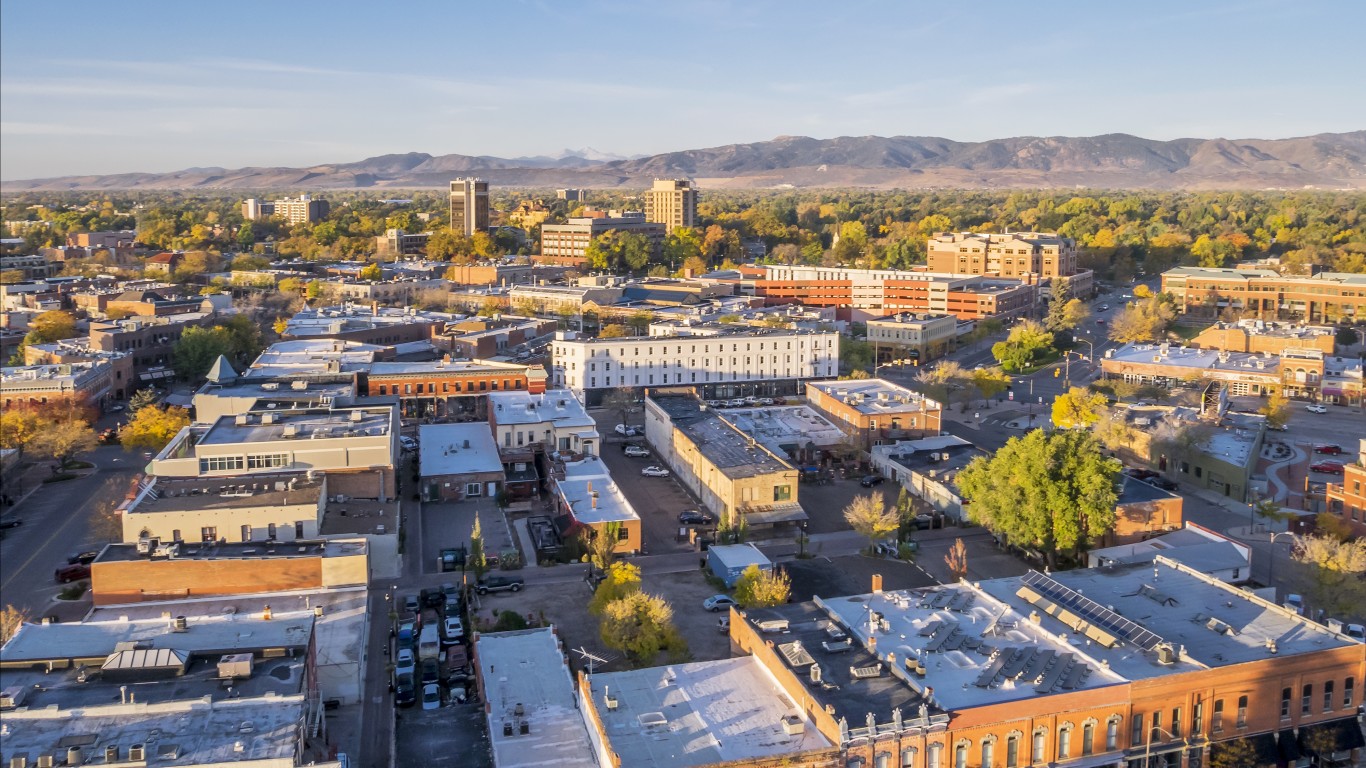
9. Fort Collins, CO
> 5 yr. employment increase: 19.6% (+33,350 jobs)
> Highest growth industry: Government (+5,500 jobs)
> May 2019 unemployment: 2.0%
> Median household income: $69,102
Employment in Fort Collins, Colorado, climbed by 19.6% in the last five years, more than every other metro area in the state and ninth most nationwide. Such rapid employment growth has led to one of the lowest jobless rates in the country. Just 2.0% of the labor force in Fort Collins is unemployed, well below the 3.4% national unemployment rate.
Adults with higher educational attainment typically earn higher incomes, and in Fort Collins, 47.9% of adults have a bachelor’s degree or higher — one of the highest shares of any U.S. city — and the typical area household earns $69,102 a year, about $9,000 more than the typical American household.
[recirclink id=562355]

8. Phoenix-Mesa-Scottsdale, AZ
> 5 yr. employment increase: 19.7% (+388,901 jobs)
> Highest growth industry: Education and health services (+69,600 jobs)
> May 2019 unemployment: 4.0%
> Median household income: $61,506
Phoenix is one of the largest metro areas in the United States. Over the last five years, the Arizona metro area has added nearly 389,000 jobs, more than every other metro area on this list. The education and health services sector accounted for the largest share of growth — netting 69,600 new jobs — followed by professional and business services, which accounted for 57,200 of all new jobs.
Despite the nearly 20% uptick in overall employment, joblessness is still relatively high in Phoenix. The metro area’s 4.0% May unemployment rate is slightly higher than the 3.4% national rate.

7. Boise City, ID
> 5 yr. employment increase: 19.9% (+60,126 jobs)
> Highest growth industry: Professional and business services (+9,700 jobs)
> May 2019 unemployment: 2.3%
> Median household income: $55,324
Total employment climbed by 19.9% in Boise City, Idaho, over the last five years, faster than any other city in the state and all but half a dozen other cities nationwide. Job growth in the metro area has been driven in part by a population boom. Between 2013 and 2018, the number of people living in the metro area increased by over 81,000, or 12.5%, more than triple the 3.5% national population growth over the same period.
Due in part to the growing demand for public services that typically accompanies a growing population, education and health services was one of the fastest growing industries in the metro area in the last five years, adding a net of 9,200 new jobs.
[in-text-ad-2]
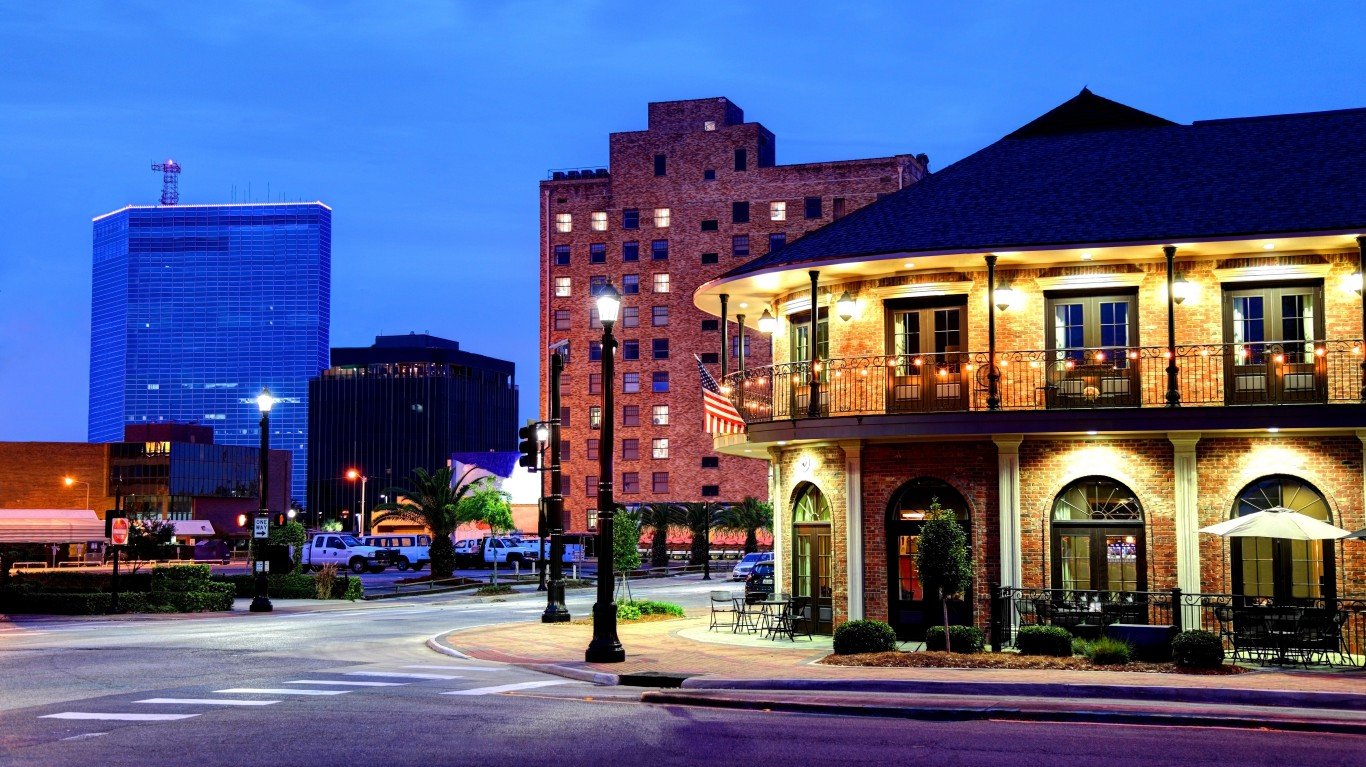
6. Lake Charles, LA
> 5 yr. employment increase: 20.0% (+18,274 jobs)
> Highest growth industry: Construction (+10,400 jobs)
> May 2019 unemployment: 3.3%
> Median household income: $52,314
Lake Charles is the only metro area in Louisiana to rank on this list. In the last five years, employment in Lake Charles climbed by 20% — more than in all but five other metro areas nationwide. The metro area’s construction sector accounted for 10,400 net new jobs since May 2014, over half of the total employment growth. Job growth in the area contributed to a 2.3 percentage point decline in unemployment — from 5.6% in May 2014 to 3.3% in May 2019.
Though Lake Charles has reported near nation-leading job growth and low unemployment, incomes in the metro area are not especially high. The typical area household earns just $52,314 a year, about $8,000 less than the typical American household.

5. Provo-Orem, UT
> 5 yr. employment increase: 20.6% (+51,042 jobs)
> Highest growth industry: Professional and business services (+11,500 jobs)
> May 2019 unemployment: 2.5%
> Median household income: $70,196
Since May 2014, employment in the Provo-Orem metro area grew by 20.6%, the second highest job growth in Utah and fifth highest nationwide. Accounting for some 11,500 net new jobs, professional and business services drove growth more than any other sector in the last five years. Jobs in that sector tend to require high educational attainment and are often relatively well paying. In Provo-Orem, 41.3% of adults have a bachelor’s degree — compared to 32.0% of adults nationwide — and the typical household earns $70,196 a year, nearly $10,000 more than the typical American household.
[in-text-ad]

4. Nashville-Davidson–Murfreesboro–Franklin, TN
> 5 yr. employment increase: 22.4% (+193,594 jobs)
> Highest growth industry: Professional and business services (+34,200 jobs)
> May 2019 unemployment: 2.4%
> Median household income: $63,939
Nashville is one of only half a dozen metro areas to report employment growth of 20% or more over the last five years. There are nearly 194,000 more people working in the Nashville area today than in 2014. Job growth has been fueled in part by population growth, as the number of people living in the metro area climbed by 9.8% between mid-2013 and mid-2018, more than double the 3.5% national population growth over that period.
Nicknamed “Music City” for its central role in the history of American music, Nashville has a booming tourism industry. The leisure and hospitality sector alone added a net of 27,100 jobs in the last five years. The fastest growing industry, however, was professional and business services, which netted some 34,200 new jobs since 2014.
[recirclink id=555564]
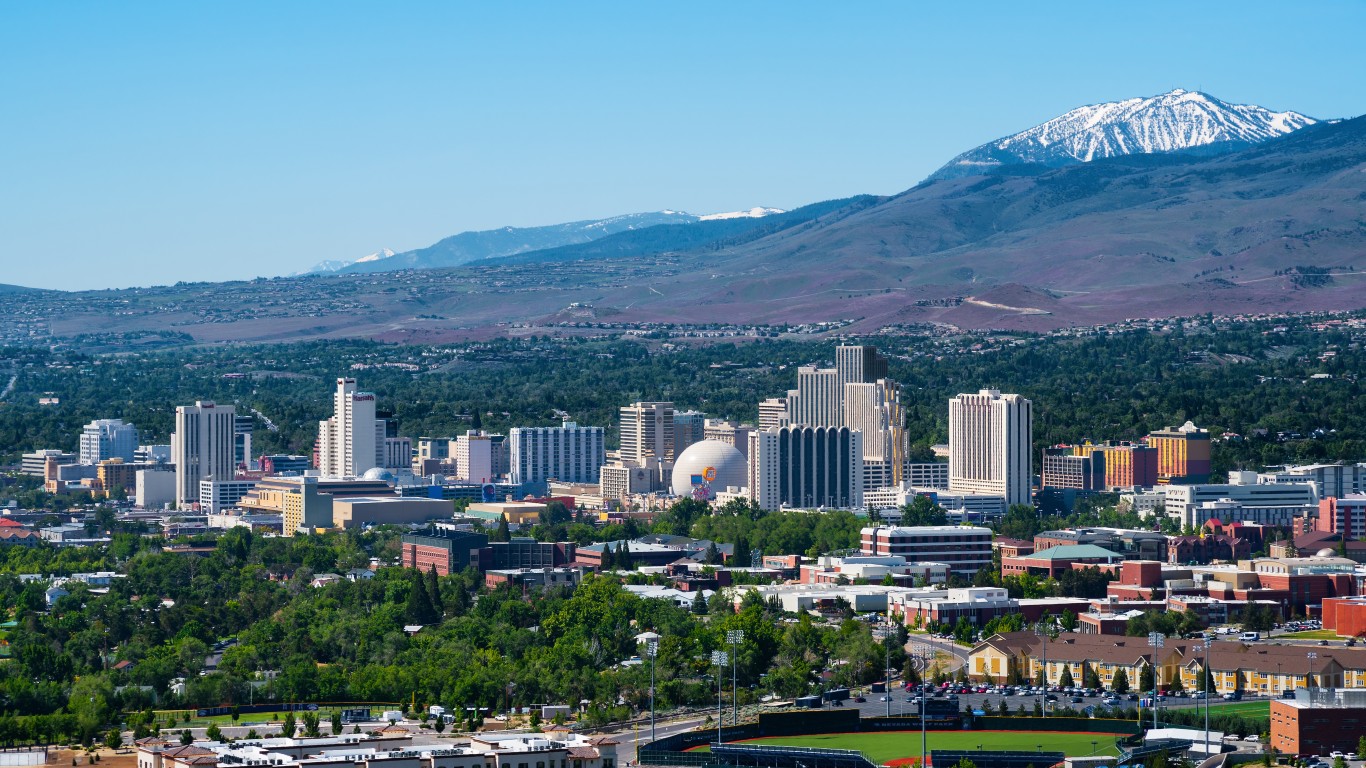
3. Reno, NV
> 5 yr. employment increase: 23.9% (+49,382 jobs)
> Highest growth industry: Manufacturing (+13,800 jobs)
> May 2019 unemployment: 3.0%
> Median household income: $61,360
Reno, Nevada, has one of the fastest growing working populations in the country. In the last five years, the metro area’s labor force grew by 18.1%, more than in all but four other U.S. cities. Over the same period, job growth in the metro area more than kept pace. Total employment climbed by 23.9% in Reno between May 2014 and May 2019, more than triple the national employment growth of 7.3% over that time.
Manufacturing was the fastest growing industry in Reno over the last five years, with total employment more than doubling.
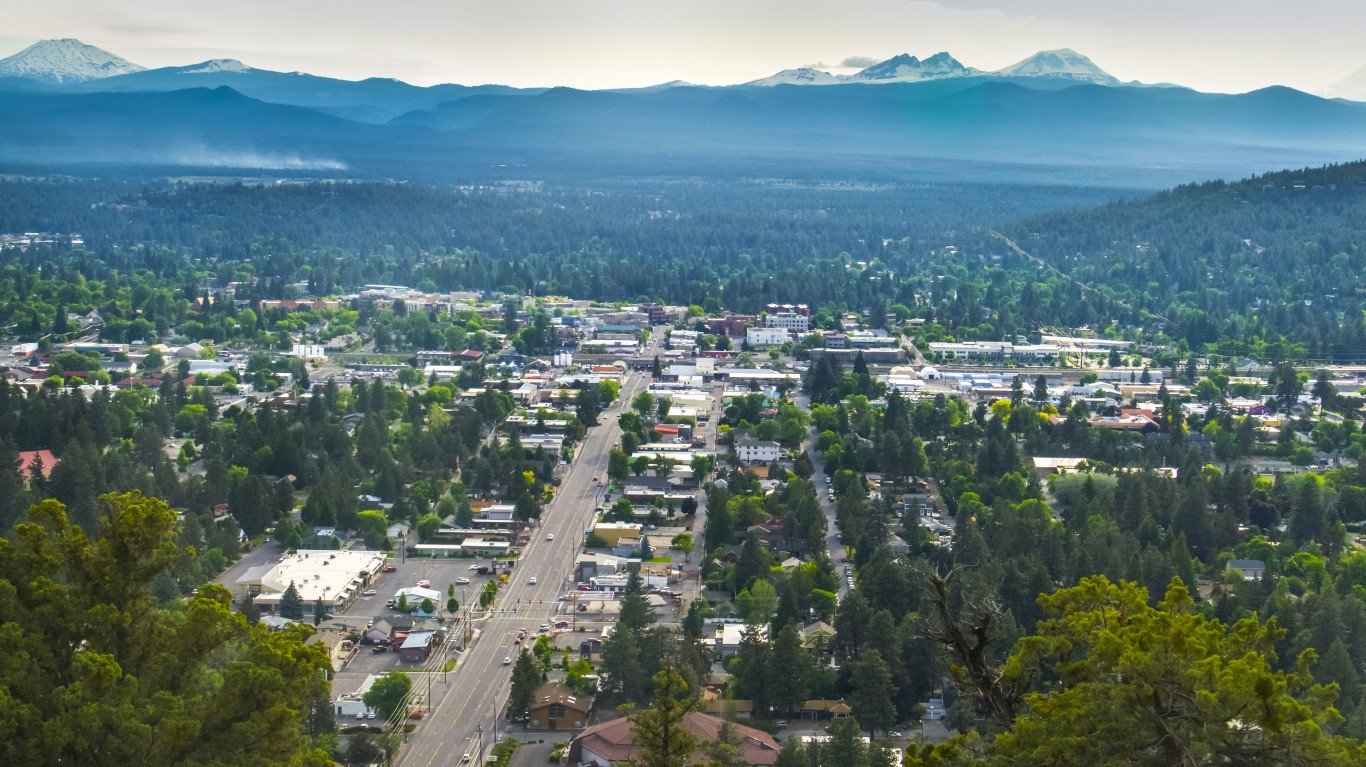
2. Bend-Redmond, OR
> 5 yr. employment increase: 24.9% (+18,542 jobs)
> Highest growth industry: Trade, transportation, and utilities (+3,200 jobs)
> May 2019 unemployment: 3.3%
> Median household income: $66,273
There are over 18,500 more people working in the Bend-Redmond, Oregon, metro area today than there were five years ago. The near nation-leading employment growth was driven largely by the trade, transportation, and utilities industry, which added a net of 3,200 jobs between May 2014 and May 2019. The rapid job growth contributed to unemployment falling from 7.4% in May 2014 to 3.3% in May 2019.
The strong job market likely helps explain the metro area’s relative prosperity. The poverty rate of 9.4% in Bend-Redmond is well below the national poverty rate of 13.4%.
[in-text-ad-2]
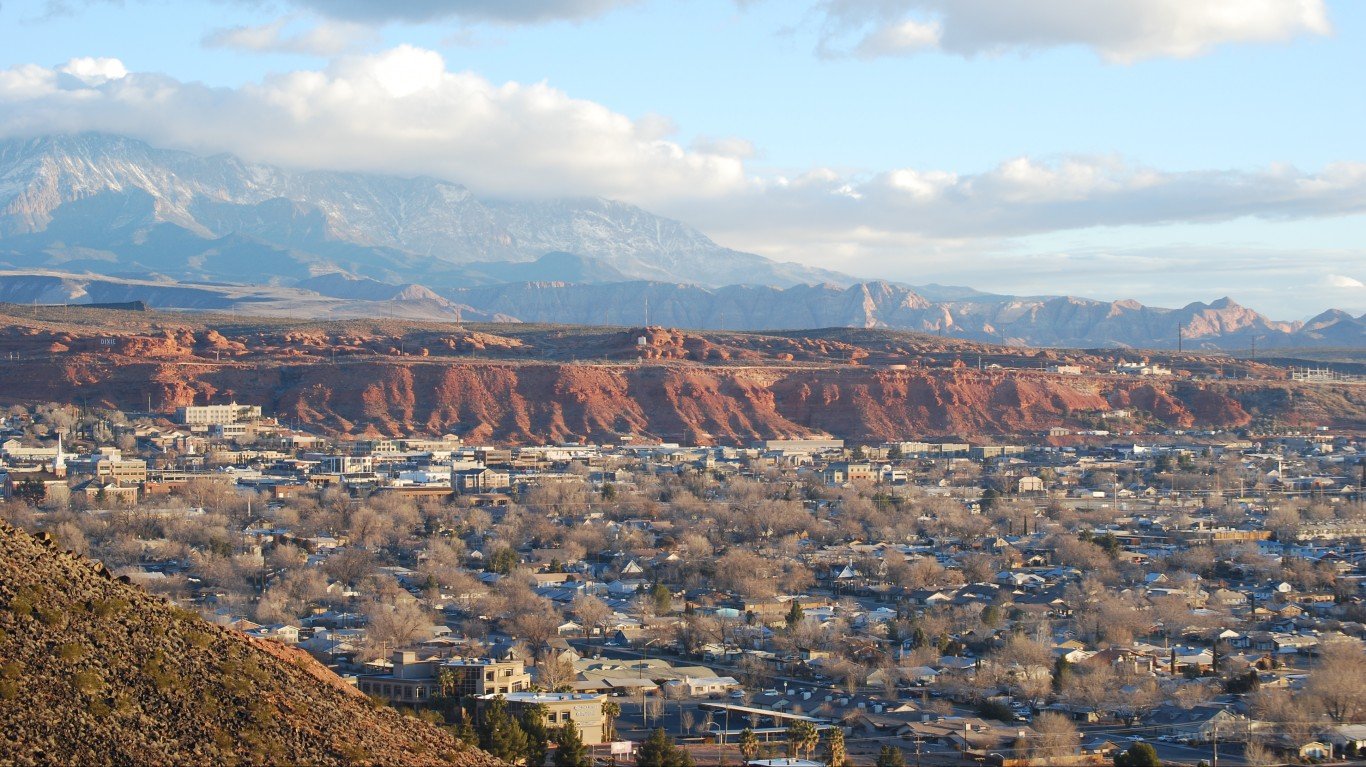
1. St. George, UT
> 5 yr. employment increase: 25.7% (+15,163 jobs)
> Highest growth industry: Trade, transportation, and utilities (+3,900 jobs)
> May 2019 unemployment: 2.9%
> Median household income: $54,842
Overall employment grew at a staggering 25.7% pace in the St. George, Utah, metro area over the last five years. There are currently over 74,000 Americans working in the metro area, up from 59,000 in 2014. Even though the size of the metro area’s labor force also grew by a nation-leading 24.2% over the same period, job growth more than kept pace with demand and the unemployment rate in the city fell to 2.9% in May from 4.0% in 2014.
Over the last five years, the trade, transportation, and utilities industry accounted for the most job growth. Of the more than 15,000 net new jobs in the city, 3,900 were in the trade, transportation, and utilities industry.
Methodology
To identify the American cities adding the most jobs, 24/7 Wall St. reviewed percent change in total employment over the five years from May 2014 to May 2019 in U.S. metro areas. Employment (the number of people employed), the total size of the labor force (those working and looking for work), and the number of unemployed workers are all from the Bureau of Labor Statistics. The unemployment rate is also from the BLS and is as of May 2019. Employment by industry at the sector level is also from the BLS, and five-year changes were calculated from May 2014 to May 2019. Five-year population change was calculated from 2012 to 2017 and is from the U.S. Census Bureau’s American Community Survey. Median household income is for 2017 and also from the ACS.
Contact [email protected] for any questions or corrections.