Counties With Worst Drug Problems in Every State
formulanone / Flickr Alabama: Escambia County > Annual drug deaths per 100,000 residents: 32.3 (county) 16.8 (state) > Drug-related deaths, 2013-17: 61 (county) 4,073 (state) > Poverty rate: 23.8% (county) 18.0% (state) > Population: 37,621 volvob12b / Flickr Alaska: Juneau…

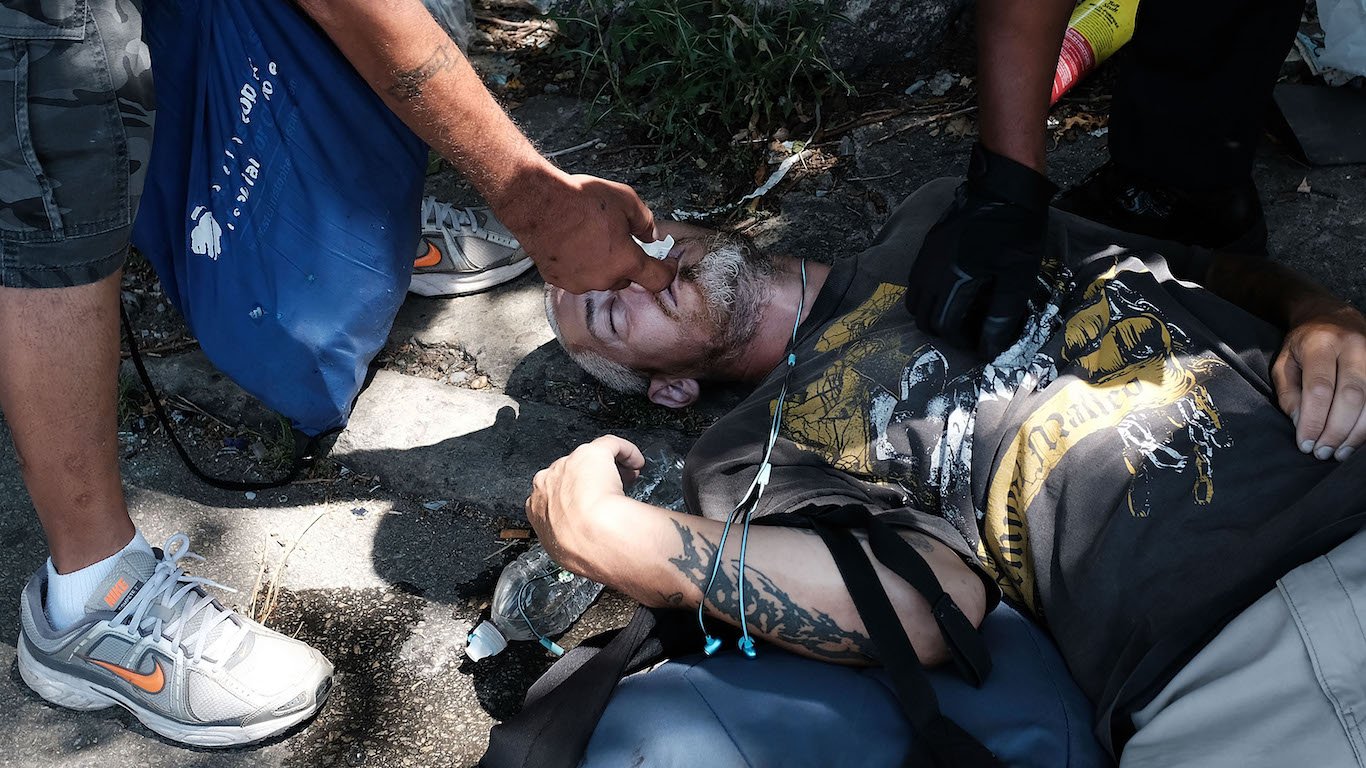
Litigation over America’s opioid crisis has gathered steam in recent months. In a civil suit similar to the suits brought against Big Tobacco 20 years ago, nearly 2,000 towns, cities, and counties are seeking billions of dollars from two dozen drug companies in federal court. The suit alleges the drug industry failed to adequately control the distribution of prescription painkillers and is largely responsible for the country’s opioid epidemic.
Many of the communities most affected by drug addiction and overdose death are low income, rural parts of the country. Often, economic opportunities are more limited in these areas, and social isolation is worse. There are also fewer resources for substance abuse treatment. In nearly every state, there is a county where residents die of drug overdoses at a higher annual rate than the national figure of 18.2 fatalities per 100,000 Americans.
To determine the counties with the worst drug problem in every state, 24/7 Wall St. reviewed the average number of drug-related deaths per 100,000 residents each year during the 2013 to 2017 period with data from the Centers for Disease Control and Prevention’s WONDER web application. Several of the entries on this list are cities, but function as county equivalents in their states, and for this reason are treated as counties by the U.S. Census Bureau and in our analysis.
One of the biggest predictors of opiate addiction and substance abuse is poverty. In 42 of the 50 counties with the highest overdose rates in their states, the poverty rate is greater than the 14.6% U.S. figure.
Drug addiction and overdose are also linked with other serious public health issues America is facing today, such as obesity, physical inactivity, poor nutrition, and poor access to health care. Consequently, several of the counties on this list also can be found on this list of the worst county to live in every state, and also on this list of the least healthy county in every state.
Opiates were present in 67.8% of the 70,237 fatal drug overdoses in the United States in 2017. Other leading causes of drug overdose death include cocaine, benzodiazepines, psychostimulants such as methamphetamine, and antidepressants. These are the 25 most dangerous drugs.
Click here to see the counties with worst drug problems in every state
Click here to read our methodology
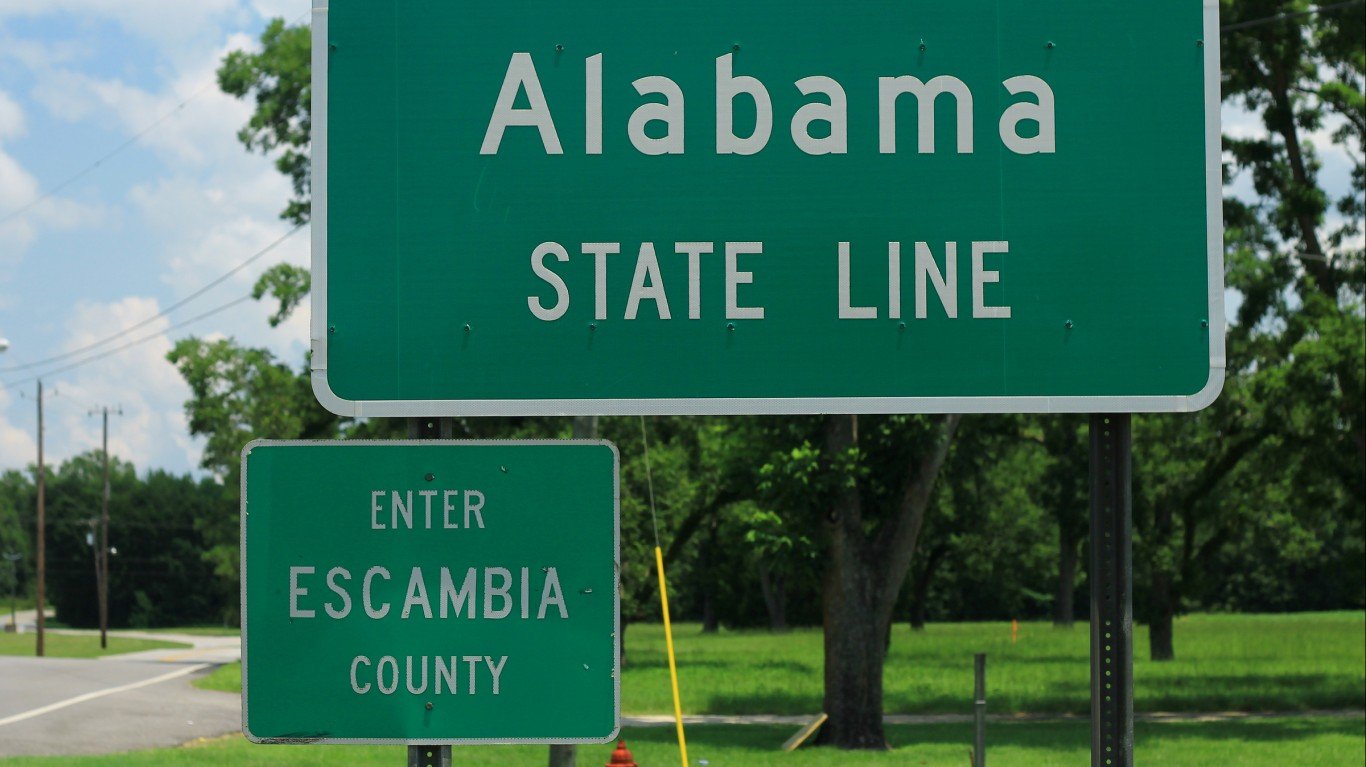
Alabama: Escambia County
> Annual drug deaths per 100,000 residents: 32.3 (county) 16.8 (state)
> Drug-related deaths, 2013-17: 61 (county) 4,073 (state)
> Poverty rate: 23.8% (county) 18.0% (state)
> Population: 37,621

Alaska: Juneau City and Borough
> Annual drug deaths per 100,000 residents: 27.1 (county) 17.9 (state)
> Drug-related deaths, 2013-17: 44 (county) 660 (state)
> Poverty rate: 7.4% (city and borough) 10.2% (state)
> Population: 32,434

Arizona: Gila County
> Annual drug deaths per 100,000 residents: 37.2 (county) 20.7 (state)
> Drug-related deaths, 2013-17: 99 (county) 7,057 (state)
> Poverty rate: 21.9% (county) 17.0% (state)
> Population: 53,145

Arkansas: Garland County
> Annual drug deaths per 100,000 residents: 27.7 (county) 13.8 (state)
> Drug-related deaths, 2013-17: 135 (county) 2,049 (state)
> Poverty rate: 19.1% (county) 18.1% (state)
> Population: 97,994

California: Lake County
> Annual drug deaths per 100,000 residents: 48.0 (county) 12.8 (state)
> Drug-related deaths, 2013-17: 154 (county) 24,984 (state)
> Poverty rate: 22.8% (county) 15.1% (state)
> Population: 64,095
Colorado: Huerfano County
> Annual drug deaths per 100,000 residents: 64.0 (county) 17.3 (state)
> Drug-related deaths, 2013-17: 21 (county) 4,697 (state)
> Poverty rate: 14.8% (county) 11.5% (state)
> Population: 6,498
Connecticut: Windham County
> Annual drug deaths per 100,000 residents: 29.8 (county) 23.2 (state)
> Drug-related deaths, 2013-17: 174 (county) 4,166 (state)
> Poverty rate: 11.1%
> Population: 116,674
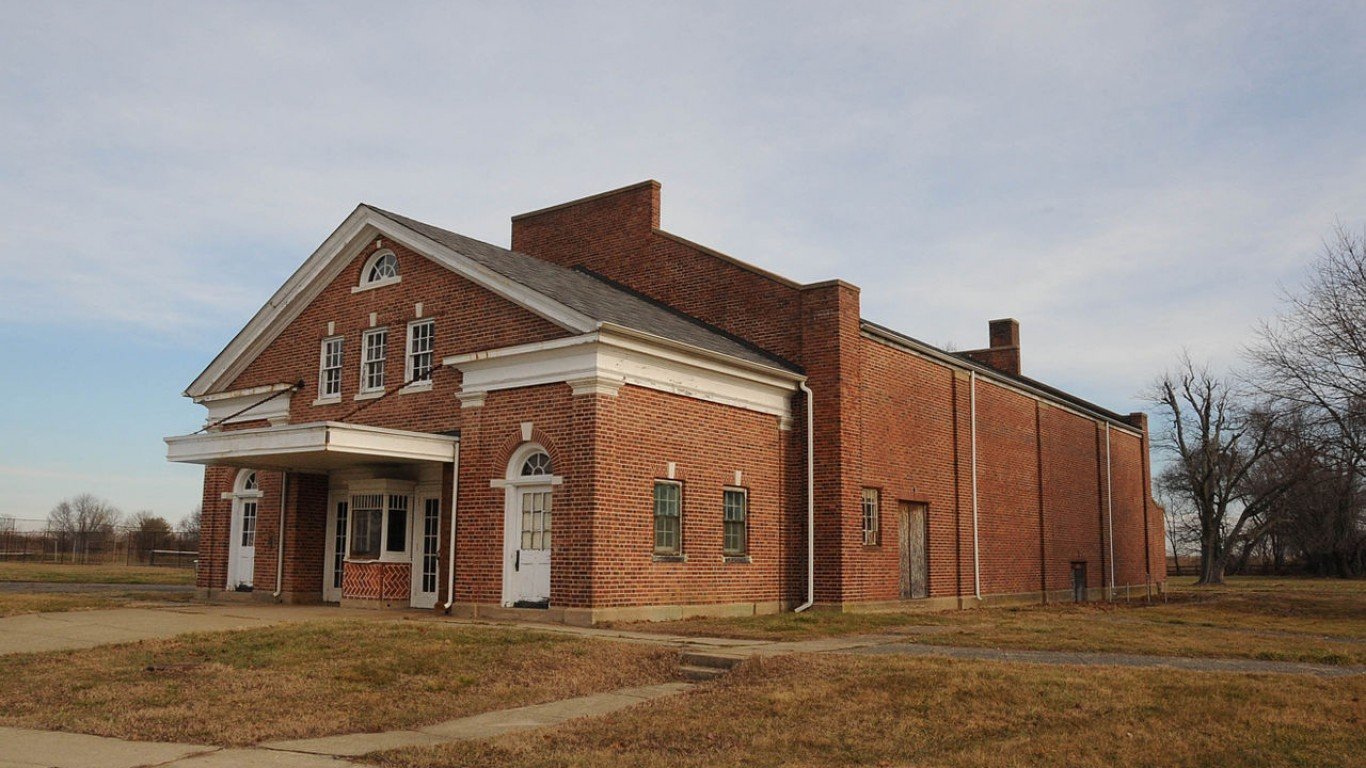
Delaware: New Castle County
> Annual drug deaths per 100,000 residents: 26.8 (county) 25.7 (state)
> Drug-related deaths, 2013-17: 744 (county) 1,212 (state)
> Poverty rate: 11.9%
> Population: 555,036
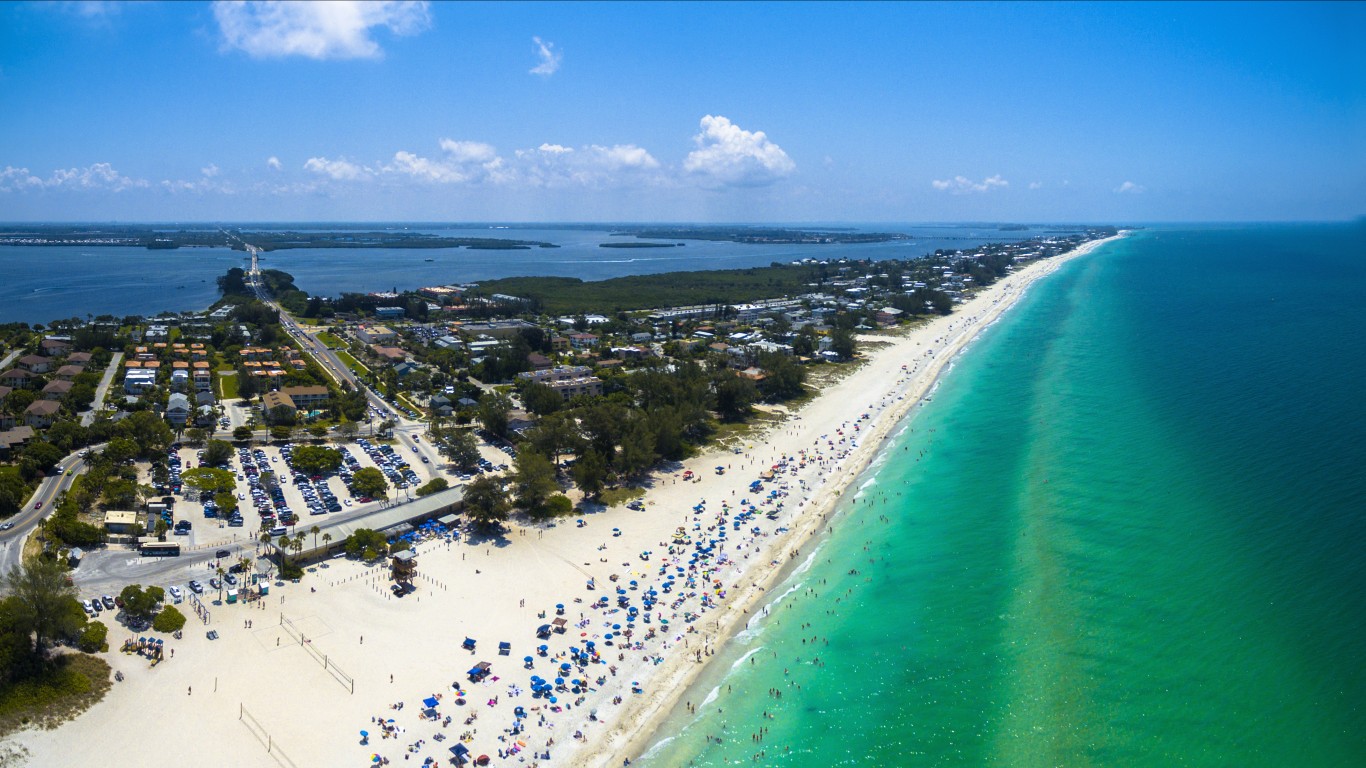
Florida: Manatee County
> Annual drug deaths per 100,000 residents: 35.5 (county) 18.9 (state)
> Drug-related deaths, 2013-17: 645 (county) 19,094 (state)
> Poverty rate: 13.4%
> Population: 363,542
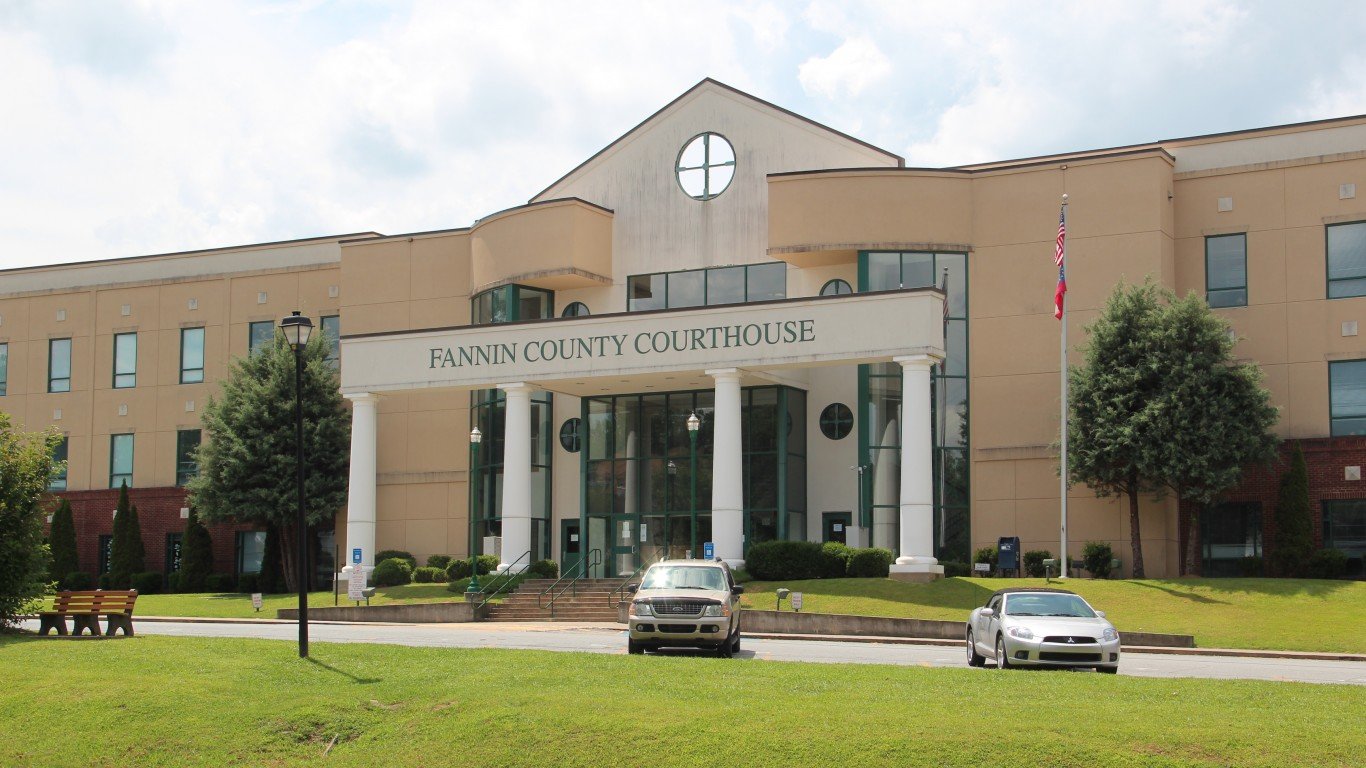
Georgia: Fannin County
> Annual drug deaths per 100,000 residents: 28.7 (county) 13.5 (state)
> Drug-related deaths, 2013-17: 35 (county) 6,888 (state)
> Poverty rate: 15.8%
> Population: 24,480

Hawaii: Maui County
> Annual drug deaths per 100,000 residents: 14.0 (county) 13.3 (state)
> Drug-related deaths, 2013-17: 115 (county) 944 (state)
> Poverty rate: 10.0% (county) 10.3% (state)
> Population: 164,094
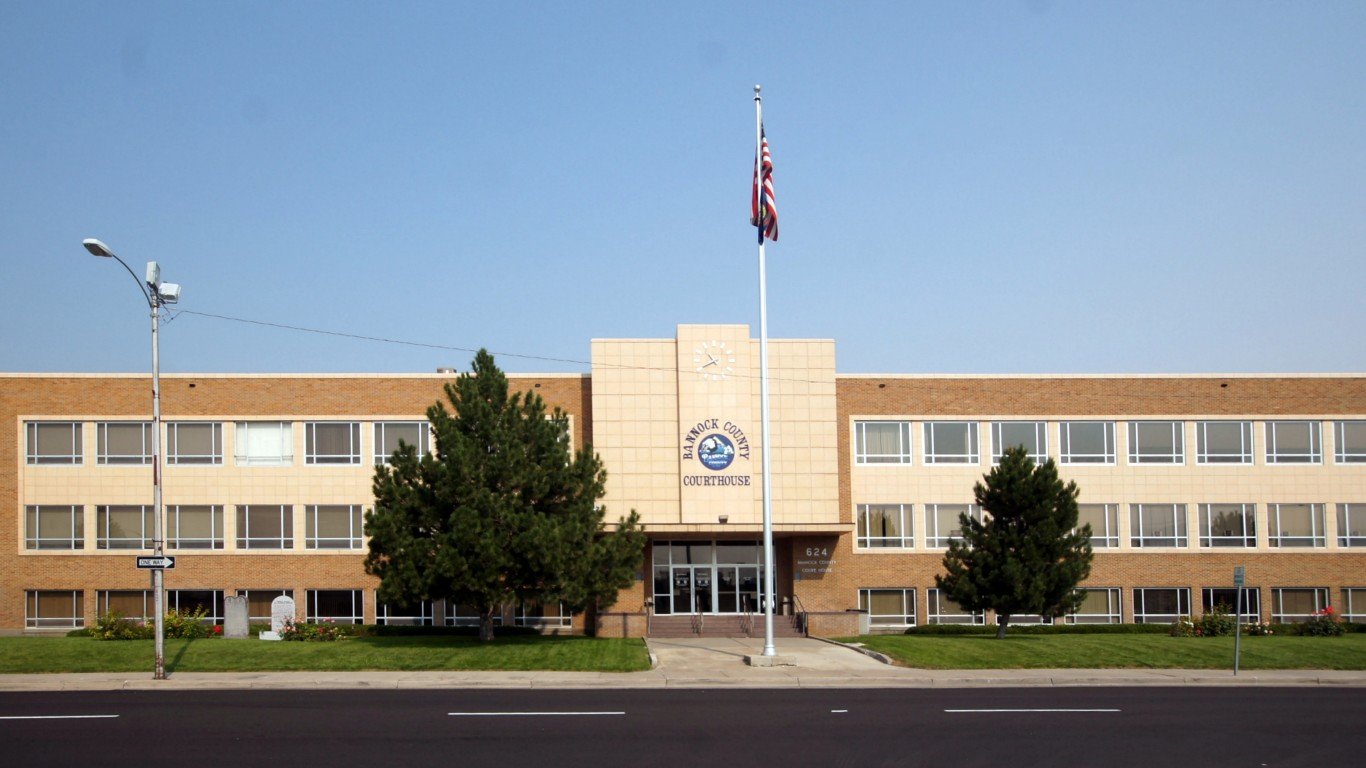
Idaho: Bannock County
> Annual drug deaths per 100,000 residents: 25.5 (county) 14.3 (state)
> Drug-related deaths, 2013-17: 107 (county) 1,183 (state)
> Poverty rate: 17.6% (county) 14.5% (state)
> Population: 84,113

Illinois: Winnebago County
> Annual drug deaths per 100,000 residents: 34.2 (county) 16.3 (state)
> Drug-related deaths, 2013-17: 492 (county) 10,482 (state)
> Poverty rate: 15.3% (county) 13.5% (state)
> Population: 287,512
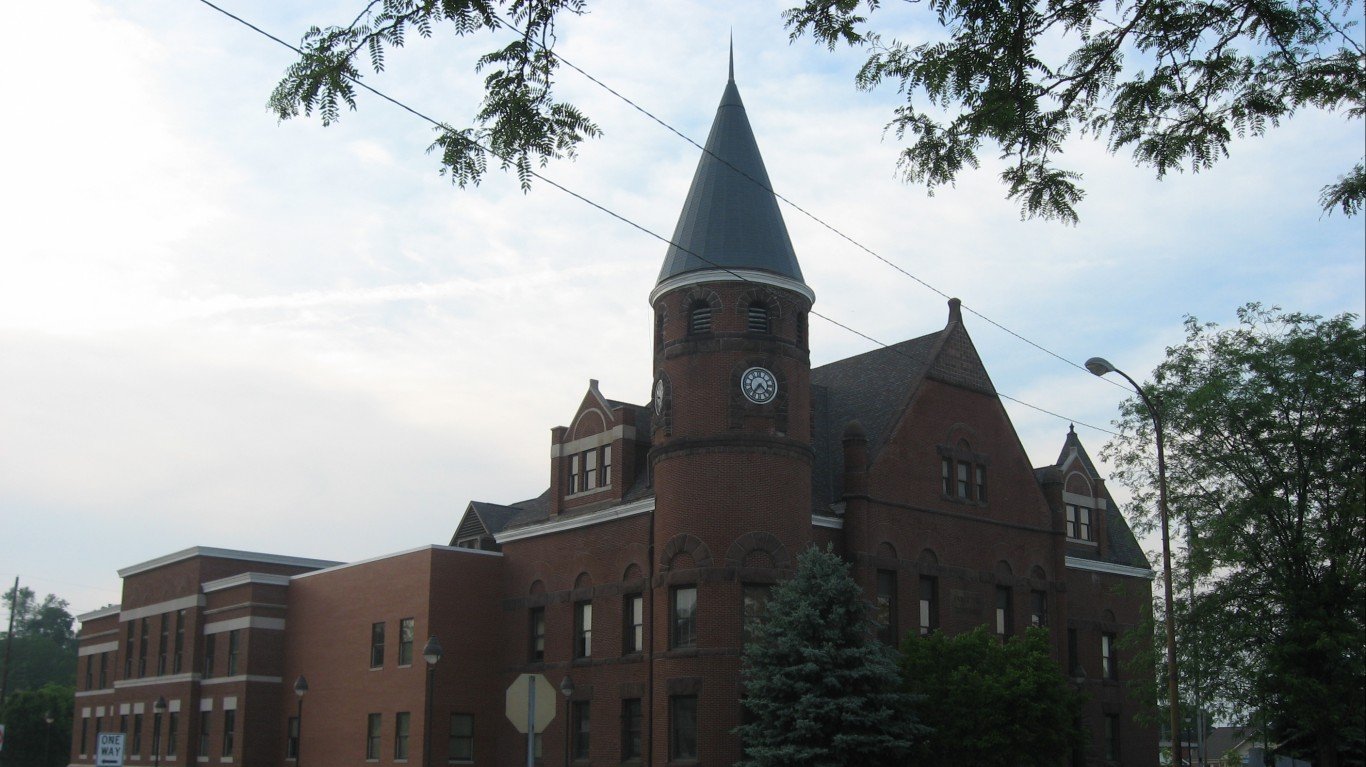
Indiana: Fayette County
> Annual drug deaths per 100,000 residents: 61.4 (county) 21.6 (state)
> Drug-related deaths, 2013-17: 72 (county) 7,164 (state)
> Poverty rate: 18.2% (county) 14.6% (state)
> Population: 23,426
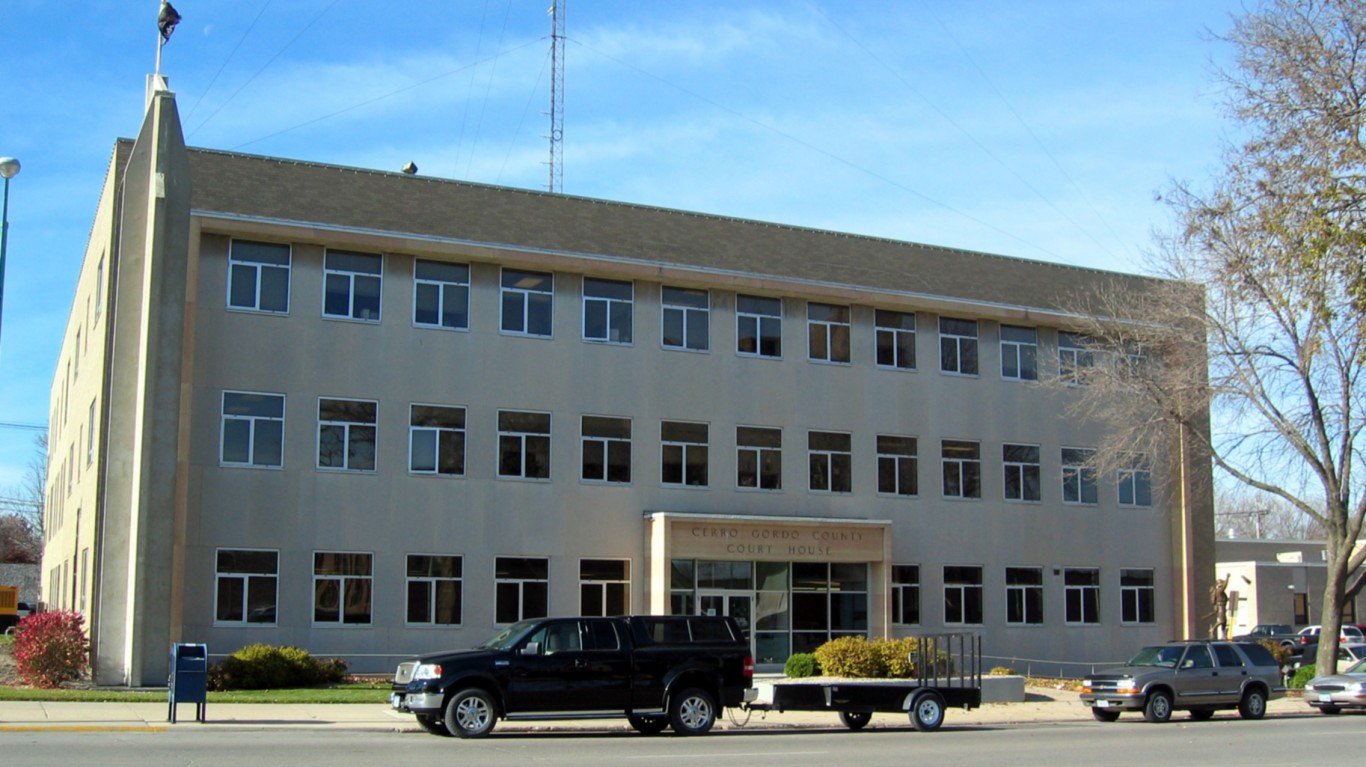
Iowa: Cerro Gordo County
> Annual drug deaths per 100,000 residents: 18.5 (county) 10.2 (state)
> Drug-related deaths, 2013-17: 40 (county) 1,587 (state)
> Poverty rate: 11.3% (county) 12.0% (state)
> Population: 43,134
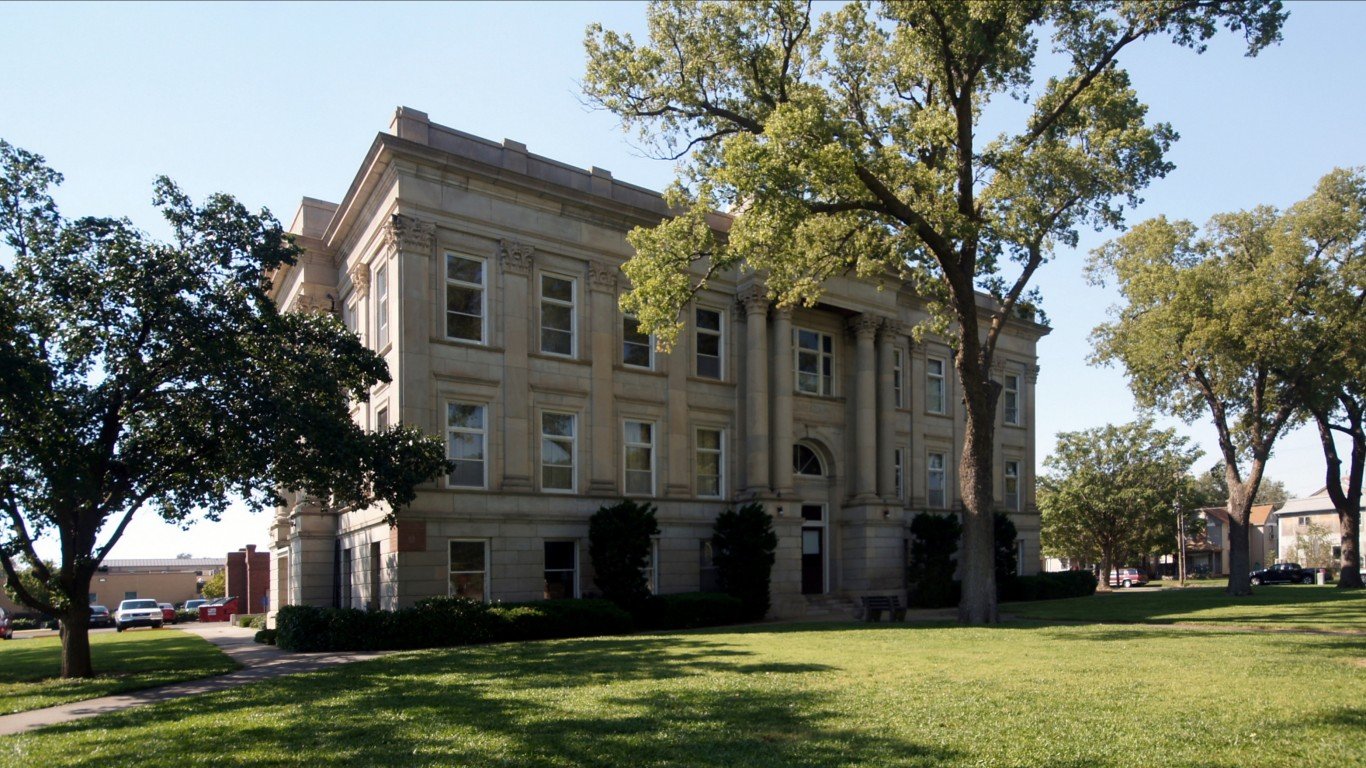
Kansas: Saline County
> Annual drug deaths per 100,000 residents: 19.1 (county) 12.0 (state)
> Drug-related deaths, 2013-17: 53 (county) 1,747 (state)
> Poverty rate: 12.6% (county) 12.8% (state)
> Population: 55,334
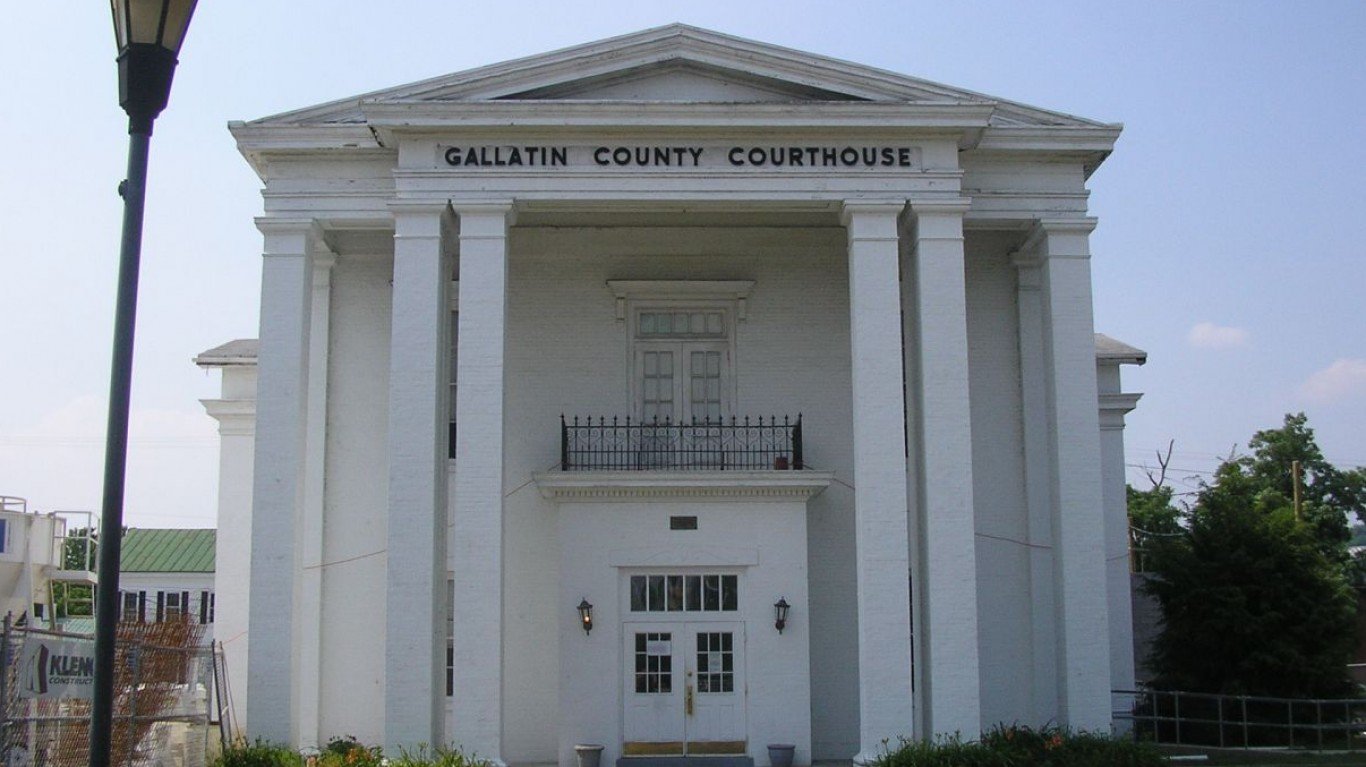
Kentucky: Gallatin County
> Annual drug deaths per 100,000 residents: 65.0 (county) 30.3 (state)
> Drug-related deaths, 2013-17: 28 (county) 6,696 (state)
> Poverty rate: 13.4% (county) 18.3% (state)
> Population: 8,652

Louisiana: Washington Parish
> Annual drug deaths per 100,000 residents: 45.3 (county) 20.3 (state)
> Drug-related deaths, 2013-17: 105 (county) 4,721 (state)
> Poverty rate: 26.3% (parish) 19.6% (state)
> Population: 46,449

Maine: Washington County
> Annual drug deaths per 100,000 residents: 37.8 (county) 22.5 (state)
> Drug-related deaths, 2013-17: 60 (county) 1,500 (state)
> Poverty rate: 18.2% (county) 12.9% (state)
> Population: 31,822

Maryland: Baltimore City
> Annual drug deaths per 100,000 residents: 61.6 (county) 25.7 (state)
> Drug-related deaths, 2013-17: 1,906 (county) 7,708 (state)
> Poverty rate: 22.4% (county) 9.7% (state)
> Population: 619,796

Massachusetts: Bristol County
> Annual drug deaths per 100,000 residents: 39.3 (county) 27.0 (state)
> Drug-related deaths, 2013-17: 1,095 (county) 9,155 (state)
> Poverty rate: 12.2% (county) 11.1% (state)
> Population: 557,016
Michigan: Macomb County
> Annual drug deaths per 100,000 residents: 35.5 (county) 24.0 (state)
> Drug-related deaths, 2013-17: 1,534 (county) 11,911 (state)
> Poverty rate: 11.8% (county) 15.6% (state)
> Population: 864,019
Minnesota: Cass County
> Annual drug deaths per 100,000 residents: 27.1 (county) 12.4 (state)
> Drug-related deaths, 2013-17: 39 (county) 3,393 (state)
> Poverty rate: 15.3% (county) 10.5% (state)
> Population: 28,810

Mississippi: Hancock County
> Annual drug deaths per 100,000 residents: 29.8 (county) 12.2 (state)
> Drug-related deaths, 2013-17: 69 (county) 1,818 (state)
> Poverty rate: 17.2% (county) 21.5% (state)
> Population: 46,277

Missouri: St. Louis
> Annual drug deaths per 100,000 residents: 47.3 (county) 20.0 (state)
> Drug-related deaths, 2013-17: 744 (county) 6,090 (state)
> Poverty rate: 25.0% (city) 14.6% (state)
> Population: 314,867

Montana: Lake County
> Annual drug deaths per 100,000 residents: 23.0 (county) 14.0 (state)
> Drug-related deaths, 2013-17: 34 (county) 721 (state)
> Poverty rate: 20.9% (county) 14.4% (state)
> Population: 29,518

Nebraska: Douglas County
> Annual drug deaths per 100,000 residents: 9.3 (county) 7.7 (state)
> Drug-related deaths, 2013-17: 255 (county) 725 (state)
> Poverty rate: 13.5% (county) 12.0% (state)
> Population: 549,706

Nevada: Carson City
> Annual drug deaths per 100,000 residents: 33.0 (county) 22.0 (state)
> Drug-related deaths, 2013-17: 90 (county) 3,182 (state)
> Poverty rate: 14.7% (city) 14.2% (state)
> Population: 54,219

New Hampshire: Hillsborough County
> Annual drug deaths per 100,000 residents: 36.7 (county) 29.6 (state)
> Drug-related deaths, 2013-17: 746 (county) 1,972 (state)
> Poverty rate: 8.6% (county) 8.1% (state)
> Population: 406,371
New Jersey: Camden County
> Annual drug deaths per 100,000 residents: 35.8 (county) 20.2 (state)
> Drug-related deaths, 2013-17: 915 (county) 9,024 (state)
> Poverty rate: 13.1% (county) 10.7% (state)
> Population: 510,996
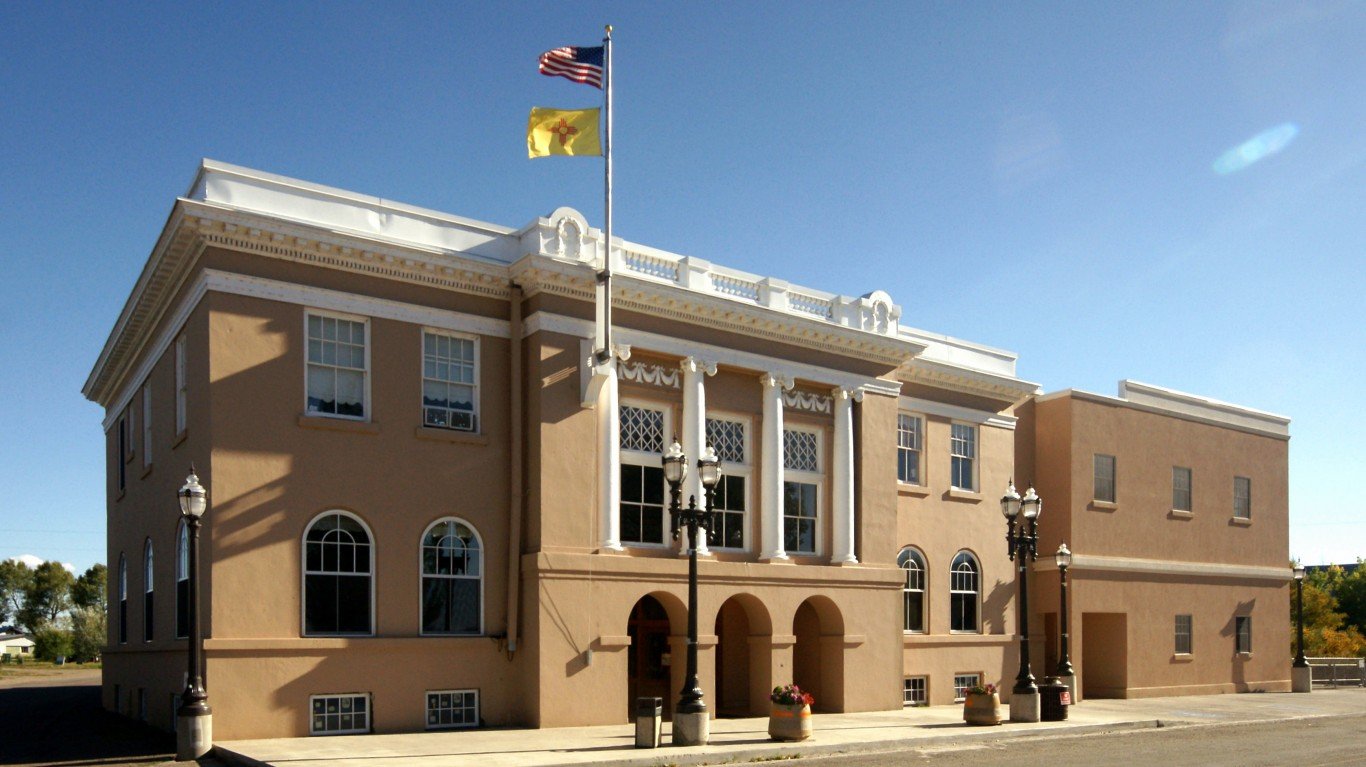
New Mexico: Rio Arriba County
> Annual drug deaths per 100,000 residents: 83.6 (county) 24.8 (state)
> Drug-related deaths, 2013-17: 166 (county) 2,586 (state)
> Poverty rate: 26.4% (county) 20.6% (state)
> Population: 39,455

New York: Sullivan County
> Annual drug deaths per 100,000 residents: 30.2 (county) 16.2 (state)
> Drug-related deaths, 2013-17: 114 (county) 16,013 (state)
> Poverty rate: 15.9% (county) 15.1% (state)
> Population: 75,783
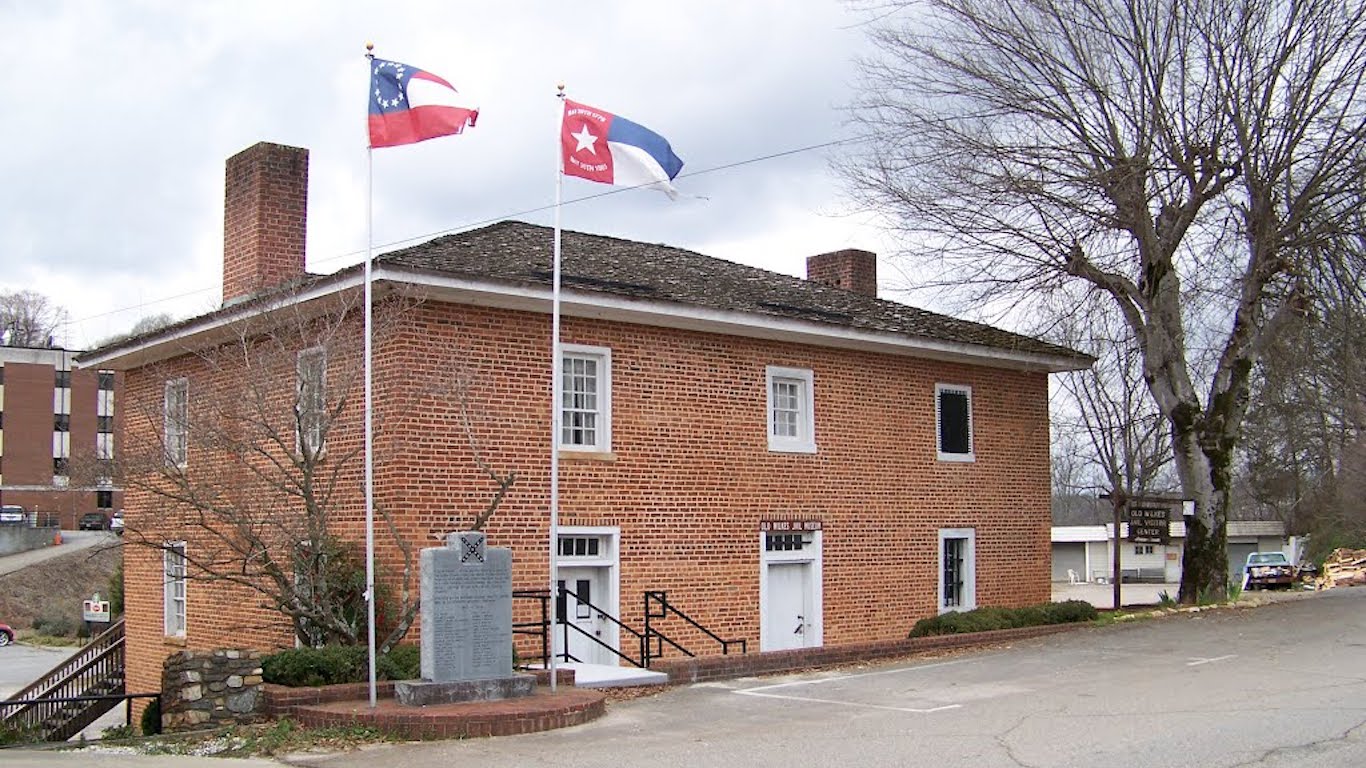
North Carolina: Wilkes County
> Annual drug deaths per 100,000 residents: 41.0 (county) 17.8 (state)
> Drug-related deaths, 2013-17: 141 (county) 8,934 (state)
> Poverty rate: 20.9% (county) 16.1% (state)
> Population: 68,525

North Dakota: Williams County
> Annual drug deaths per 100,000 residents: 12.1 (county) 8.0 (state)
> Drug-related deaths, 2013-17: 20 (county) 299 (state)
> Poverty rate: 9.0% (county) 11.0% (state)
> Population: 32,916

Ohio: Montgomery County
> Annual drug deaths per 100,000 residents: 61.2 (county) 31.8 (state)
> Drug-related deaths, 2013-17: 1,629 (county) 18,476 (state)
> Poverty rate: 17.9% (county) 14.9% (state)
> Population: 531,987

Oklahoma: Johnston County
> Annual drug deaths per 100,000 residents: 43.5 (county) 20.5 (state)
> Drug-related deaths, 2013-17: 24 (county) 4,005 (state)
> Poverty rate: 20.0% (county) 16.2% (state)
> Population: 11,039

Oregon: Curry County
> Annual drug deaths per 100,000 residents: 25.8 (county) 15.4 (state)
> Drug-related deaths, 2013-17: 29 (county) 3,098 (state)
> Poverty rate: 15.5% (county) 14.9% (state)
> Population: 22,377

Pennsylvania: Cambria County
> Annual drug deaths per 100,000 residents: 48.4 (county) 29.7 (state)
> Drug-related deaths, 2013-17: 330 (county) 18,987 (state)
> Poverty rate: 15.6% (county) 13.1% (state)
> Population: 135,871

Rhode Island: Providence County
> Annual drug deaths per 100,000 residents: 30.1 (county) 27.9 (state)
> Drug-related deaths, 2013-17: 953 (county) 1,475 (state)
> Poverty rate: 16.7% (county) 13.4% (state)
> Population: 633,704

South Carolina: Pickens County
> Annual drug deaths per 100,000 residents: 27.5 (county) 16.9 (state)
> Drug-related deaths, 2013-17: 167 (county) 4,146 (state)
> Poverty rate: 18.3% (county) 16.6% (state)
> Population: 121,449

South Dakota: Minnehaha County
> Annual drug deaths per 100,000 residents: 10.4 (county) 8.3 (state)
> Drug-related deaths, 2013-17: 96 (county) 355 (state)
> Poverty rate: 11.0% (county) 13.9% (state)
> Population: 183,660
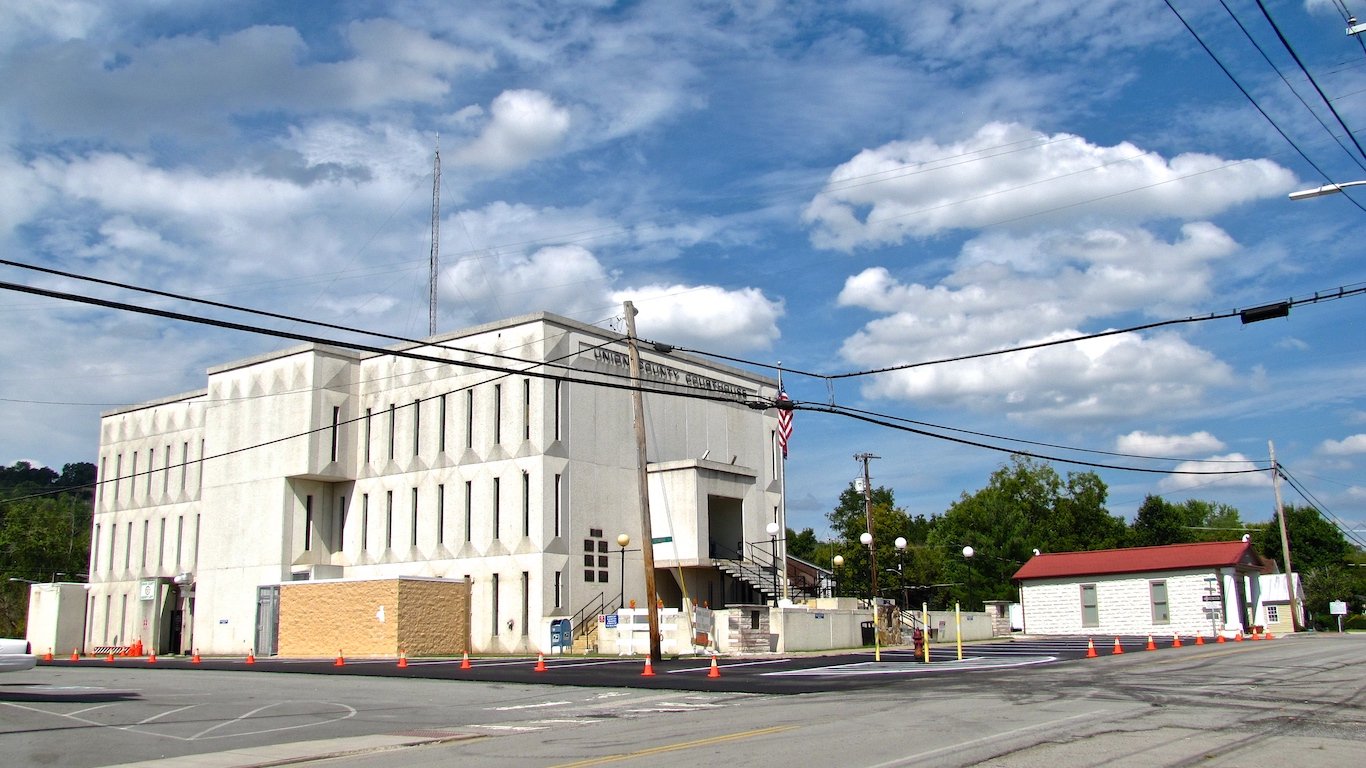
Tennessee: Union County
> Annual drug deaths per 100,000 residents: 49.0 (county) 23.6 (state)
> Drug-related deaths, 2013-17: 47 (county) 7,798 (state)
> Poverty rate: 21.6% (county) 16.7% (state)
> Population: 19,176
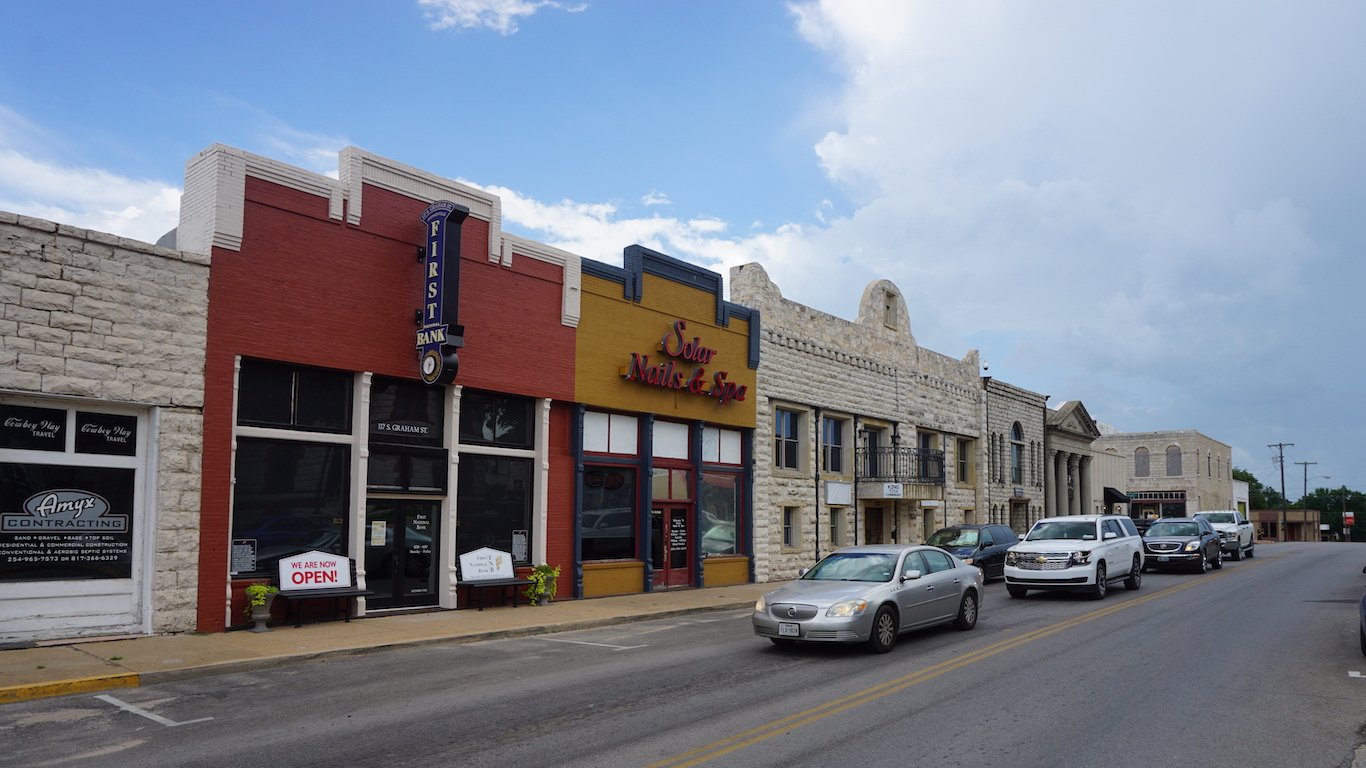
Texas: Young County
> Annual drug deaths per 100,000 residents: 26.4 (county) 10.3 (state)
> Drug-related deaths, 2013-17: 24 (county) 14,150 (state)
> Poverty rate: 16.5% (county) 16.0% (state)
> Population: 18,166
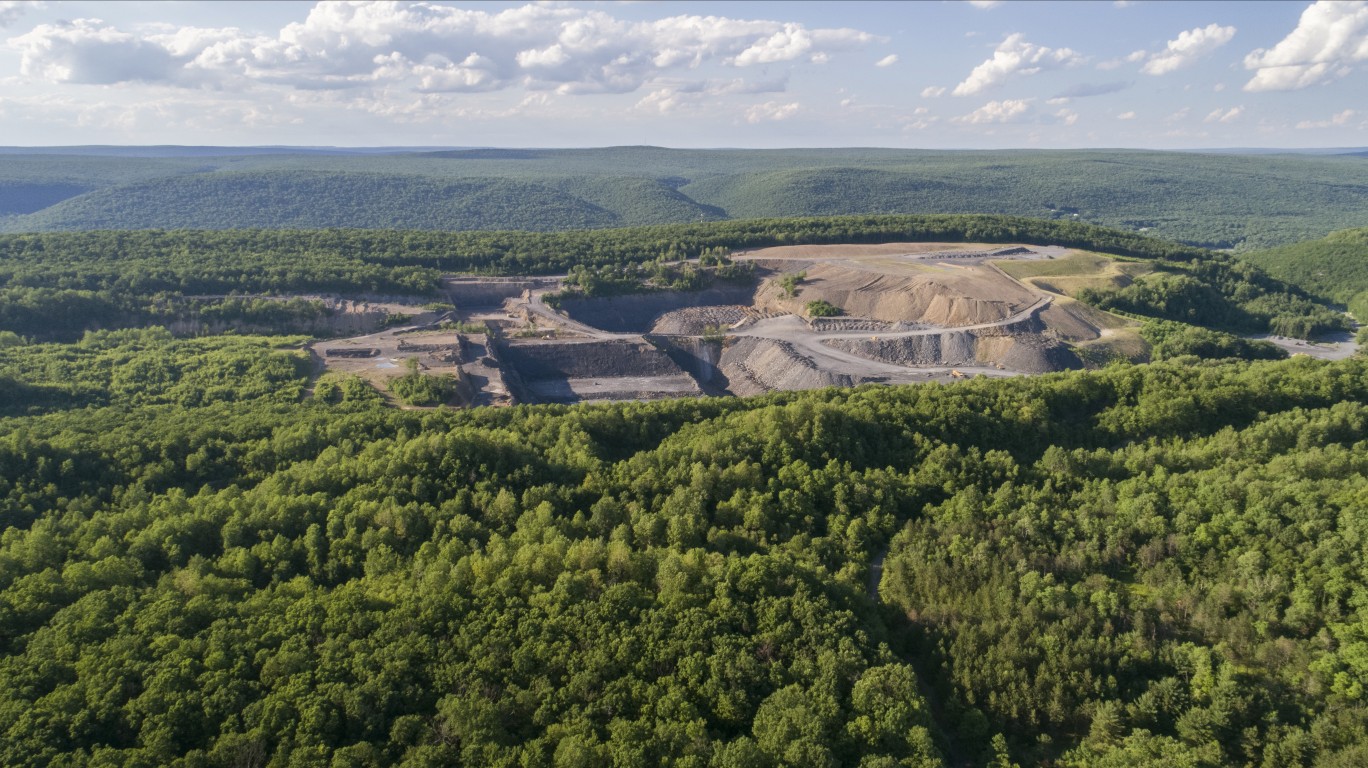
Utah: Carbon County
> Annual drug deaths per 100,000 residents: 54.5 (county) 21.8 (state)
> Drug-related deaths, 2013-17: 56 (county) 3,272 (state)
> Poverty rate: 16.2% (county) 11.0% (state)
> Population: 20,512
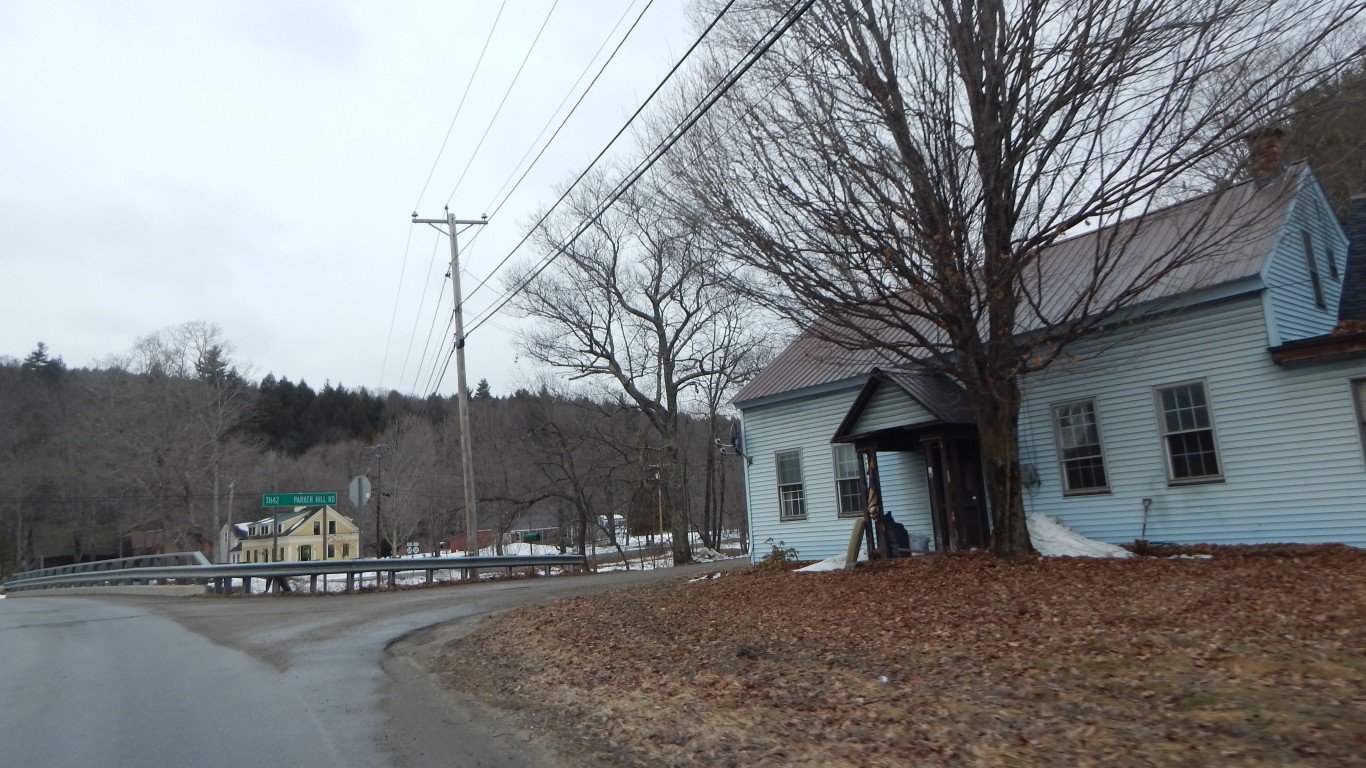
Vermont: Windham County
> Annual drug deaths per 100,000 residents: 23.0 (county) 18.4 (state)
> Drug-related deaths, 2013-17: 50 (county) 576 (state)
> Poverty rate: 14.1% (county) 11.4% (state)
> Population: 43,332
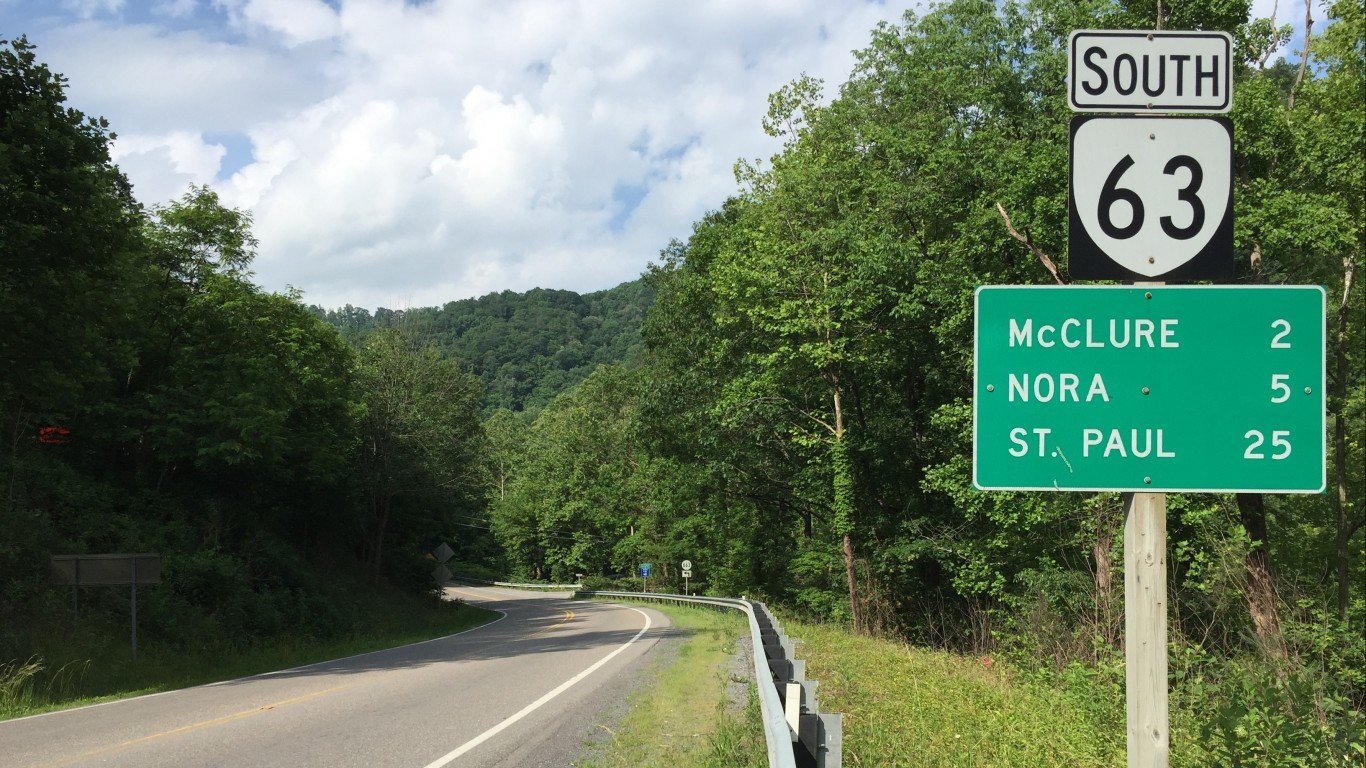
Virginia: Dickenson County
> Annual drug deaths per 100,000 residents: 39.7 (county) 14.3 (state)
> Drug-related deaths, 2013-17: 30 (county) 5,964 (state)
> Poverty rate: 23.0% (county) 11.2% (state)
> Population: 15,181

Washington: Grays Harbor County
> Annual drug deaths per 100,000 residents: 28.8 (county) 16.2 (state)
> Drug-related deaths, 2013-17: 103 (county) 5,810 (state)
> Poverty rate: 16.0% (county) 12.2% (state)
> Population: 71,454

West Virginia: Cabell County
> Annual drug deaths per 100,000 residents: 89.8 (county) 42.6 (state)
> Drug-related deaths, 2013-17: 433 (county) 3,914 (state)
> Poverty rate: 23.2% (county) 17.8% (state)
> Population: 96,100

Wisconsin: Milwaukee County
> Annual drug deaths per 100,000 residents: 30.1 (county) 17.2 (state)
> Drug-related deaths, 2013-17: 1,437 (county) 4,950 (state)
> Poverty rate: 20.5% (county) 12.3% (state)
> Population: 956,586
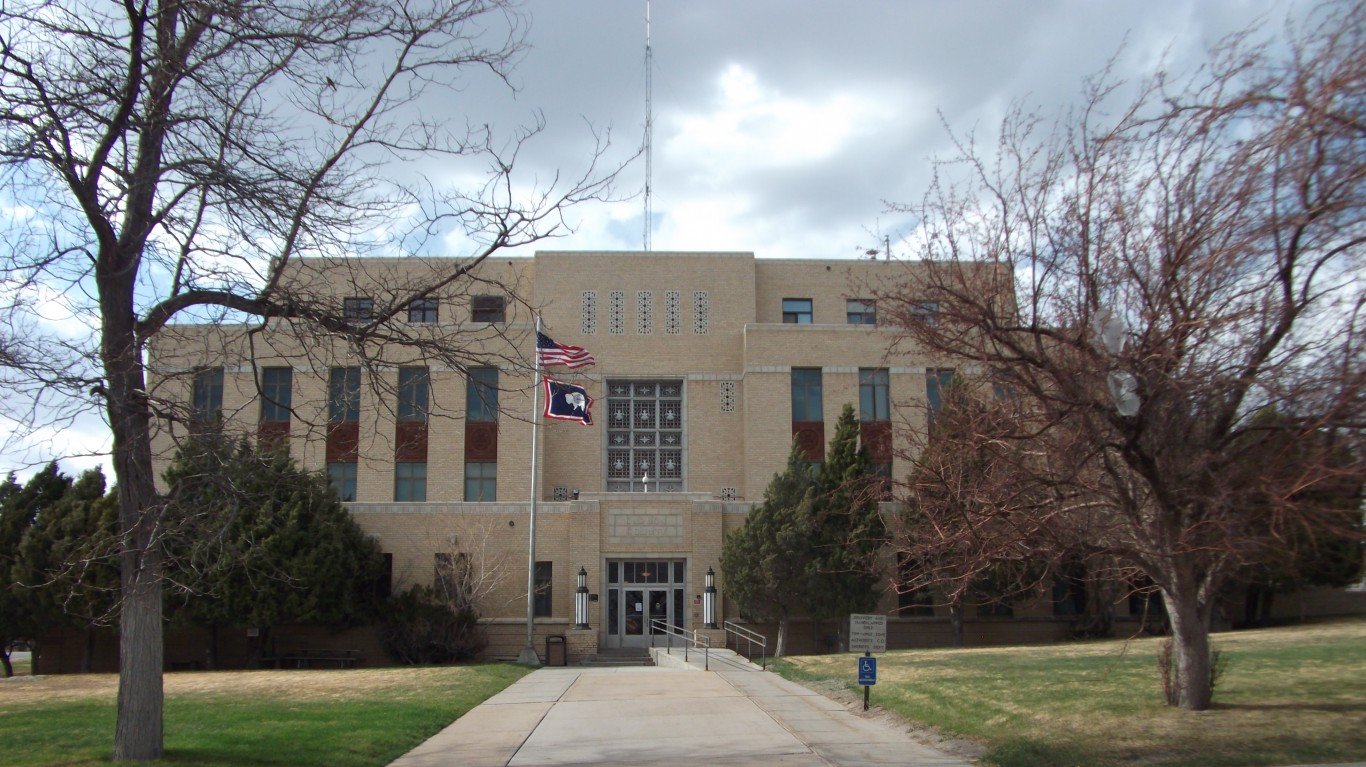
Wyoming: Carbon County
> Annual drug deaths per 100,000 residents: 33.3 (county) 16.6 (state)
> Drug-related deaths, 2013-17: 26 (county) 485 (state)
> Poverty rate: 13.3% (county) 11.1% (state)
> Population: 15,689
Methodology
To determine the counties with the worst drug problem in every state, 24/7 Wall St. reviewed the average number of drug-related deaths per 100,000 residents in all U.S. counties and county equivalents each year for the period 2013 to 2017 with data from the Centers for Disease Control and Prevention’s WONDER web application. The causes of drug-induced deaths include unintentional overdoses, suicide, homicide, and undetermined causes. Figures on poverty and population came from the U.S. Census Bureau’s American Community Survey and are five-year averages for the period 2013 to 2017. All data is for the most recent period available.
Contact [email protected] for any questions or corrections.
Evan Comen is a writer for 24/7 Wall St. He has worked as a data journalist since 2015, covering climate change and urban economics. His work is regularly featured on MSN, and has been cited in many major online and print publications, including The Boston Globe, the Chicago Tribune, and The New York Times.