[cnxvideo id=”847904″ placement=”ros”]
Local governments bear some degree of responsibility for neighborhood safety, economic vitality, the presence and condition of public spaces, and a wide range of other amenities and services that affect the daily lives of local residents. Across the nearly 30,000 cities, towns, villages and unincorporated places in the United States, these and other factors that are closely tied to quality of life vary considerably.
Using over two dozen metrics related to affordability, economy, standard of living, and community, 24/7 Wall St. identified the 50 best cities to live in in the United States. In order to ensure geographic diversity, we only considered the highest ranking city in each county. Data came from a number of sources, including the U.S. Census Bureau and the Centers for Disease Control and Prevention.
It is important to note that there is no such thing as a perfect city or town, and that many of the attributes one may look for in a community are subjective and not quantifiable. This list favors areas with conditions that have almost universal appeal, however. These include short commute times, walkability, reliable public transit, affordability, job availability, entertainment options, cultural attractions, low crime, and access to places like grocery stores and hospitals.
While household income was not itself a factor in the index, many of the cities and towns on this list are relatively wealthy. This is likely not a coincidence, however, as income is closely tied to several other measures used to create this list, including low crime and low unemployment. This is the income it takes to be considered rich in every state.
Population growth can be a sign that a given area is attractive to new residents and families, and not surprisingly, the majority of cities on this list are home to more people today than five years ago. Just over half of the cities on this list reported greater population growth than the U.S. as a whole between 2013 and 2018. Here is a list of the fastest growing place in each state.
Click here to see America’s 50 best cities to live
Click here to see America’s 50 worst cities to live
Click here to read our methodology

50. Bismarck, North Dakota
> Population: 71,731
> 5 yr. population change: +13.2%
> Median household income: $63,608
> 5 yr. avg. unemployment: 1.9%
Substantial population growth is often a sign that a city is a desirable place to live. Bismarck, the second most populous city in North Dakota and also the state capital, has recorded a population increase of more than 13% in the past five years. Steady population growth is often an indication that job opportunities are attracting new residents, and Bismarck’s 5-year average unemployment rate of 1.9% is one of the lowest of any U.S. city. The U.S. average unemployment rate over the last five years is 5.9%.
Bismarck is also a very affordable place to live. Goods and services are on average 12% less expensive in the city compared to nationwide prices, and the typical household in Bismarck has an income slightly higher than the national median.
[in-text-ad]
49. Brewer, Maine
> Population: 9,123
> 5 yr. population change: -3.2%
> Median household income: $58,403
> 5 yr. avg. unemployment: 2.6%
Brewer is a small city in Maine across the Penobscot river from Bangor. The city has one of the lower 5-year average unemployment rates in the country, at just 2.6%, compared to a national figure of 5.9%.
Brewer compares favorably in a number of quality of life metrics, with a relatively low poverty rate, and good access to grocery stores and health care providers. Brewer also has an extremely low violent crime rate, equivalent to roughly one-third the national rate.
[recirclink id=560754]

48. West Fargo, North Dakota
> Population: 34,419
> 5 yr. population change: +27.4%
> Median household income: $81,051
> 5 yr. avg. unemployment: 1.5%
West Fargo is one of two cities in North Dakota to rank on this list — and one of the fastest growing cities in the country. The number of people living in West Fargo increased by 27.4% in the last five years, well above the 3.6% national population growth rate. The city is also adding jobs rapidly, with overall employment climbing 17.9% between 2014 and 2018, well above the comparable 6.5% national job growth. The city’s five-year average unemployment rate of 1.5% is considerably lower than the 5.9% national rate.
With a strong job market, people in West Fargo are less likely than most Americans to face serious financial hardship. The city’s poverty rate of 7.4% is nearly half the 14.1% national rate.

47. Rye, New York
> Population: 15,862
> 5 yr. population change: +0.4%
> Median household income: $180,958
> 5 yr. avg. unemployment: 3.9%
Rye is a small city in Westchester County, New York, just north of Manhattan. Due to its proximity to New York City, Rye residents have access to a wide range of public transit options, and only about 60% of commuters in the city rely on a personal vehicle, compared to about 90% of commuters nationwide. While the cost of living in Rye is higher than in most of the rest of the country, incomes are also high. The typical household in the city earns $180,958 a year, about three times the national median of $60,293.
Like other high income areas on this list, Rye is one of the safest places in the country. There were only 6 violent crimes reported in the city in 2018, or 37.4 per 100,000 people, roughly one-tenth the national violent crime rate of 380.6 per 100,000.
[in-text-ad-2]
46. Plover, Wisconsin
> Population: 12,686
> 5 yr. population change: +4.6%
> Median household income: $60,981
> 5 yr. avg. unemployment: 2.6%
Plover is a small village in central Wisconsin about 100 miles north of Madison. Over the last five years the number of people living in Plover climbed by 4.6%, slightly faster than the comparable 3.6% national population growth. The area’s affordability likely makes it an attractive option for new residents. Goods and services in the village are about 8.3% less expensive than they are nationwide on average. Housing is especially affordable. The typical home in Plover is worth 2.9 times as much as the city’s median household income. Meanwhile, the median home value across the country is 3.4 times higher than the median household income.
Crime is also relatively uncommon in Plover. There were 108.9 violent crimes and 1,361.5 property crimes for every 100,000 residents in 2018, each well below the respective national rates of 380.6 per 100,000 and 2,199.5 per 100,000.

45. San Francisco, California
> Population: 870,044
> 5 yr. population change: +6.4%
> Median household income: $104,552
> 5 yr. avg. unemployment: 4.7%
Home to over 870,000 people, San Francisco is the most populous city on this list. Though its cost of living is higher than nearly every other city in the United States, incomes in San Francisco are generally high enough to offset the high prices at least somewhat. The majority of households in the city earn over $100,000 a year while the typical American household earns only about $60,000.
People living in San Francisco have access to a wide range of entertainment, cultural, and recreation venues. The per capita concentration of places like restaurants, bars, gyms, museums, theater companies, and movie theaters is far higher than average.
[in-text-ad]
44. Lowell, Arkansas
> Population: 8,926
> 5 yr. population change: +18.4%
> Median household income: $66,994
> 5 yr. avg. unemployment: 1.4%
Residents of Lowell, Arkansas benefit from a relatively low cost of living. Goods and services in the city are about 17% cheaper on average than they are nationwide. Not only does a dollar go further in Lowell, but incomes are also relatively high. The typical household in the city earns $66,994 a year, over $6,000 more than the typical American household. Lowell residents are also less likely than most American workers to be out of work, as the area’s five year average unemployment rate of 1.4% is less than one-quarter of the national 5.9% rate.
As is the case in many cities with relatively high wages and low unemployment, Lowell’s population is growing rapidly. In the last five years, the city’s population increased by 15.1%, more than double the comparable 2.8% national population growth rate over the same period.
[recirclink id=595196]
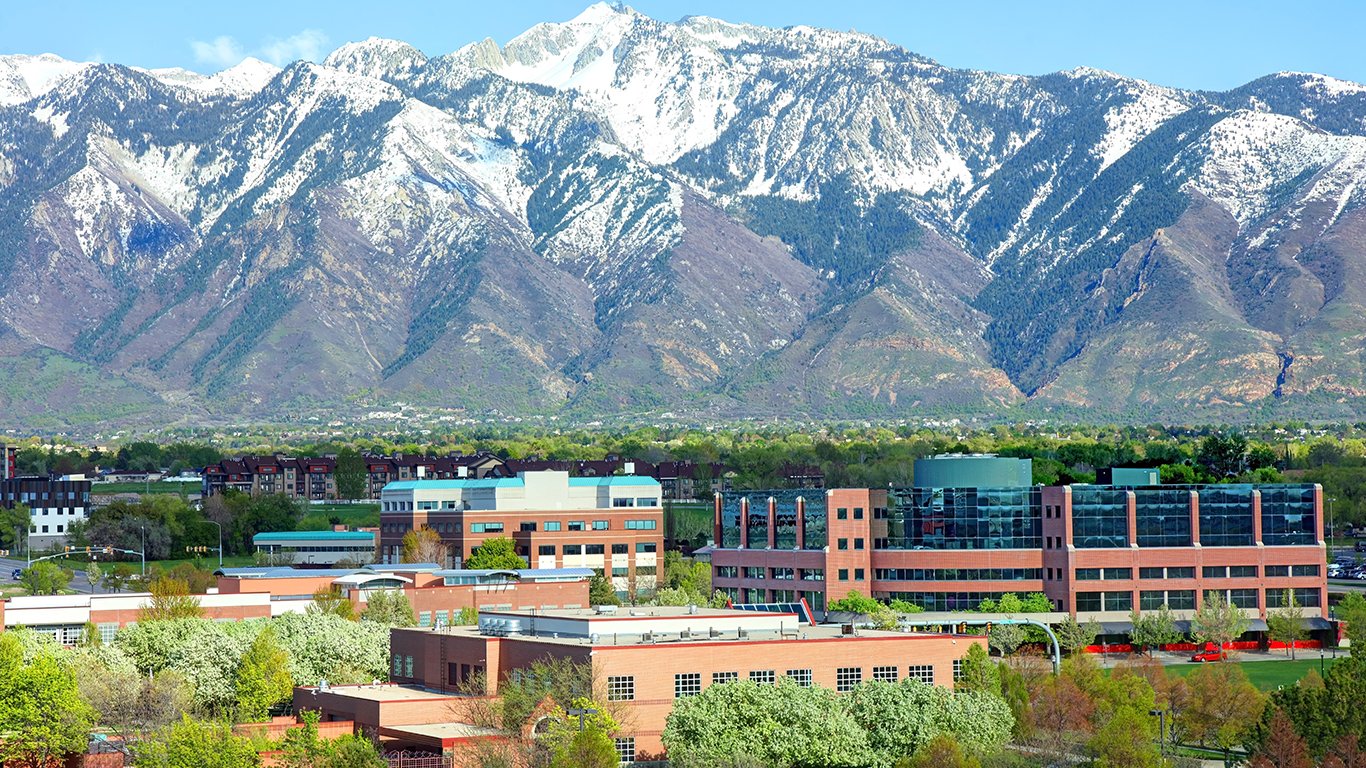
43. Sandy, Utah
> Population: 95,420
> 5 yr. population change: +7.6%
> Median household income: $91,836
> 5 yr. avg. unemployment: 3.1%
Residents of Sandy, a city less than 20 miles south of Salt Lake City, benefit from a healthy job market. Between 2014 and 2018, the number of people working in the city climbed by 9.2%, well above the national employment growth rate of 6.5%. An average of just 3.1% of the local labor force were unemployed in the last five years, well below the comparable 5.9% national rate.
Like many cities and municipalities on this list, Sandy appears to be an attractive place for new residents and families. In the last five years, the city’s population increased by 6.6%, more than double the comparable 2.8% national population growth over the same period.

42. Millbrook, Alabama
> Population: 15,160
> 5 yr. population change: +3.0%
> Median household income: $59,443
> 5 yr. avg. unemployment: 3.7%
Millbrook is the only city in Alabama to rank on this list. Area residents benefit from low effective property rates as the typical homeowner pays just 0.3% of their home value in taxes each year, a fraction of the 1.2% national average. The area also appears to have plenty of opportunities for gainful employment. According to the Census, an average of just 3.7% of Millbrook’s labor force were unemployed in the last five years, a far smaller share than the 5.9% national rate.
Violent crimes like murder, rape, robbery, and aggravated assault are also less common in Millbrook than they are nationwide. The city’s violent crime rate of 285.5 incidents per 100,000 residents is well below the national rate of 380.6 per 100,000.
[in-text-ad-2]
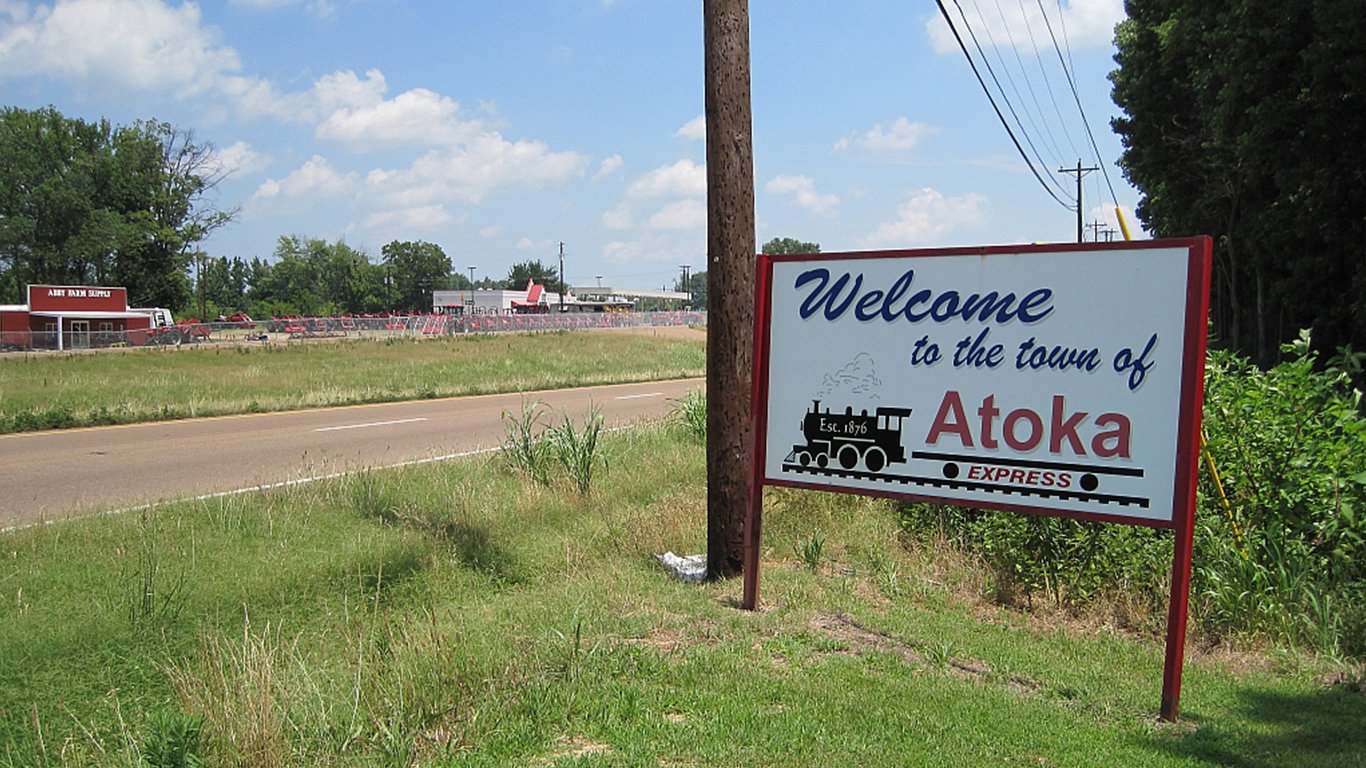
41. Atoka, Tennessee
> Population: 9,139
> 5 yr. population change: +6.7%
> Median household income: $91,228
> 5 yr. avg. unemployment: 2.0%
Atoka is a small town in western Tennessee located just north of Memphis. Atoka reported a 6.7% population increase over the last five years. A strong job market may partially explain the influx of new residents. According to the Census, an average of just 2.0% of Atoka’s labor force were unemployed in the last five years, about one-third the 5.9% national rate. Atoka’s economy also provides relatively high paying jobs. The typical Atoka household earns $91,228 a year, well above the $60,293 national median.
Crime rates are low in Atoka. The city’s violent crime rate of 96.7 incidents per 100,000 people and property crime rate of 870.5 incidents per 100,000 are each well below the respective national rates of 380.6 per 100,000 and 2,199.5 per 100,000.

40. Lone Tree, Colorado
> Population: 14,209
> 5 yr. population change: +22.5%
> Median household income: $115,746
> 5 yr. avg. unemployment: 3.1%
Lone Tree is a small Colorado city located about 20 miles south of downtown Denver. A relatively wealthy area, the typical Lone Tree household earns $115,746 a year, nearly double the national median of $60,293. The high income level is likely due in part to the area’s tight labor market. An average of just 3.1% of Lone Tree’s labor force were unemployed in the last five years, about one-half the 5.9% national rate.
Like many cities and towns on this list, Lone Tree is growing rapidly. Between 2014 and 2018, the city’s population grew by 15.3%, well above the 2.8% national population growth rate.
[in-text-ad]

39. Denver, Colorado
> Population: 693,417
> 5 yr. population change: +12.0%
> Median household income: $63,793
> 5 yr. avg. unemployment: 4.0%
With a population of over 690,000, Denver is one of the largest cities to rank on this list. Denver residents benefit from a higher than typical concentration of cultural attractions and entertainment options like bars, restaurants, museums, movie theaters, and recreation centers.
Many Denver residents also have options when it comes to the daily commute. Some 14.5% of the commuters in the city use transportation other than a personal vehicle, well above the 9.5% share nationwide.
[recirclink id=598777]

38. Mahomet, Illinois
> Population: 8,327
> 5 yr. population change: +12.3%
> Median household income: $115,619
> 5 yr. avg. unemployment: 2.8%
Mahomet is a small village in Illinois, just outside the city of Champaign. Area residents benefit from a healthy job market — between 2014 and 2018, overall employment climbed 24.1% and an average of just 2.8% of the labor force were unemployed in the last five years, compared to the 6.5% national job growth and 5.9% five year average unemployment rate nationwide.
The healthy job market has likely contributed to relative financial security for many area residents. Just 2.2% of Mahomet residents live below the poverty line, compared to 14.1% of the U.S. population. Additionally, the median household income in the area of $115,619 is nearly double the national median of $60,293.

37. Palm Beach, Florida
> Population: 8,667
> 5 yr. population change: +1.7%
> Median household income: $133,026
> 5 yr. avg. unemployment: 2.3%
Palm Beach is a small town located on a barrier island along Florida’s Atlantic coast. A tourist destination, Palm Beach has a greater concentration of marinas, golf courses, and movie theaters than most of the country. Palm Beach’s amenities and ocean front real estate contribute to high housing prices. The typical home in the town is worth $1.1 million. Nationwide, the median home value is $204,900.
Palm Beach is also a relatively safe place. The town’s violent crime rate of 147.1 incidents per 100,000 people and property crime rate of 1,109.0 incidents per 100,000 are each well below the respective national rates of 380.6 per 100,000 and 2,199.5 per 100,000.
[in-text-ad-2]

36. Canandaigua, New York
> Population: 10,348
> 5 yr. population change: -1.8%
> Median household income: $49,198
> 5 yr. avg. unemployment: 4.4%
Located on the northern end of the New York state Finger Lake with the same name, Canandaigua is a popular regional destination and has a far higher than typical concentration of bars, restaurants, hotels, marinas, golf courses, and museums. Canandaigua is also a relatively safe place. There were just 24 violent crimes committed in the city in 2018, equivalent to 234.1 for every 100,000 people, well below the national violent crime rate of 380.6 per 100,000.

35. Buda, Texas
> Population: 14,503
> 5 yr. population change: +69.5%
> Median household income: $84,011
> 5 yr. avg. unemployment: 2.6%
Buda is a small Texas city located about 15 miles from downtown Austin, the state capital. In commuting distance of a major city, the labor force in Buda has access to a wide range of employment options, and partially as a result, the city’s jobless rate is low. An average of just 2.6% of workers in Buda were unemployed in the last five years, less than half the comparable 5.9% national rate.
People living in Buda also benefit from a low cost of living, as goods and services are about 3.1% less expensive in the city than they are nationwide. Not only does a dollar go further in Buda than in much of the rest of the country, but the area is also relatively high-income. The typical household in the city earns $84,011, nearly $24,000 more than the national median.
[in-text-ad]
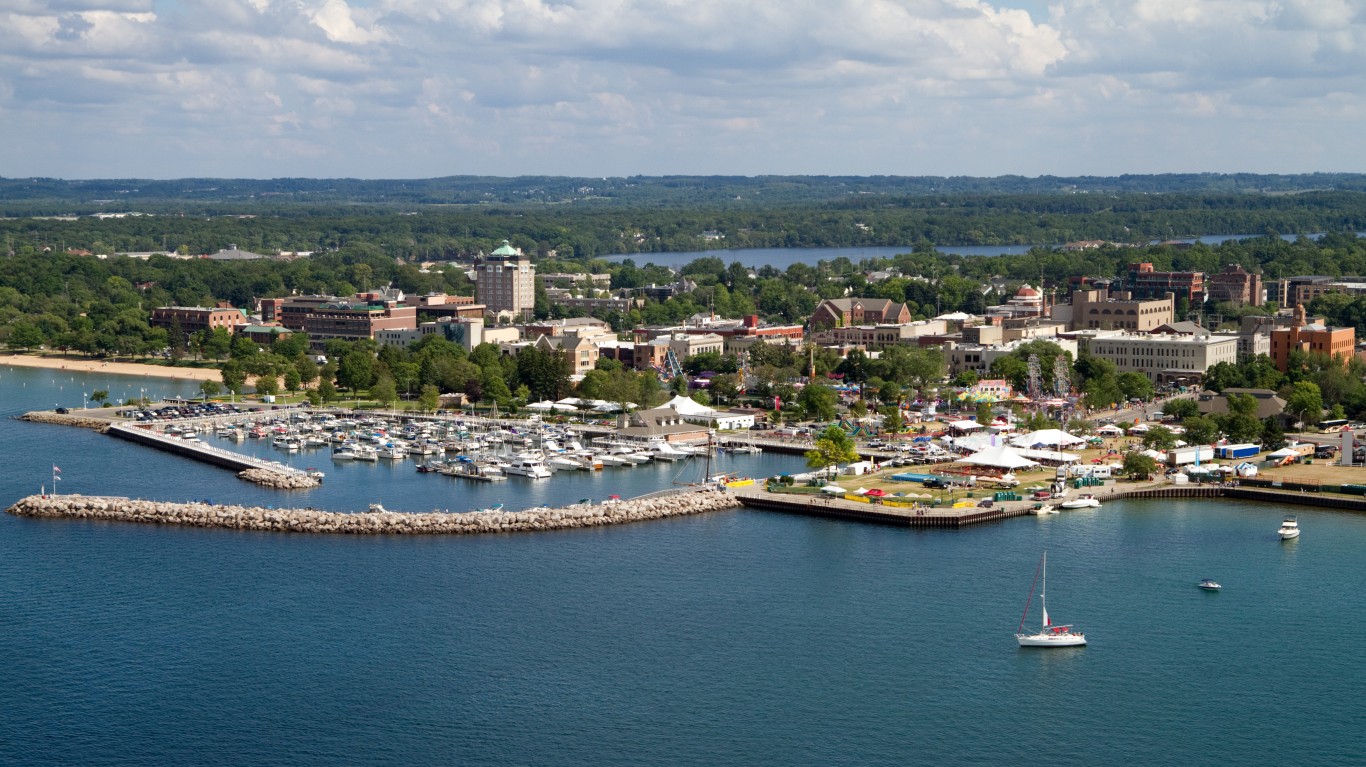
34. Traverse City, Michigan
> Population: 15,474
> 5 yr. population change: +3.6%
> Median household income: $53,871
> 5 yr. avg. unemployment: 4.9%
Traverse City, located in northwestern Michigan on the south end of the Grand Traverse Bay is one of two cities in the state to rank among the best places to live. The city boasts a far higher than typical concentration of entertainment and recreational venues like restaurants, bars, sports centers, and golf courses. Additionally, it is located in Grand Traverse County, where 87.4% of the population have easy access to places for exercise like parks and recreation centers, a larger share than the 84.0% of Americans nationwide.
City residents also benefit from a slightly lower than average cost of living. Goods and services in Traverse City are 6.5% less expensive than they are on average nationwide.
[recirclink id=587549]
33. Kendallville, Indiana
> Population: 9,522
> 5 yr. population change: -5.0%
> Median household income: $42,278
> 5 yr. avg. unemployment: 5.3%
Kendallville is a small city in northeastern Indiana. One reason Kendallville ranks among the best places to live is its affordability. Goods and services in the city are about 14.5% less expensive than they are nationwide on average. Housing is especially affordable. The typical home in Kendallville is worth 2.3 times as much as the city’s median household income. Meanwhile, the median home value across the country is 3.4 times higher than the median household income.
While Kendalville’s median household income of $42,278 is well below the national median of $60,293, area residents are less likely than most Americans to face serious financial hardship. Just 12.1% of Kendallville residents live below the poverty line compared to 14.1% of people nationwide.
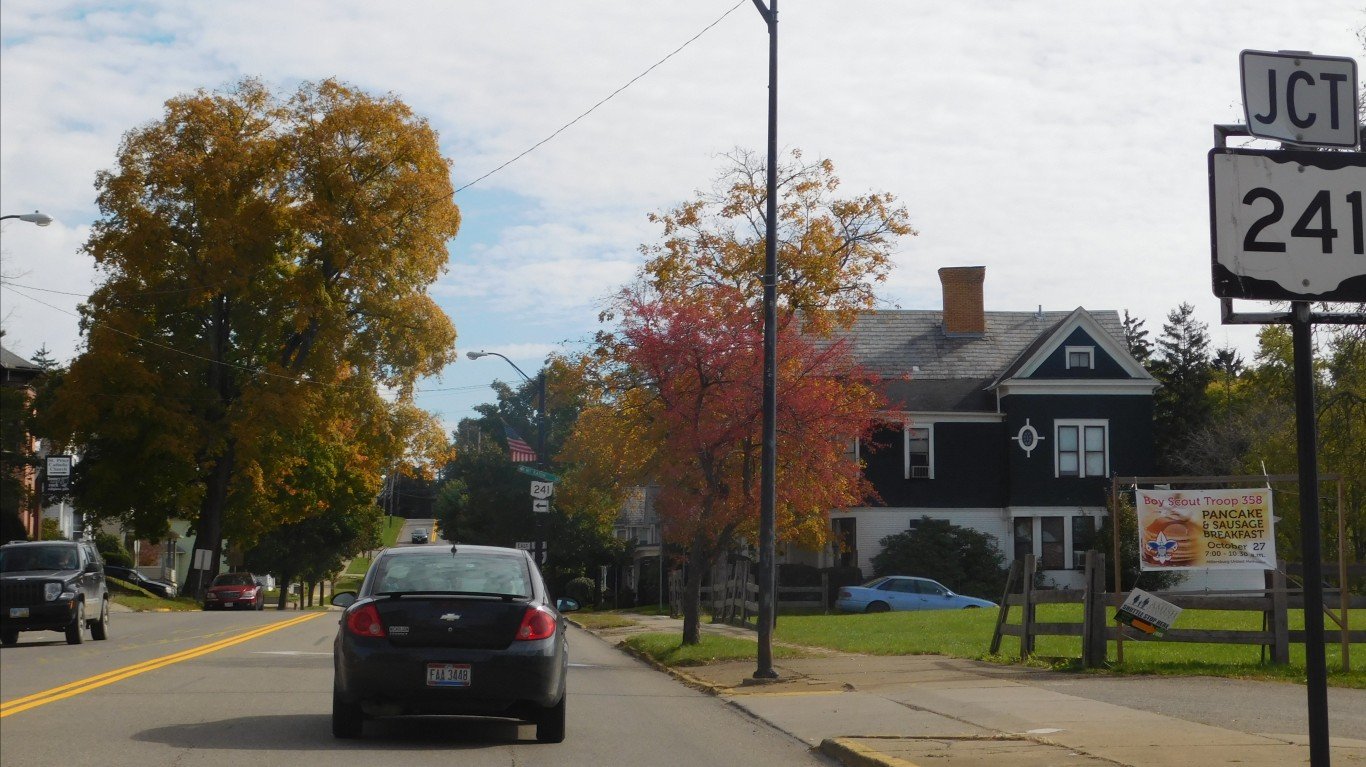
32. Beachwood, Ohio
> Population: 11,704
> 5 yr. population change: -1.5%
> Median household income: $89,706
> 5 yr. avg. unemployment: 2.7%
Beachwood, a small city about 10 miles east of downtown Cleveland, is one of three cities in Ohio to rank among the best places to live. Beachwood is located in Cuyahoga County, where 97.2% of the population have easy access to places for physical exercise like parks or recreation centers. Beachwood also has a higher than typical concentration of places like bars, restaurants, museums, and movie theaters for residents to enjoy.
Like other Ohio cities on this list, and many other Midwestern cities, Beachwood has a low cost of living. Goods and services are about 8% less expensive in Beachwood than they are nationwide on average.
[in-text-ad-2]

31. Wyomissing, Pennsylvania
> Population: 10,452
> 5 yr. population change: -0.2%
> Median household income: $82,600
> 5 yr. avg. unemployment: 3.7%
Wyomissing is a small borough in eastern Pennsylvania, just across the Schuylkill River from Reading. Like the other Pennsylvania cities on this list, Wyomissing is relatively affordable. Goods and services are about 7% less expensive in the area than they are on average nationwide. Incomes are also relatively high in Wyomissing. The typical Wyomissing household earns $82,600 a year, about $22,000 more than the typical U.S. household.
High incomes are likely due in part to a tight labor market. An average of just 3.7% of the Wyomissing’s labor force were unemployed in the last five years, compared to the 5.9% national jobless rate.
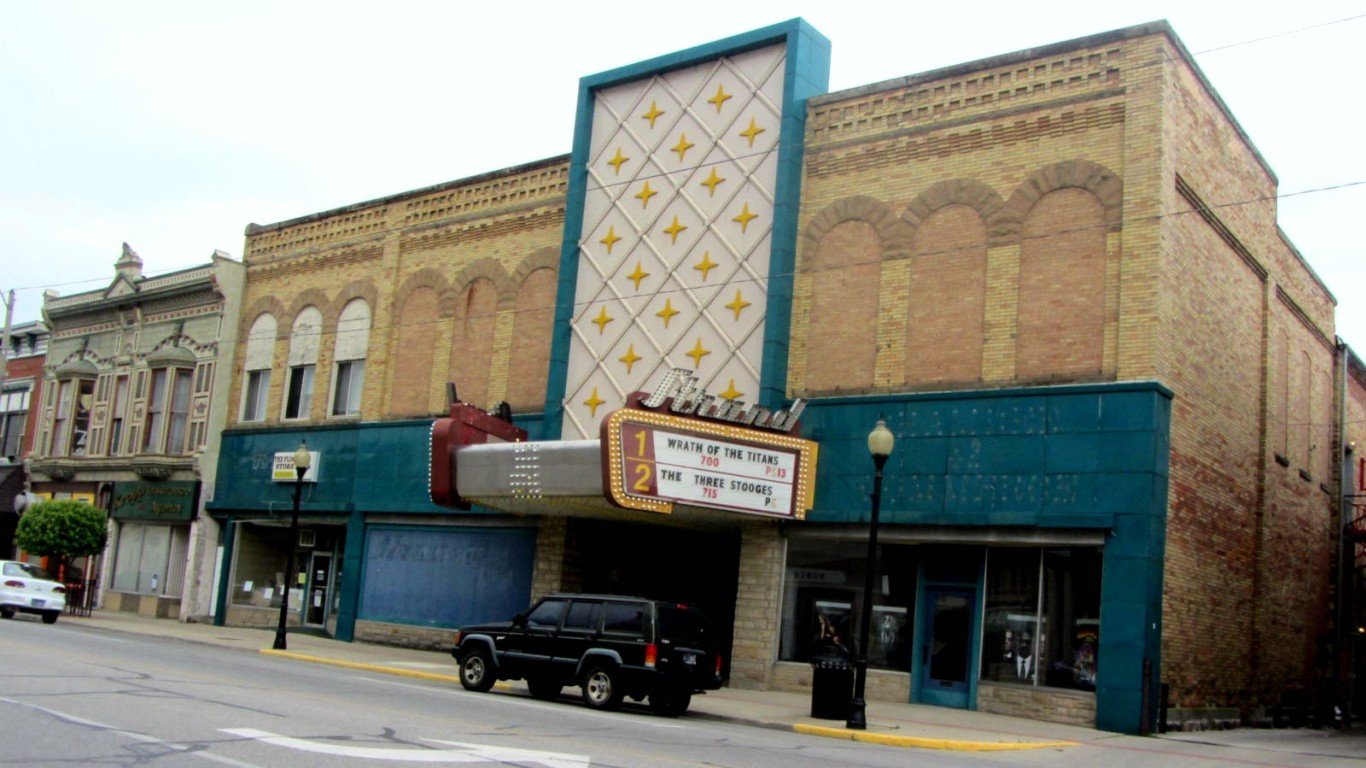
30. Dover, Ohio
> Population: 12,811
> 5 yr. population change: -0.1%
> Median household income: $52,875
> 5 yr. avg. unemployment: 4.4%
Dover, Ohio is one of the most affordable cities in the country. The typical area home is worth $125,500, well below the national median home value of $204,900 and just 2.4 times more than the $53,875 median household income in the city. By contrast, the median home value across the country is 3.4 times higher than the national median household income. On average, goods and services are about 16% less expensive in Dover than they are nationwide.
Dover is also a relatively safe place. The city’s violent crime rate of 86.3 incidents per 100,000 people and property crime rate of 760.7 incidents per 100,000 are each well below the respective national rates of 380.6 per 100,000 and 2,199.5 per 100,000.
[in-text-ad]

29. Rochester, Minnesota
> Population: 113,913
> 5 yr. population change: +5.3%
> Median household income: $70,749
> 5 yr. avg. unemployment: 4.2%
Rochester is the only city in Minnesota to rank on this list, and with a population of nearly 114,000, it is also one of the most populous cities on this list. A relatively affordable place to live, the median home value in Rochester is just 2.7 times higher than the median household income, well below the comparable 3.4 national ratio. Overall, goods and services are about 5% less expensive in Rochester than they are nationwide on average.
Incomes are relatively high in Rochester. The typical household in the city earns $70,749 a year, over $10,000 more than the typical American household. Adults who have completed college often have access to a broader range of high paying jobs, and in Rochester, 45.7% of adults have a bachelor’s degree or higher, compared to just 31.5% of adults nationwide.
[recirclink id=587471]

28. Orinda, California
> Population: 19,431
> 5 yr. population change: +7.3%
> Median household income: $210,288
> 5 yr. avg. unemployment: 3.6%
Orinda is one of a number of California cities to rank among the best places to live, and like most of the others, Orinda is a high income area. The typical household in the city, which is located about 17 miles from downtown San Francisco, earns $210,288 a year, about 3.5 times as much as the typical American household. While goods and services tend to be more expensive in Orinda, these high incomes are likely enough to offset the high costs. Wealthier areas typically have highly educated populations, and in Orinda, 83.1% of adults have a bachelor’s degree or higher, compared to just 31.5% of adults nationwide.
Orinda residents benefit not only from cultural and entertainment attractions in the nearby cities of San Francisco and Oakland, but also jobs. An average of just 3.6% of Orinda’s labor force were unemployed over the last five years, well below the 5.9% national unemployment rate reported by the Census.
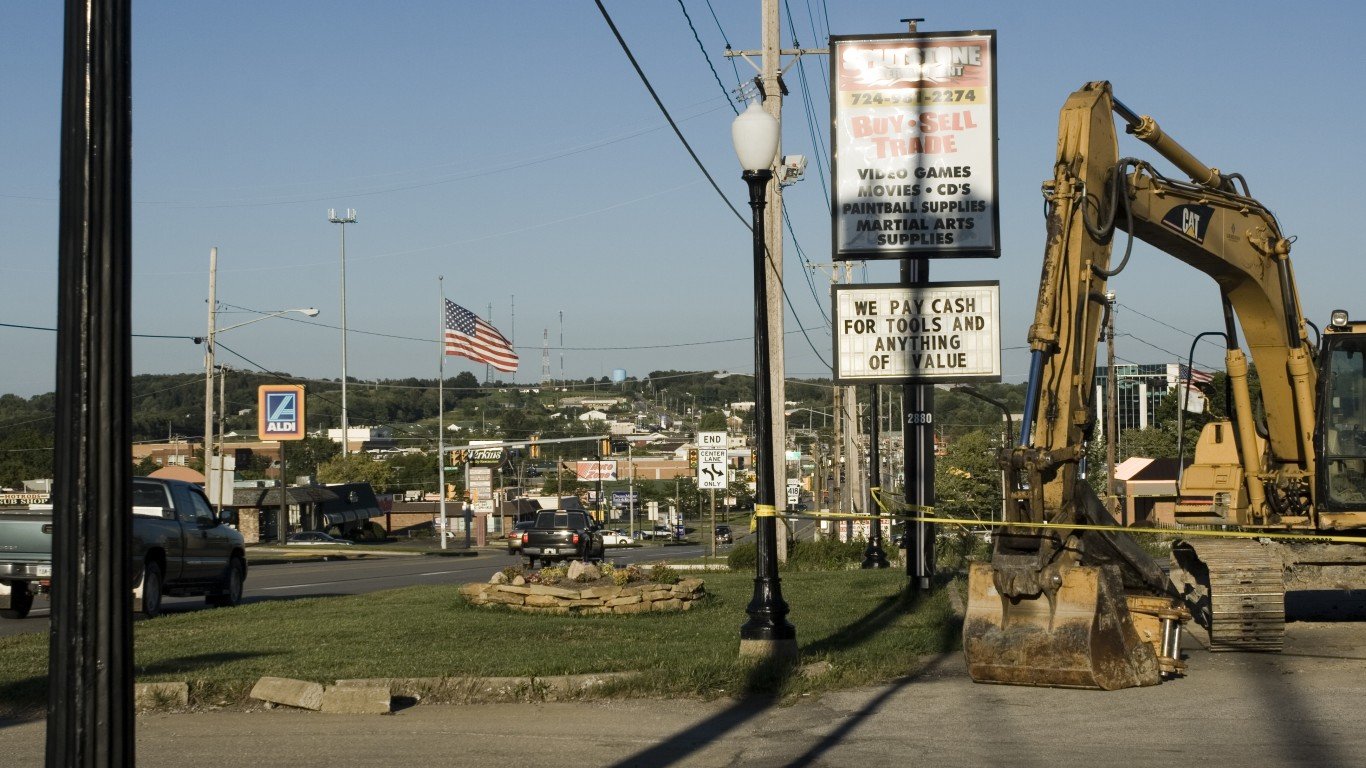
27. Hermitage, Pennsylvania
> Population: 15,812
> 5 yr. population change: -2.8%
> Median household income: $53,378
> 5 yr. avg. unemployment: 5.2%
Hermitage is a small western Pennsylvania city that sits along the Ohio state border. The city ranks on this list partially due to its high concentration of social, recreation, and cultural venues. There are more places like bars, restaurants, libraries, and golf courses on a per capita basis in Hermitage than there are nationwide. Hermitage is also a relatively safe place. There were 19 violent crimes reported in the city in 2018, or 122.3 per 100,000 people, a fraction of the 380.6 per 100,000 national rate.
Hermitage residents also benefit from a low cost of living. Goods and services in the city are 19.5% less expensive than they are nationwide on average.
[in-text-ad-2]

26. Belgrade, Montana
> Population: 8,345
> 5 yr. population change: +11.4%
> Median household income: $58,146
> 5 yr. avg. unemployment: 2.5%
Belgrade, the only city in Montana on this list, ranks among the best places to live partially due to the concentration of entertainment and cultural venues. The city boasts a far larger than typical share of places like bars, restaurants, movie theaters, museums, and golf courses on a per capita basis. The concentration of such businesses may also partially explain the city’s low unemployment rate. An average of just 2.5% of Belgrade’s labor force were out of work in the last five years, less than half the comparable 5.9% national jobless rate.
Those commuting to work in Belgrade, spend far less time every day getting to and from work than the typical American commuter. The average commute time in the city is just 18.7 minutes. Meanwhile, the average commute time nationwide is 26.6 minutes.

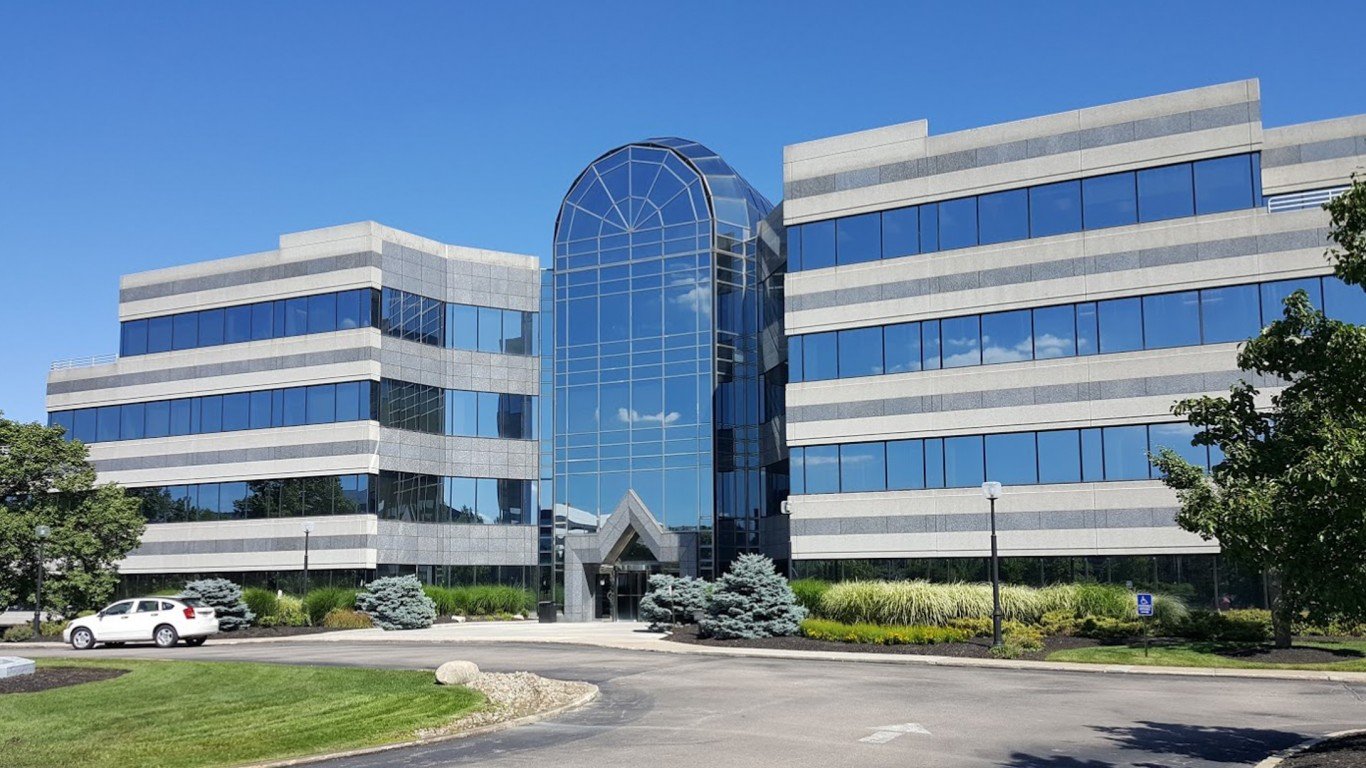
25. New Albany, Ohio
> Population: 10,896
> 5 yr. population change: +33.9%
> Median household income: $203,194
> 5 yr. avg. unemployment: 3.9%
New Albany is one of the fastest growing cities in Ohio. In the last five years, the number of people living in New Albany increased by over a third. Located less than 20 miles northeast of Columbus, New Albany residents are in commuting distance to jobs in and around the state capital — and many of those jobs are high paying. The typical New Albany household earns $203,194 a year, more than triple the median income nationwide of $60,293.
Not only are New Albany residents likely to have high incomes, but a dollar also goes further in the city than it does in much of the rest of the country. Goods and services are 13.4% less expensive in New Albany than they are nationwide.
[in-text-ad]
24. Bridgeport, West Virginia
> Population: 8,466
> 5 yr. population change: +2.5%
> Median household income: $80,666
> 5 yr. avg. unemployment: 2.6%
Bridgeport is a small city of fewer than 9,000 people located in central West Virginia. A relatively affluent area, Bridgeport’s median household income of $80,666 is about $20,000 higher than the median household income nationwide. High incomes are bolstered by a strong job market. An average of just 2.6% of the city’s labor force were unemployed in the last five years, well below the comparable 5.9% national unemployment rate.
Bridgeport residents have options when it comes to their leisure time. The city has a far higher than typical concentration of bars, restaurants, recreation centers, and golf courses.
[recirclink id=606795]

23. Grosse Pointe Park, Michigan
> Population: 11,207
> 5 yr. population change: -2.3%
> Median household income: $112,384
> 5 yr. avg. unemployment: 3.3%
Grosse Pointe Park is a small city located only about seven miles from downtown Detroit. Unlike its much larger neighbor, Grosse Pointe is a relatively affluent city with a strong job market. The typical household in Grosse Pointe Park earns $112,384 a year, nearly double the national median income. Additionally, an average of just 3.3% of the city’s labor force were unemployed in the last five years, well below the comparable 5.9% national jobless rate.
Located along Lake St. Claire, Grosse Pointe Park has two waterfront parks and across the broader county, 93.8% of residents have access to places like recreation centers and parks — a larger share than the 84.0% of Americans nationwide with similar access.

22. Cambridge, Massachusetts
> Population: 115,665
> 5 yr. population change: +9.4%
> Median household income: $95,404
> 5 yr. avg. unemployment: 4.4%
Like several other cities on this list, Cambridge, Massachusetts is in close proximity to a major urban area. Directly across the Charles River from Boston, Cambridge residents have access to jobs and cultural attractions in the Massachusetts state capital and largest city in New England. Partially as a result, an average of just 4.4% of workers Cambridge were unemployed in the last five years, below the comparable 5.9% unemployment rate nationwide.
Home to MIT and Harvard, Cambridge is a college town — and like many college towns, it boasts a high concentration of entertainment and cultural options. The city has a far higher than typical concentration of restaurants, movie theaters, gyms, and museums.
[in-text-ad-2]

21. Palo Alto, California
> Population: 67,019
> 5 yr. population change: +2.7%
> Median household income: $157,120
> 5 yr. avg. unemployment: 3.5%
Palo Alto is a city in California’s Silicon Valley — an area home to numerous high paying tech companies. Though the cost of living in the area is relatively high, the typical household in Palo Alto has an income of $157,120, well more than double the national median of $60,293. Palo Alto residents are also far less likely than the typical American to be out of a job. An average of just 3.5% of the area’s workforce were unemployed over the last five years, well below the national average of 5.9%.
Like many other cities with good job markets and high incomes, Palo Alto is relatively safe. There were just 106.6 violent crimes for every 100,000 people in the city in 2018, less than one third the national violent crime rate of 380.6 per 100,000.

20. Perryville, Missouri
> Population: 8,403
> 5 yr. population change: +1.7%
> Median household income: $42,439
> 5 yr. avg. unemployment: 2.1%
Perryville is a small city in southeastern Missouri about 80 miles south of St. Louis. Part of the reason Perryville ranks among the best cities to live in is its affordability. Goods and services in the city are about 11.6% less expensive than they are nationwide on average, and housing in particular is relatively affordable. The typical home in Perryville is worth 2.9 times as much as the city’s median household income. Meanwhile, the median home value across the country is 3.4 times higher than the median household income.
Perryville residents are also less likely than most Americans to find themselves out of a job. The city’s five year average unemployment rate of 2.1% is less than half the comparable national figure of 5.9%.
[in-text-ad]

19. Ladue, Missouri
> Population: 8,586
> 5 yr. population change: +0.8%
> Median household income: $192,500
> 5 yr. avg. unemployment: 1.6%
Ladue, a suburb of St. Louis, is one of the wealthiest cities on this list. The typical household in Ladue earns $192,500 a year, more than triple the national median income of $60,293. Ladue residents have easy access not only to entertainment and cultural attractions in nearby St. Louis, and also jobs in the city. An average of just 1.6% of area residents were out of work over the last five years, well below the national average of 5.9%.
High property values can be indicative of an area’s desirability. In Ladue, the typical home is worth $835,300, more than four times the national median home value of $204,900.
[recirclink id=594227]
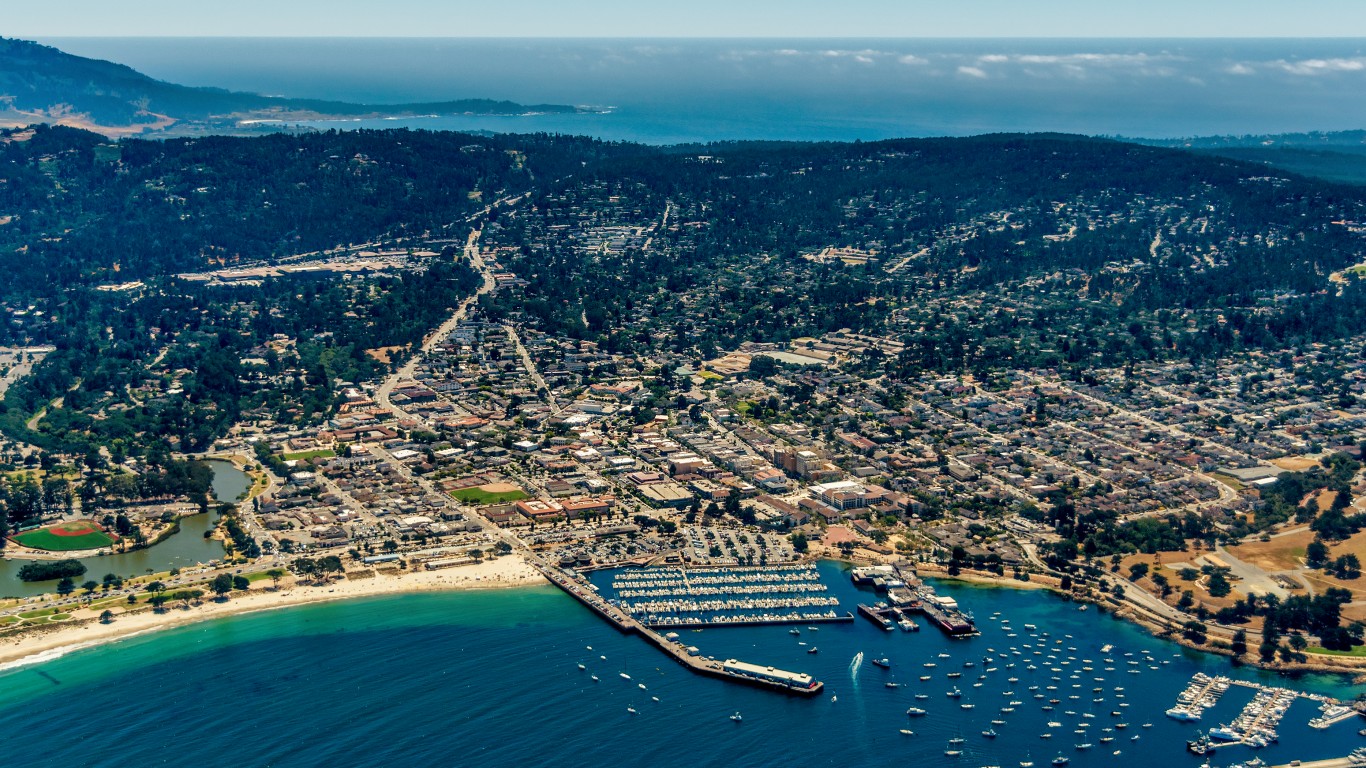
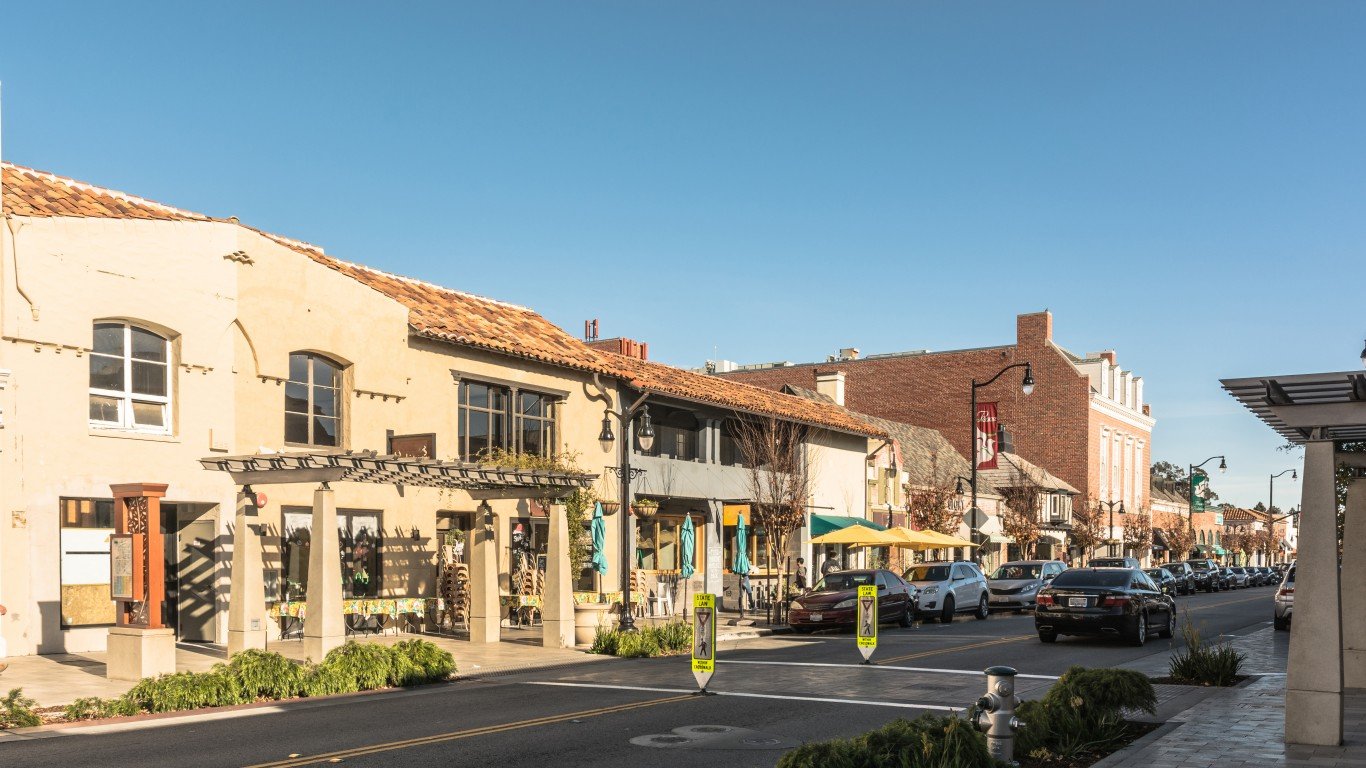
18. Monterey, California
> Population: 28,512
> 5 yr. population change: +2.1%
> Median household income: $77,562
> 5 yr. avg. unemployment: 3.7%
Monterey is a coastal city in central California, located about 2 hours south of San Francisco. A popular tourist destination, Monterey has a high concentration of entertainment and recreation venues like restaurants, golf courses, museums, and movie theaters — as well as the Monterey Bay Aquarium, Cannery Row, and Old Fisherman’s Wharf.
People who live and work in Monterey have options and when it comes to commuting, and are less likely than the typical American to have to rely on a car. About one in every four commuters in Monterey get to work by means other than a car, like walking or public transit, compared to fewer than 10% of commuters nationwide who use non-car options. The average commute time in Monterey is also about 10 minutes shorter than the national average.
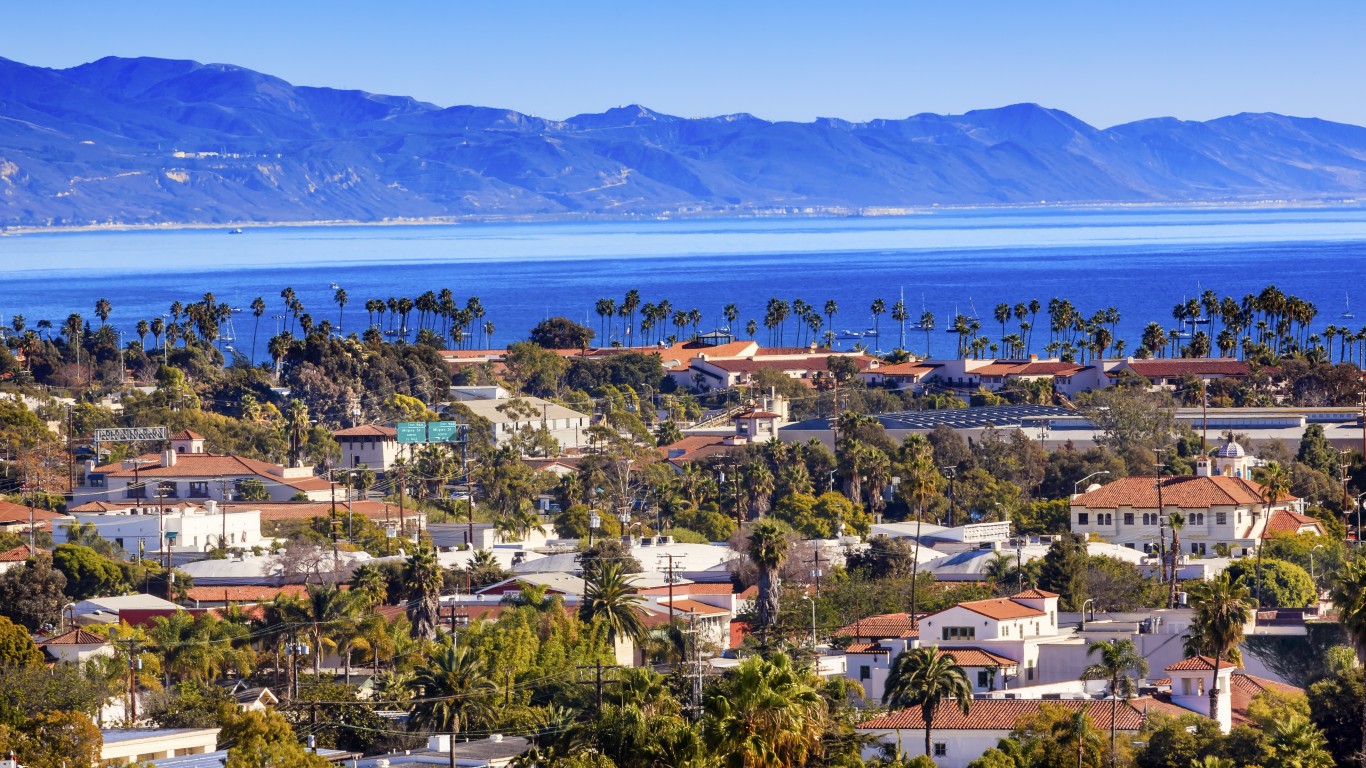
17. Santa Barbara, California
> Population: 91,325
> 5 yr. population change: +2.5%
> Median household income: $74,798
> 5 yr. avg. unemployment: 4.1%
Santa Barbara is a mid-sized coastal city in Southern California, situated about 100 miles West of Los Angeles. Like other California cities along the Pacific Coast to rank on this list, Santa Barbara is a popular tourist destination. Partially as a result, Santa Barbara boasts a high concentration of entertainment, recreation, and cultural venues like restaurants, bars, hotels, and museums.
Though Santa Barbara has a slightly higher than average cost of living, incomes are also higher than average in the area. The typical Santa Barbara household earns $74,798 a year, nearly $15,000 more than the median income nationwide.
[in-text-ad-2]
16. Bellaire, Texas
> Population: 18,733
> 5 yr. population change: +8.8%
> Median household income: $201,629
> 5 yr. avg. unemployment: 2.4%
Bellaire is a small Texas suburb, located about 10 miles from downtown Houston. Within commuting distance of one of the largest cities in the country, Bellaire residents have access to the attractions and jobs in the nation’s fourth most populous city. An average of just 2.4% of Bellaire’s labor force were unemployed in the last five years, less than half the comparable 5.9% national unemployment rate. Bellaire is also an affluent city, with the majority of households earning over $200,000 a year.
Like many of the best cities to live in, Bellaire is growing relatively rapidly. Over the last five years, the city’s population grew by 8.8%, more than double the 3.6% U.S. population growth over the same period.

15. Key Biscayne, Florida
> Population: 13,054
> 5 yr. population change: +3.9%
> Median household income: $133,958
> 5 yr. avg. unemployment: 4.4%
Key Biscayne, a small town on a barrier island just south of Miami ranks as the best place to live in Florida and 15th best nationwide. One of the safest communities in the country, Key Biscayne’s violent crime rate of 37.6 incidents for every 100,000 people is only about a tenth of the national violent crime rate of 380.6 per 100,000.
While the area has a high cost of living, with especially high housing costs, incomes are also high in the area. The typical Key Biscayne household earns $133,958 per year, more than double the national median household income of $60,293.
[in-text-ad]

14. Whitefish Bay, Wisconsin
> Population: 14,039
> 5 yr. population change: -0.5%
> Median household income: $117,300
> 5 yr. avg. unemployment: 2.1%
Whitefish Bay, a Milwaukee suburb along the shore of Lake Michigan, is one of two Wisconsin cities to rank among the 50 best places to live. The high quality of life in Whitefish Bay is partially the result of a strong job market. The area’s average unemployment rate over the last five years stands at just 2.1% — less than half the comparable nationwide rate of 5.9%.
According to the village website, area residents choose to live in the town because of the local school quality, well maintained public property, and safety. Indeed, Whitefish Bay is one of the safest places in the country. There were 71.8 violent crimes reported in the village for every 100,000 people in 2018, a fraction of the national violent crime rate of 380.6 per 100,000.
[recirclink id=593862]

13. Hoboken, New Jersey
> Population: 53,211
> 5 yr. population change: +4.5%
> Median household income: $136,402
> 5 yr. avg. unemployment: 3.4%
Hoboken, situated directly across the Hudson River from Manhattan, is the only city in New Jersey to rank on this list. Within commuting distance of New York City — one of the largest and most diverse job markets in the country, unemployment in Hoboken is relatively low. An average of just 3.4% of workers in the city were unemployed over the last five years, well below the 5.9% comparable national rate.
While the cost of living in Hoboken is relatively high, incomes are also far higher than average. The typical household in the city earns $136,402 a year, more than double the national median income of $60,293.

12. Lake Oswego, Oregon
> Population: 38,705
> 5 yr. population change: +4.5%
> Median household income: $100,461
> 5 yr. avg. unemployment: 3.2%
Lake Oswego is the only city in Oregon to rank on this list. Goods and services in Lake Oswego are about 7.4% more expensive than average. Still, the high cost of living is offset by higher incomes as the majority of households in the city earn over $100,000 a year, well above the national median household income of $60,293. Additionally, just 4.5% of Lake Oswego residents live below the poverty line, less than a third the national 14.1% national poverty rate.
Lake Oswego is also a relatively safe city, with a violent crime rate of 50.6 incidents per 100,000 people, a fraction of the 380.6 per 100,000 national rate.
[in-text-ad-2]
11. Burlingame, California
> Population: 30,459
> 5 yr. population change: +4.2%
> Median household income: $122,999
> 5 yr. avg. unemployment: 4.8%
Located less than 20 miles from downtown San Francisco, Burlingame is one of several cities in the Bay Area to rank on this list. A relatively wealthy area, Burlingame’s median household income of $122,999 is more than double the national median of $60,293. The city’s high incomes correspond with a healthy job market, as an average of just 4.8% of area workers were unemployed in the last five years, well below the 5.9% national unemployment rate.
Area residents have plenty of options for outdoor recreation, as the city boasts 18 separate parks, playgrounds, and sports fields. The city also has a higher than average per capita concentration of restaurants, hotels, gyms, and sports clubs.
10. Greenwood Village, Colorado
> Population: 15,677
> 5 yr. population change: +10.2%
> Median household income: $127,134
> 5 yr. avg. unemployment: 3.4%
Greenwood Village is a small Denver suburb about 10 miles south of the city. Like many other municipalities in commuting distance of a major urban area, Greenwood Village residents benefit from easy access to the amenities of the the nearby city, as well as the employment opportunities there. Likely partially as a result, just 3.4% of workers in Greenwood were unemployed in the last five years, on average, a far lower share than the comparable 5.9% national unemployment rate over that period.
Greenwood Village residents give the city high marks in several measures of quality of life. According to a residential survey conducted in fall 2018, the city’s parks, aesthetics, and safety are the primary reasons most residents are very satisfied living in Greenwood Village.
[in-text-ad]

9. Mercer Island, Washington
> Population: 25,492
> 5 yr. population change: +9.4%
> Median household income: $142,413
> 5 yr. avg. unemployment: 3.6%
The only city in Washington state to rank on this list, Mercer Island is a municipality on an island in Lake Washington, in between the cities of Seattle and Bellevue. Though the cost of living on the island, particularly housing, is higher than average, area residents also have relatively high incomes. The typical Mercer Island household earns $142,413 a year, more than double the national median household income of $60,293.
The island also boasts a range of cultural and entertainment options, with a far greater than average per capita concentration of places like restaurants, gyms, movie theaters, and museums.
[recirclink id=592084]
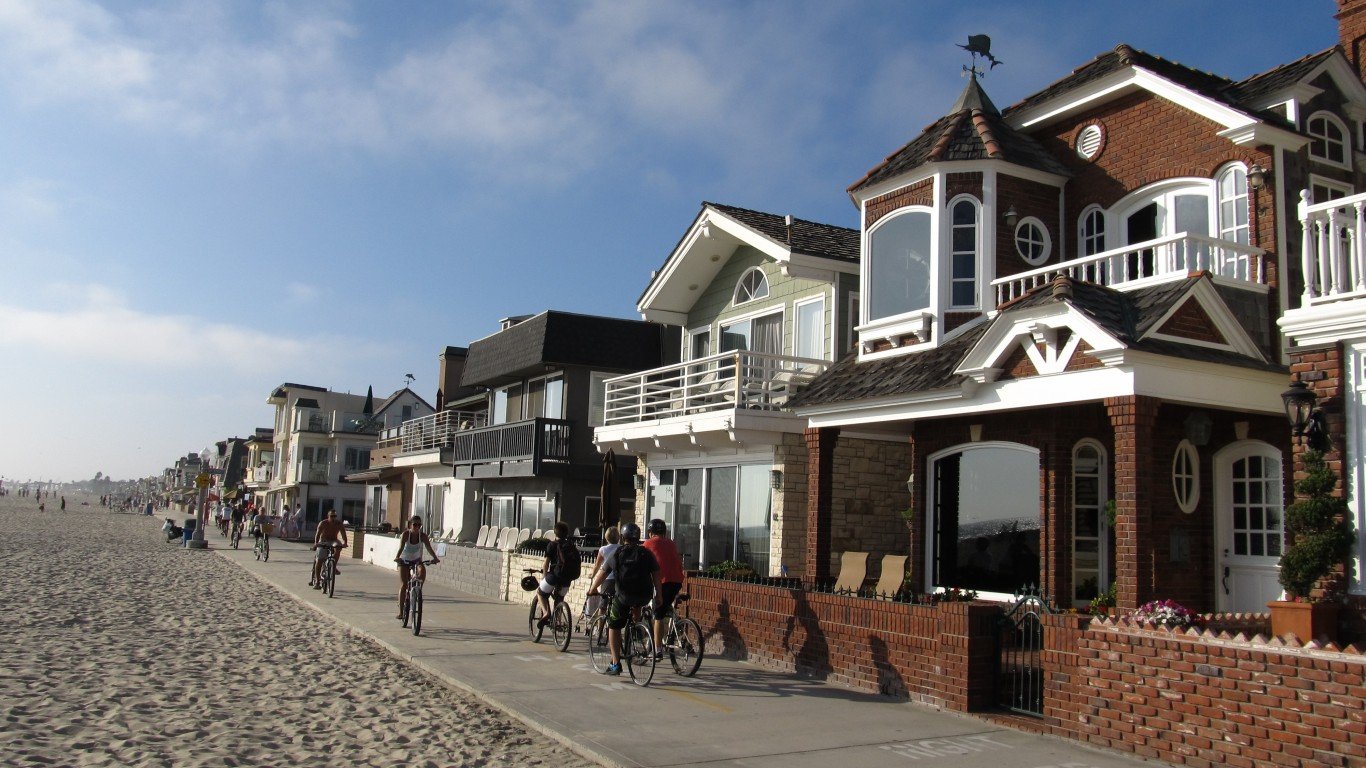
8. Newport Beach, California
> Population: 86,280
> 5 yr. population change: +0.3%
> Median household income: $122,709
> 5 yr. avg. unemployment: 3.4%
Newport Beach is a coastal city located about 35 miles southeast of Los Angeles. Like other coastal California cities on this list, Newport Beach is relatively affluent. The typical household in the city earns $122,709 a year, more than double the national median of $60,293. Newport Beach residents are also relatively healthy in that they are far more likely to exercise regularly and less likely to be obese than the typical American. This is likely due in part to residents’ access to exercise opportunities, as 99.1% of residents across Orange County — where Newport Beach is located — have easy access to places for physical activity, like parks, recreation centers, and gyms.

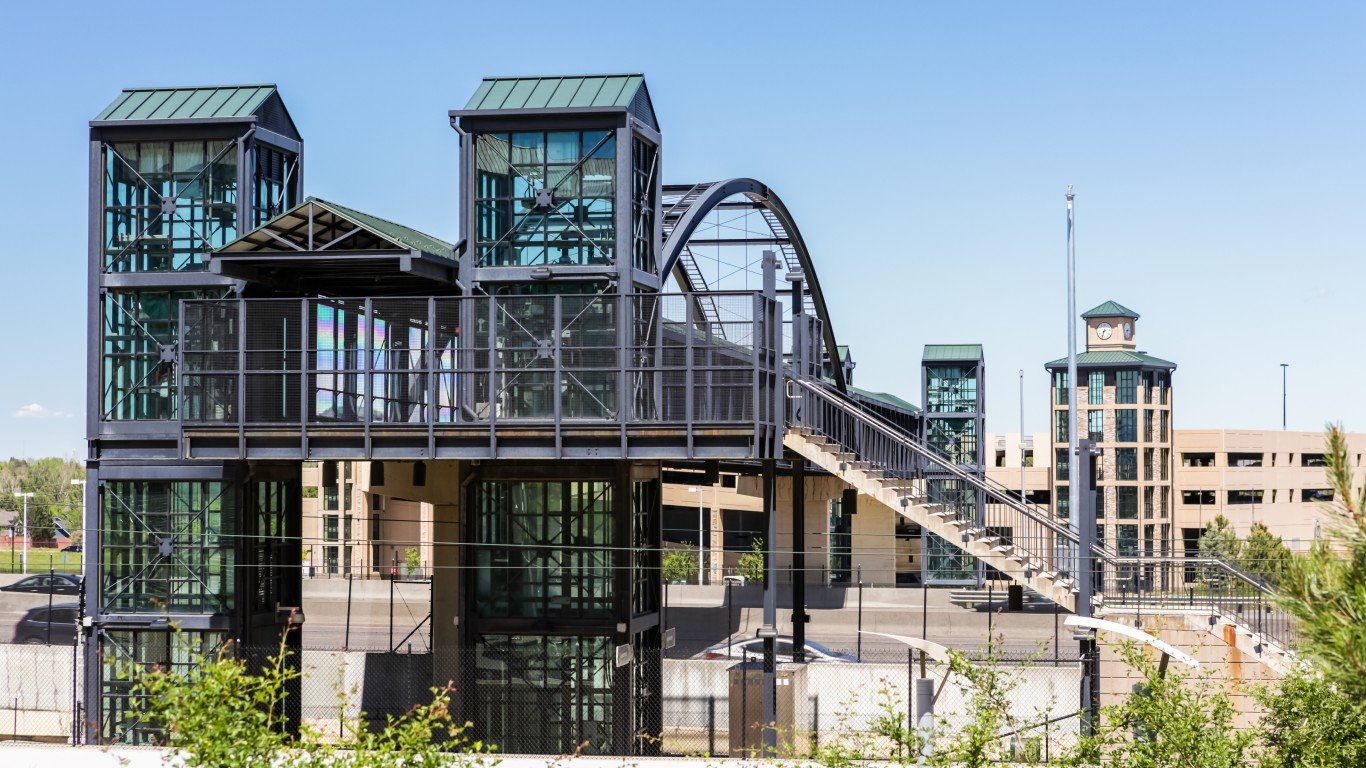
7. Solana Beach, California
> Population: 13,370
> 5 yr. population change: +2.7%
> Median household income: $105,821
> 5 yr. avg. unemployment: 3.5%
Solana Beach is a coastal city in southern California. A wealthy area, the majority of households in the city earn over $100,000 a year. Located less than 30 minutes from downtown San Diego, area residents have access to jobs and entertainment located in the major urban area. The city is also home to one of only three train stations in San Diego County, providing commuters more options. For recreation, the city boasts 1.7 miles of beach, and a higher than average per capita concentration of restaurants, gyms, museums, and movie theaters.
Solana Beach is also a relatively safe city. There were 23 violent crimes reported in the city in 2018, or 170.1 for every 100,000 people, less than half the national violent crime rate of 380.6 per 100,000.
[in-text-ad-2]

6. Paradise Valley, Arizona
> Population: 14,215
> 5 yr. population change: +8.8%
> Median household income: $204,145
> 5 yr. avg. unemployment: 1.4%
Paradise Valley is a small city located about 15 miles northeast of Phoenix. Area residents benefit from a healthy job market. An average of just 1.4% of the labor force were unemployed over the last five years, compared to the 5.9% national figure. Paradise Valley is also wealthy, with most households earning over $200,000 a year.
Like a number of other cities and towns on this list, Paradise Valley appears to be attracting new residents — the city’s population grew by 8.8% in the last five years, more than double the 3.6% national population growth rate.

5. Piedmont, California
> Population: 11,308
> 5 yr. population change: +4.2%
> Median household income: $210,889
> 5 yr. avg. unemployment: 3.0%
Located less than 15 miles from San Francisco, Piedmont is one of several Bay Area cities to rank among the best places to live. Piedmont is a relatively safe city — there were 21 violent crimes reported in the city limits in 2018, resulting in a violent crime rate of 183.0 per 100,000 people, well below the 380.6 per 100,000 national rate.
Cities with low crime often tend to be more affluent places where poverty is relatively uncommon — and Piedmont is no exception. The typical household in Piedmont has an income of $210,889 a year, more than triple the national median household income of $60,293. Just 2.7% of the city’s population live below the poverty line compared to the 14.1% national poverty rate.
[in-text-ad]
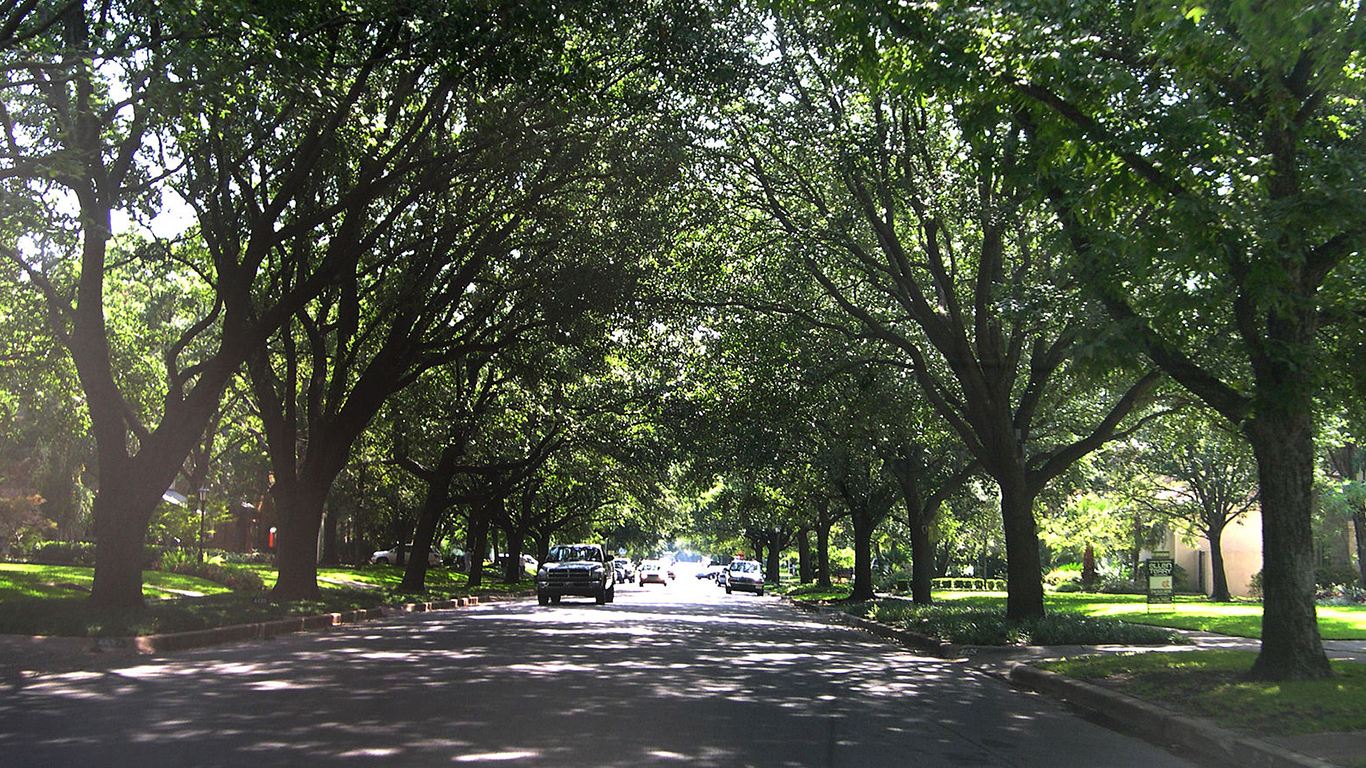
4. Highland Park, Texas
> Population: 9,145
> 5 yr. population change: +5.0%
> Median household income: $207,019
> 5 yr. avg. unemployment: 2.3%
Highland Park, Texas, is one of the wealthiest communities in the United States. The typical household has an income of $207,019 a year, well more than triple the national median household income of $60,293 a year. Just north of downtown Dallas, Highland Park residents have access to employment opportunities in a major city, and just 2.3% of area workers were out of a job in the last five years, on average, well below the 5.9% national rate.
Town residents benefit not only to access to cultural and entertainment options in nearby Dallas. There are also 22 parks in the town, including eight tennis courts, three playgrounds, and a swimming pool.
[recirclink id=526773]

3. Hanover, New Hampshire
> Population: 8,591
> 5 yr. population change: +0.5%
> Median household income: $103,558
> 5 yr. avg. unemployment: 3.4%
Hanover, New Hampshire is one of only a few cities in the Northeastern United States to rank on this list, in large part because the cost of living in much of the Northeast is relatively high. While goods and services are more expensive in Hanover than they are nationwide, the high cost of living in the city is largely offset by higher incomes. The majority of households in the city earn over $100,000. The city also has a strong job market, as an average of just 3.4% of workers in the city were unemployed over the last five years, well below the comparable national figure of 5.9%.
Hanover residents also benefit from a range of entertainment, cultural, and recreation options. There is a higher than typical per capita concentration of places like restaurants, gyms, golf courses, nature parks, museums, libraries, and movie theaters in Hanover.

2. Winnetka, Illinois
> Population: 12,481
> 5 yr. population change: +1.7%
> Median household income: $220,577
> 5 yr. avg. unemployment: 2.4%
Winnetka is a small village along the shore of Lake Michigan about 20 miles north of downtown Chicago. Winnetka residents have easy access to the largest city in the Midwest with a commuter line that goes directly downtown. Partially as a result, over a quarter of commuters in the area use public transit to get to work and do not have to rely on a car. As is often the case in municipalities on this list located outside major urban areas, unemployment is low in Winnetka. The village’s five year average jobless rate of 2.4% is less than half the comparable national figure of 5.9%.
The village also boasts a high per capita concentration of restaurants, bars, and theater companies as well as a total of 27 parks that span nearly 250 acres.
[in-text-ad-2]

1. Manhattan Beach, California
> Population: 35,573
> 5 yr. population change: +0.7%
> Median household income: $150,083
> 5 yr. avg. unemployment: 5.3%
Manhattan Beach is one of several California cities to rank on this list. Located on the Pacific Coast about 20 miles from downtown Los Angeles, Manhattan Beach residents have access to a major urban area and miles of ocean coast. Due in part to its high desirability as a place to live, real estate in Manhattan Beach is expensive, as is the overall cost of living. People living there tend to be relatively affluent, with over half of all area households reporting incomes over $150,000 a year.
As is often the case in wealthy areas, serious crimes are relatively uncommon in Manhattan Beach. The city’s violent crime rate of 158.2 incidents per 100,000 people is less than half the national rate of 380.6 per 100,000.
Methodology:
To identify the best cities to live in, 24/7 Wall St. created a weighted index of 25 measures across four categories: affordability, economy, quality of life, and community.
1.) The affordability category consists of three measures:
- The ratio of median home value to median household income at full weight.
- Median property taxes paid as a percentage of median home value at one-fourth weight.
- Regional price parity, a measure of cost of living, was included at full weight.
2.) The economy category consists of four measures:
- Median home value was included at full weight.
- Employment growth from 2014 to 2018 was included at one-half weight.
- The ratio of the number of employed workers to the total population was included at one-half weight.
- The unemployment rate was included at full weight.
3.) The quality of life category consists of six measures:
- The poverty rate was included at full weight.
- The share of the population in urban census tracts at least 1 mile from a grocery store and in rural census tracts at least 10 miles from a grocery store, a measure of poor food access, was included at full weight.
- The distance from the city center to the nearest hospital was included at full weight.
- The percentage of patients discharged from acute care hospitals who are readmitted to the hospital within 30 days was included at full weight.
- The percentage of heart attack, coronary artery bypass grafting (CABG) surgery, chronic obstructive pulmonary disease (COPD), heart failure, pneumonia, and stroke patients who pass away within 30 days of treatment was included at full weight.
- The number of drug-related fatalities per 100,000 residents was included at one-fourth weight.
4.) The community category consists of 12 measures:
- The percentage of workers 16 and over commuting by public transit, walking, or other non-car means was included at one-half weight.
- The average travel time to work was included at full weight.
- The number of hospital admissions for conditions that could be treated in an outpatient setting per 1,000 Medicare enrollees — an indication of poor outpatient care and overuse of hospitals — was included at one-half weight.
- The number of violent crimes — homicide, rape, robbery, and aggravated assault — reported per 100,000 residents was included at full weight.
- The number of property crimes — burglary, larceny, motor vehicle theft, and arson — reported per 100,000 residents was included at full weight.
- The number of movie theaters per 100,000 residents was included at one-fourth weight.
- The number of libraries and archives per 100,000 residents was included at one-fourth weight.
- The number of theater companies and dinner theaters per 100,000 residents was included at one-fourth weight.
- The number of museums per 100,000 residents was included at one-fourth weight.
- The number of nature parks and similar institutions per 100,000 residents was included at one-fourth weight.
- The number of alcoholic drinking places per 100,000 residents was included at one-fourth weight.
- The number of restaurants and other eating places per 100,000 residents was included at one-fourth weight.
Data on population, employment, unemployment, median home value, median household income, median property taxes paid, commuter characteristics, average travel time to work, and poverty came from the U.S. Census Bureau’s American Community Survey and are five-year estimates for the period 2014 to 2018. Employment data used to calculate five-year employment growth are five-year estimates for the years 2010 to 2014. Data on cost of living came from real estate analysis company ATTOM Data Solutions and is for the year 2014.
Data on the share of the population in urban census tracts or areas at least one mile from a grocery store and in rural census tracts at least 10 miles from a grocery store, a measure of poor food access, came from the U.S. Department of Agriculture’s 2017 update to the Food Access Research Atlas and is at the county level.
Data on hospital locations came from the Centers for Medicare & Medicaid Services. Data on 30-day readmission rates and 30-day mortality rates also came from the CMS and are for the period July 2015 to June 2018. Data was aggregated to the city level for cities with at least one hospital, and was aggregated to the county level for cities with no hospitals. Data on the number of drug related deaths per 100,000 residents per year from the period 2015 to 2017 is from the Centers for Disease Control and Prevention and is at the county level. Data on preventable hospitalizations per 1,000 Medicare enrollees came from the 2019 County Health Rankings and Roadmaps program, a collaboration between the Robert Wood Johnson Foundation and University of Wisconsin Population Health Institute, and is at the county level.
Data on the number of violent crimes and property crimes reported per 100,000 residents came from the FBI’s Uniform Crime Reporting Program and are for the year 2018.
Data on the number of movie theaters, libraries and archives, theater companies and dinner theaters, museums, nature parks and other similar institutions, alcoholic beverage drinking places, and restaurants and other eating places came from the Census Bureau’s 2017 County Business Patterns series and is at the county level.
To avoid geographic clustering, we only took the top-ranking city in a given county. Our list includes cities, towns, villages, boroughs, and Census designated places. We did not include places with fewer than 8,000 residents in our analysis. Additionally, any city or town with a poverty rate or unemployment above the national average was not considered.
Contact [email protected] for any questions or corrections.