
Nearly the entire country has been under some kind of lockdown in an effort to slow the spread of the novel coronavirus. One of the more noticeable results of the statewide stay-at-home orders issued in the vast majority of states has been a dramatic decline in road traffic. On a national level, traffic volume has decreased for four straight weeks.
On the national level, the number of vehicle miles traveled — the total number of miles traveled by all vehicles in a geographic region over a given period of time — is now at 52% of what it was at the beginning of this year. In some of the nation’s largest cities, this figure has declined even more substantially.
24/7 Wall St. reviewed the change in vehicle miles traveled (VMT) amid the COVID-19 pandemic in the 25 most populous U.S. cities using data from transportation research company INRIX.
Measures such as working from home and the banning of large gatherings have caused daily travel to plummet in the country’s biggest cities. The average vehicle miles traveled in the majority of the 25 largest cities — including New York, Los Angeles, and Dallas — is less than half of what it normally is. Even those large cities with travel volume nearest that experienced at the beginning of this year are currently experiencing VMT that is at least 54% of normal rates.
One positive result for those who are still using the roads is that congestion is now virtually nonexistent across the U.S., with traffic moving at free-flow speeds nationwide. Numerous cities found on our list normally rank among the cities with the absolute worst traffic in the world.
Click here to see the impact of COVID-19 on traffic in America’s largest cities.
24/7 Wall St. reviewed the decrease in vehicle miles traveled (VMT) for the 25 most populous metropolitan areas in the U.S. for the week ending April 13, 2020, and compared it to the average for the first two months of 2020 as provided by transportation data company INRIX. VMT measures the total number of miles traveled by all vehicles in a geographic region over a given period of time.
24/7 Wall St. also reviewed the total number of confirmed COVID-19 cases for each metropolitan area. This data came from the Centers for Disease Control and Prevention as well as from state and local health departments and were up-to-date as of noon on April 17. Total population data for each metropolitan area from the Census Bureau’s American Community Survey.
To determine the date at which each state’s stay-at-home order took effect, 24/7 Wall St. reviewed executive orders from each state’s governor since the first COVID-19 case was confirmed in the United States at the end of January.

25. Charlotte
> Vehicle miles traveled the week ending April 13: 54% of normal
> Metropolitan area population: 2.57 million
> Confirmed COVID-19 cases as of Apr. 17, 2020: 83.02 per 100,000 (total: 2,133)
> Statewide stay-at-home effective date: March 30, 2020
[in-text-ad]

24. Phoenix
> Vehicle miles traveled the week ending April 13: 54% of normal
> Metropolitan area population: 4.86 million
> Confirmed COVID-19 cases as of Apr. 17, 2020: 50.66 per 100,000 (total: 2,461)
> Statewide stay-at-home effective date: March 31, 2020
[recirclink id=682816]

23. Portland
> Vehicle miles traveled the week ending April 13: 54% of normal
> Metropolitan area population: 0.54 million
> Confirmed COVID-19 cases as of Apr. 17, 2020: 101.79 per 100,000 (total: 545)
> Statewide stay-at-home effective date: March 23, 2020

22. St. Louis
> Vehicle miles traveled the week ending April 13: 53% of normal
> Metropolitan area population: 2.80 million
> Confirmed COVID-19 cases as of Apr. 17, 2020: 116.05 per 100,000 (total: 3,255)
> Statewide stay-at-home effective date: April 6, 2020
[in-text-ad-2]

21. Minneapolis
> Vehicle miles traveled the week ending April 13: 52% of normal
> Metropolitan area population: 3.63 million
> Confirmed COVID-19 cases as of Apr. 17, 2020: 38.41 per 100,000 (total: 1,394)
> Statewide stay-at-home effective date: March 27, 2020

20. Seattle
> Vehicle miles traveled the week ending April 13: 52% of normal
> Metropolitan area population: 3.94 million
> Confirmed COVID-19 cases as of Apr. 17, 2020: 198.81 per 100,000 (total: 7,832)
> Statewide stay-at-home effective date: March 23, 2020
[in-text-ad]

19. Denver
> Vehicle miles traveled the week ending April 13: 51% of normal
> Metropolitan area population: 2.93 million
> Confirmed COVID-19 cases as of Apr. 17, 2020: 171.02 per 100,000 (total: 5,015)
> Statewide stay-at-home effective date: March 26, 2020
[recirclink id=536069]

18. Houston
> Vehicle miles traveled the week ending April 13: 50% of normal
> Metropolitan area population: 7.00 million
> Confirmed COVID-19 cases as of Apr. 17, 2020: 83.17 per 100,000 (total: 5,820)
> Statewide stay-at-home effective date: April 2, 2020
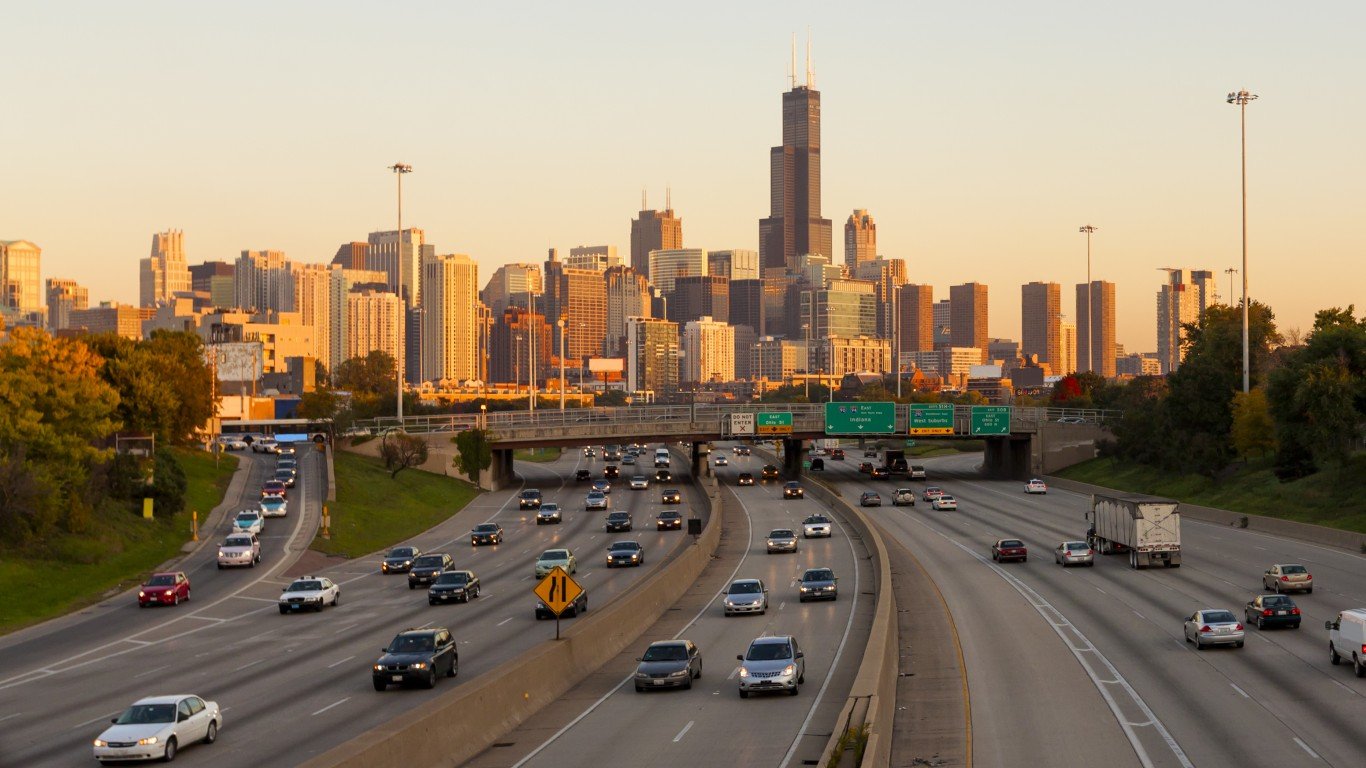
17. Chicago
> Vehicle miles traveled the week ending April 13: 50% of normal
> Metropolitan area population: 9.50 million
> Confirmed COVID-19 cases as of Apr. 17, 2020: 163.19 per 100,000 (total: 15,499)
> Statewide stay-at-home effective date: March 21, 2020
[in-text-ad-2]

16. Atlanta
> Vehicle miles traveled the week ending April 13: 49% of normal
> Metropolitan area population: 5.95 million
> Confirmed COVID-19 cases as of Apr. 17, 2020: 144.95 per 100,000 (total: 8,626)
> Statewide stay-at-home effective date: April 3, 2020

15. Dallas
> Vehicle miles traveled the week ending April 13: 49% of normal
> Metropolitan area population: 7.54 million
> Confirmed COVID-19 cases as of Apr. 17, 2020: 56.52 per 100,000 (total: 4,262)
> Statewide stay-at-home effective date: April 2, 2020
[in-text-ad]

14. San Antonio
> Vehicle miles traveled the week ending April 13: 48% of normal
> Metropolitan area population: 2.52 million
> Confirmed COVID-19 cases as of Apr. 17, 2020: 41.30 per 100,000 (total: 1,040)
> Statewide stay-at-home effective date: April 2, 2020
[recirclink id=682749]
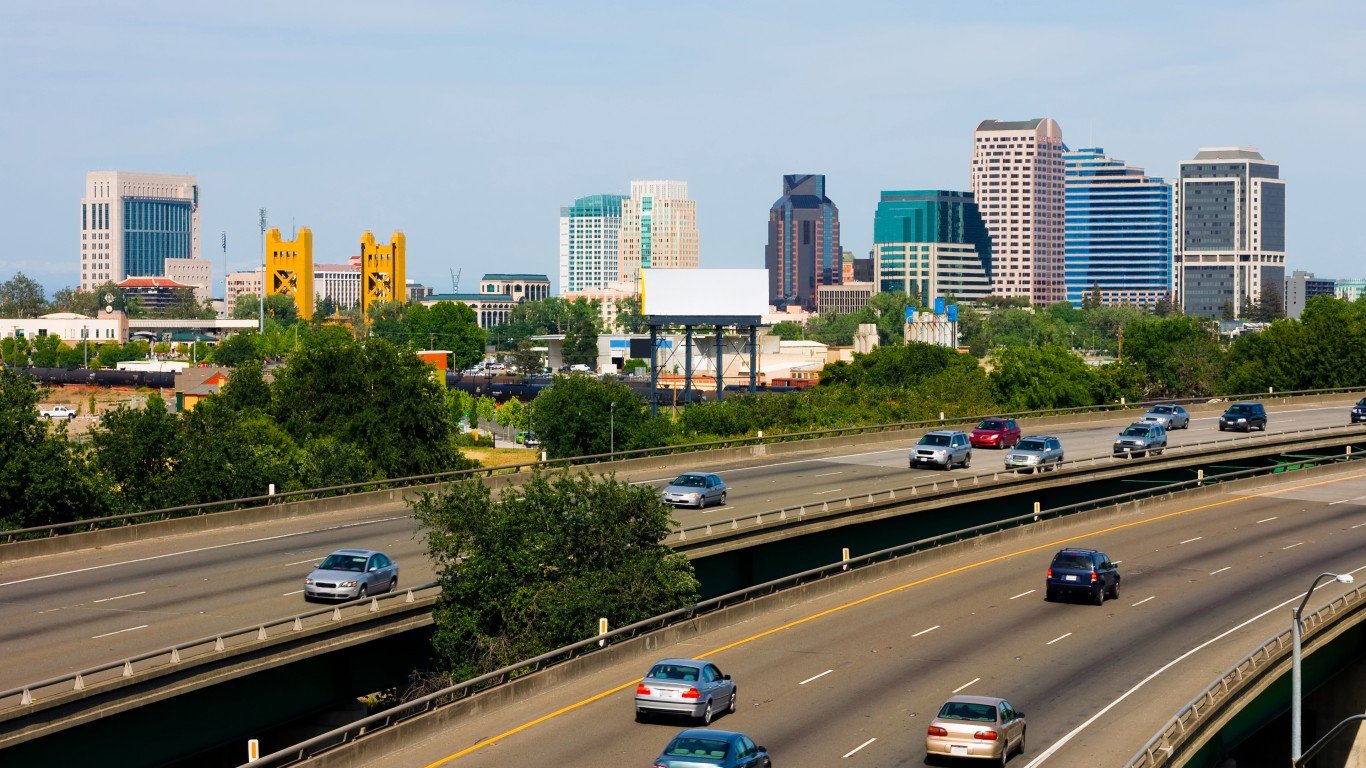
13. Sacramento
> Vehicle miles traveled the week ending April 13: 47% of normal
> Metropolitan area population: 2.35 million
> Confirmed COVID-19 cases as of Apr. 17, 2020: 49.85 per 100,000 (total: 1,169)
> Statewide stay-at-home effective date: March 19, 2020

12. Tampa/St. Petersburg
> Vehicle miles traveled the week ending April 13: 46% of normal
> Metropolitan area population: 3.14 million
> Confirmed COVID-19 cases as of Apr. 17, 2020: 55.56 per 100,000 (total: 1,746)
> Statewide stay-at-home effective date: April 3, 2020
[in-text-ad-2]

11. Boston
> Vehicle miles traveled the week ending April 13: 46% of normal
> Metropolitan area population: 4.88 million
> Confirmed COVID-19 cases as of Apr. 17, 2020: 504.33 per 100,000 (total: 24,588)
> Statewide stay-at-home effective date: March 24, 2020

10. Los Angeles
> Vehicle miles traveled the week ending April 13: 44% of normal
> Metropolitan area population: 13.29 million
> Confirmed COVID-19 cases as of Apr. 17, 2020: 92.69 per 100,000 (total: 12,320)
> Statewide stay-at-home effective date: March 19, 2020
[in-text-ad]

9. Baltimore
> Vehicle miles traveled the week ending April 13: 43% of normal
> Metropolitan area population: 2.80 million
> Confirmed COVID-19 cases as of Apr. 17, 2020: 124.63 per 100,000 (total: 3,493)
> Statewide stay-at-home effective date: March 30, 2020
[recirclink id=682660]

8. Washington DC
> Vehicle miles traveled the week ending April 13: 43% of normal
> Metropolitan area population: 6.25 million
> Confirmed COVID-19 cases as of Apr. 17, 2020: 192.49 per 100,000 (total: 12,033)
> Statewide stay-at-home effective date: April 1, 2020

7. Philadelphia
> Vehicle miles traveled the week ending April 13: 42% of normal
> Metropolitan area population: 6.10 million
> Confirmed COVID-19 cases as of Apr. 17, 2020: 315.63 per 100,000 (total: 19,242)
> Statewide stay-at-home effective date: April 1, 2020
[in-text-ad-2]

6. San Diego
> Vehicle miles traveled the week ending April 13: 41% of normal
> Metropolitan area population: 3.34 million
> Confirmed COVID-19 cases as of Apr. 17, 2020: 62.42 per 100,000 (total: 2,087)
> Statewide stay-at-home effective date: March 19, 2020
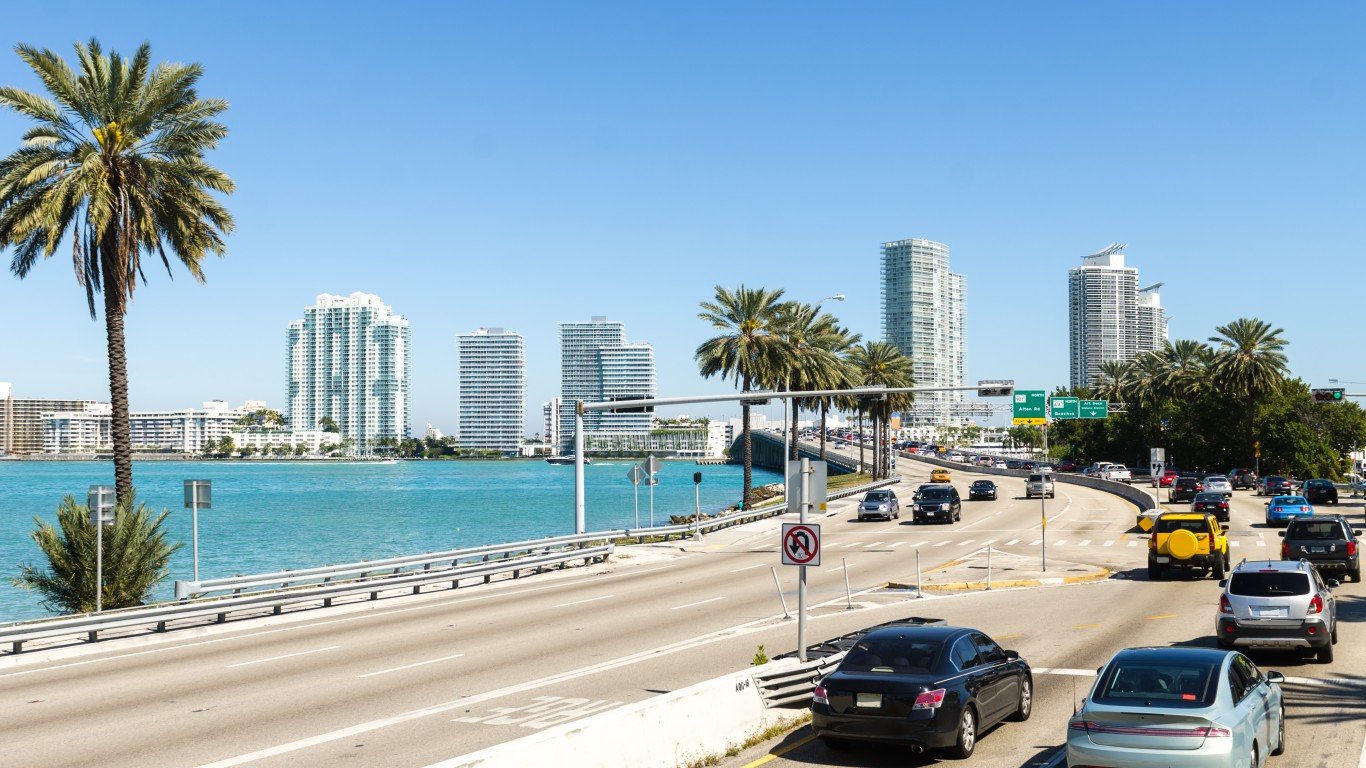
5. Miami
> Vehicle miles traveled the week ending April 13: 39% of normal
> Metropolitan area population: 6.20 million
> Confirmed COVID-19 cases as of Apr. 17, 2020: 228.61 per 100,000 (total: 14,171)
> Statewide stay-at-home effective date: April 3, 2020
[in-text-ad]

4. San Francisco
> Vehicle miles traveled the week ending April 13: 39% of normal
> Metropolitan area population: 4.73 million
> Confirmed COVID-19 cases as of Apr. 17, 2020: 77.03 per 100,000 (total: 3,643)
> Statewide stay-at-home effective date: March 19, 2020
[recirclink id=682693]
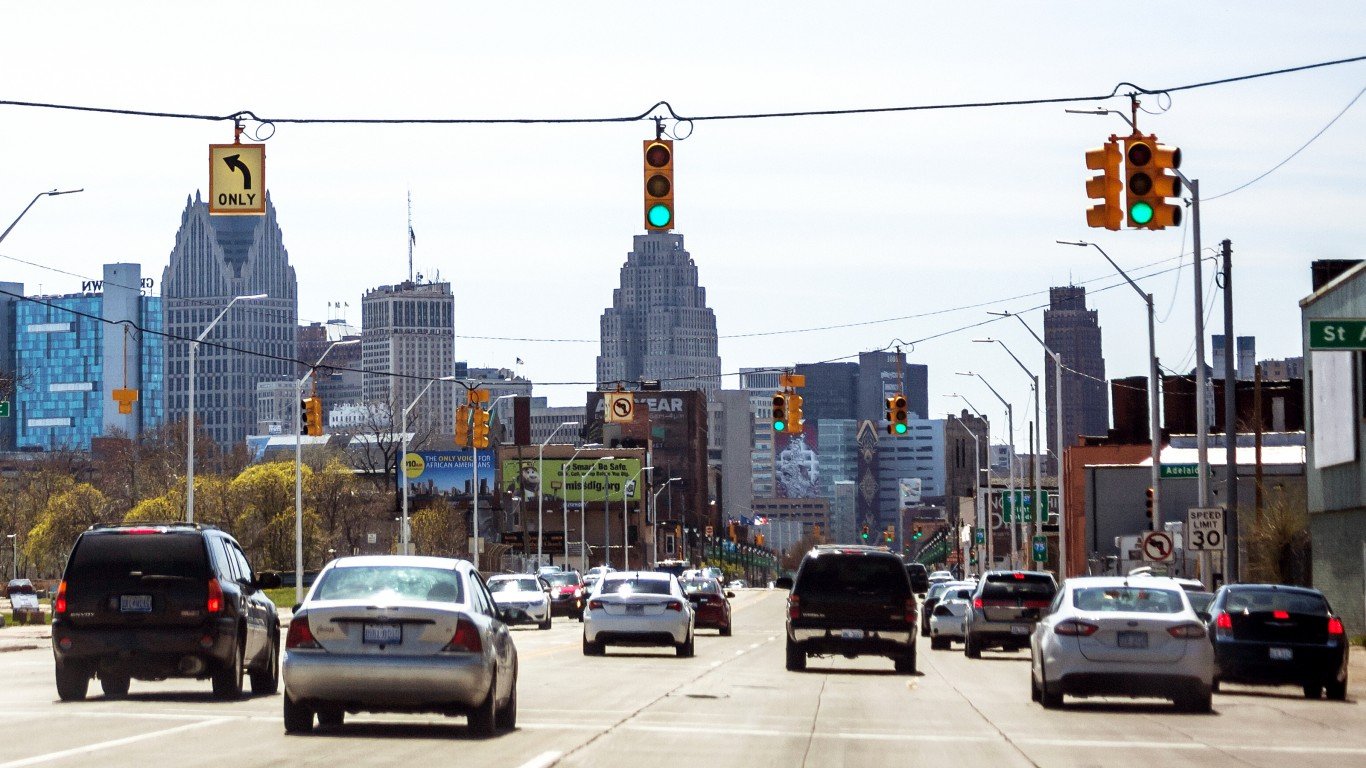
3. Detroit
> Vehicle miles traveled the week ending April 13: 39% of normal
> Metropolitan area population: 4.33 million
> Confirmed COVID-19 cases as of Apr. 17, 2020: 365.33 per 100,000 (total: 15,806)
> Statewide stay-at-home effective date: March 24, 2020

2. Orlando
> Vehicle miles traveled the week ending April 13: 37% of normal
> Metropolitan area population: 2.57 million
> Confirmed COVID-19 cases as of Apr. 17, 2020: 78.51 per 100,000 (total: 2,020)
> Statewide stay-at-home effective date: April 3, 2020
[in-text-ad-2]

1. New York
> Vehicle miles traveled the week ending April 13: 37% of normal
> Metropolitan area population: 19.98 million
> Confirmed COVID-19 cases as of Apr. 17, 2020: 1,409.95 per 100,000 (total: 281,701)
> Statewide stay-at-home effective date: March 22, 2020
Contact [email protected] for any questions or corrections.