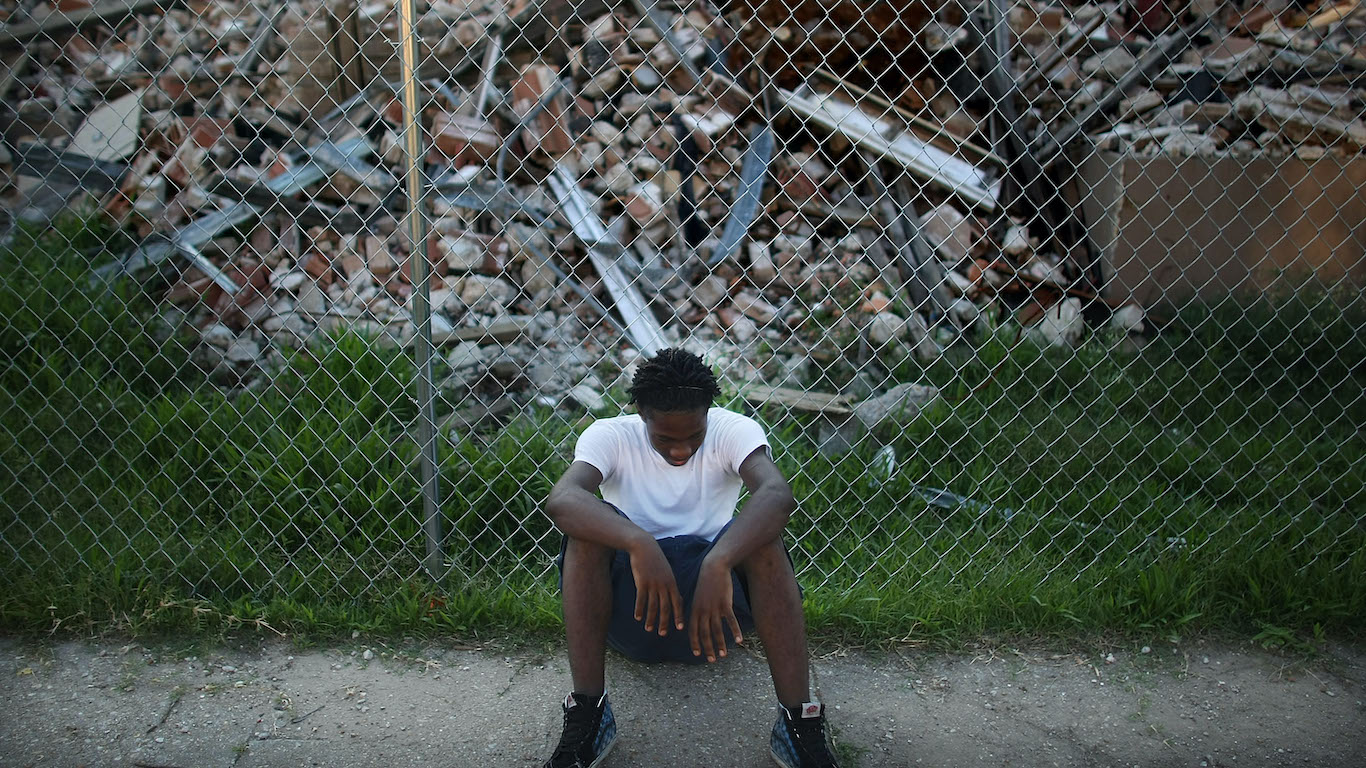
The COVID-19 pandemic has disproportionately hurt black and poor people across the United States. For many Americans, it has laid bare harmful inequities entrenched in the U.S. economic system. Since February, black workers have been more likely than white workers to lose their jobs, and those that still have jobs are more likely to be employed in frontline “essential” jobs. Black Americans make up 12.5% of the U.S. population, but as of the middle of May accounted for 22.4% of COVID-19 deaths.
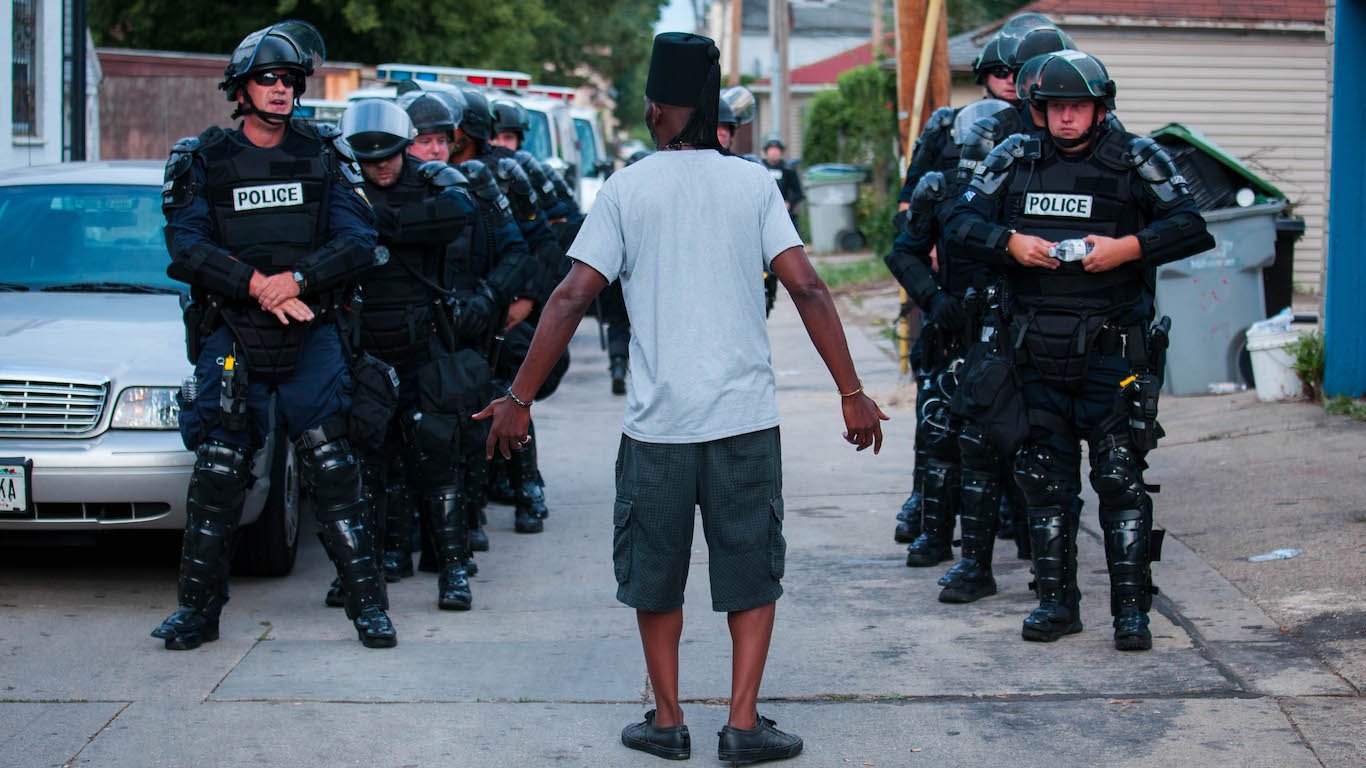
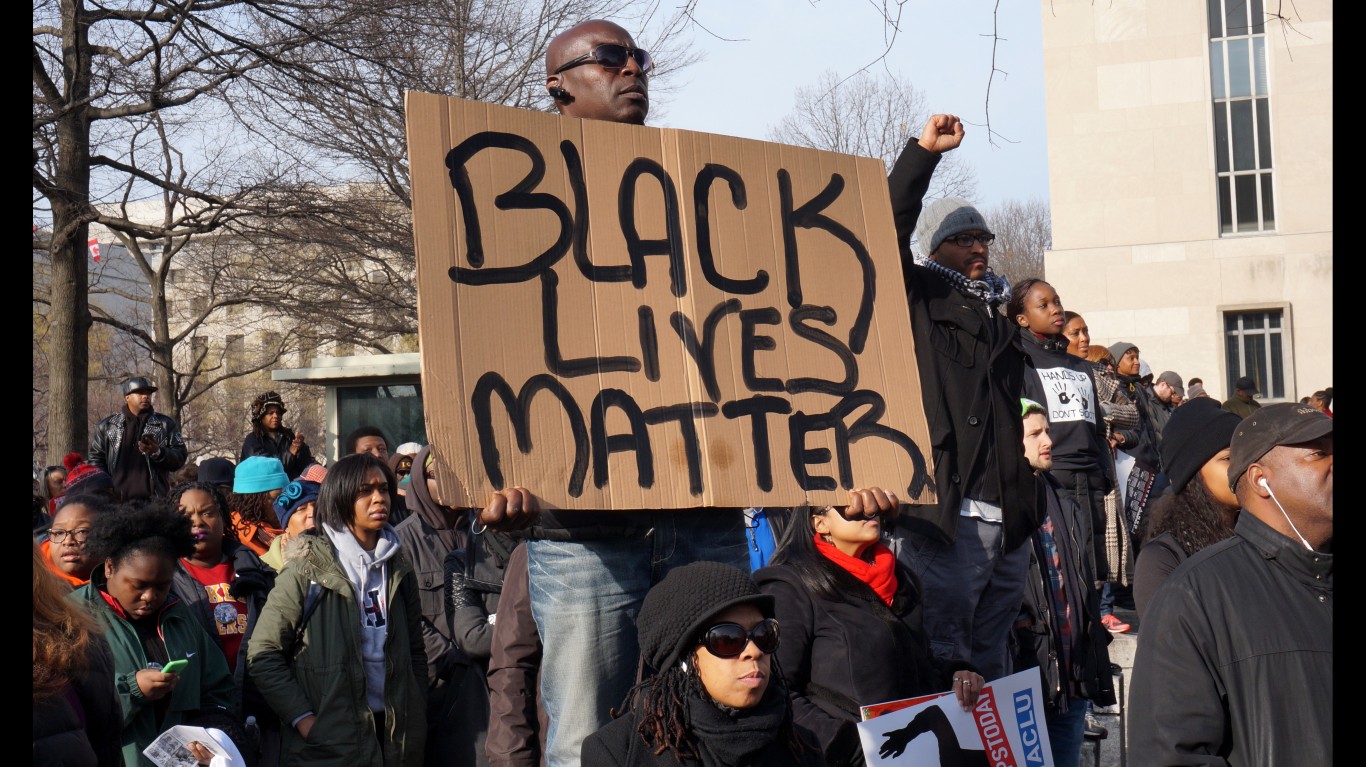
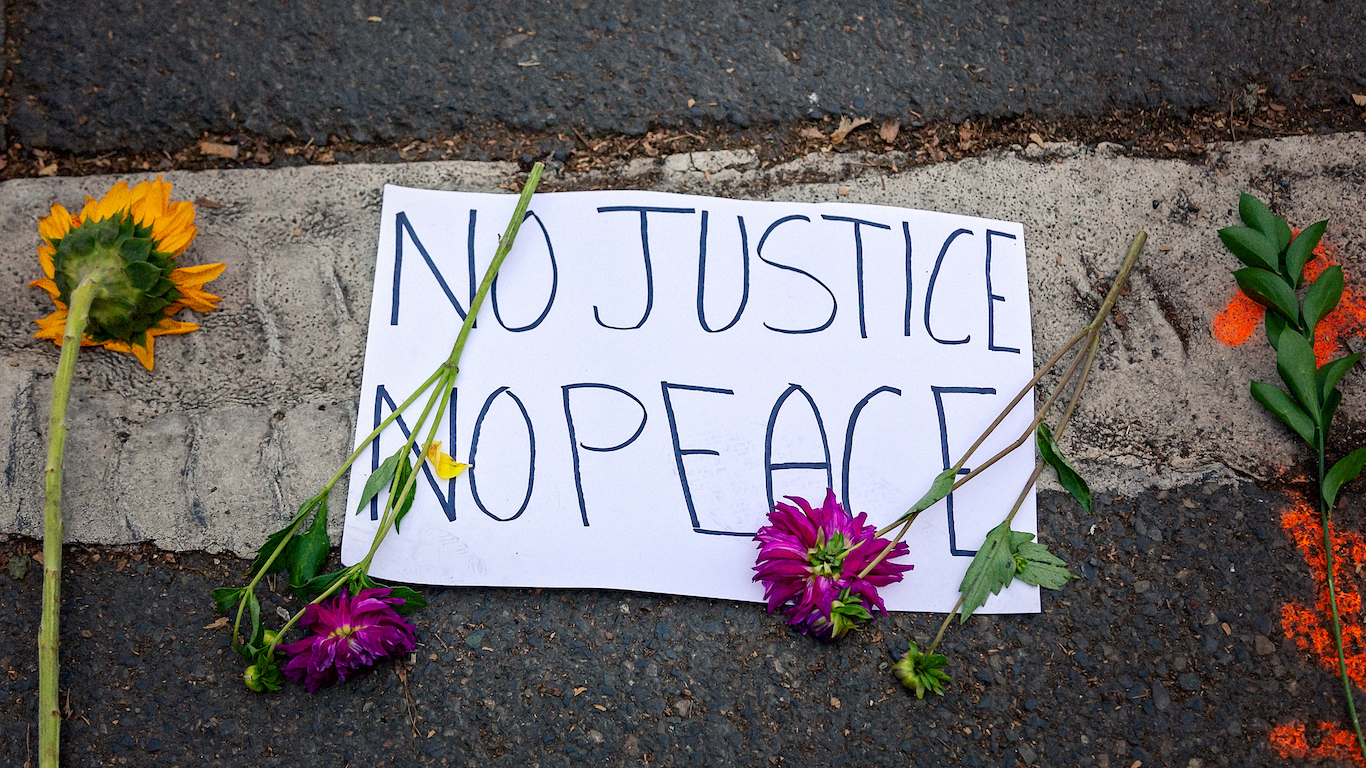
As states ease precautions and Americans’ fears of the virus begin to subside, cities across the nation have erupted in protest following the latest incident of police violence caught on video in the eight-minute killing of George Floyd.
For some Americans, Floyd’s death offered a glimpse into how police have treated black communities for hundreds of years. For others, it was yet another confirmation of what everyday racist policing looks like.
Race, but also location, appears to be related to the likelihood of such violent police incidents. The Minneapolis metropolitan area ranked fourth in our latest ranking of cities with the worst racial divides.
To determine the 15 worst cities for black Americans, 24/7 Wall St. ranked the nation’s metropolitan areas based on racial disparities in income, education, health, incarceration, and other socioeconomic inequalities using data from the U.S. Census Bureau, the Centers for Disease Control and Prevention, and the Bureau of Justice Statistics.
Click here to see the worst cities for Black Americans.
Click here to see our full methodology.
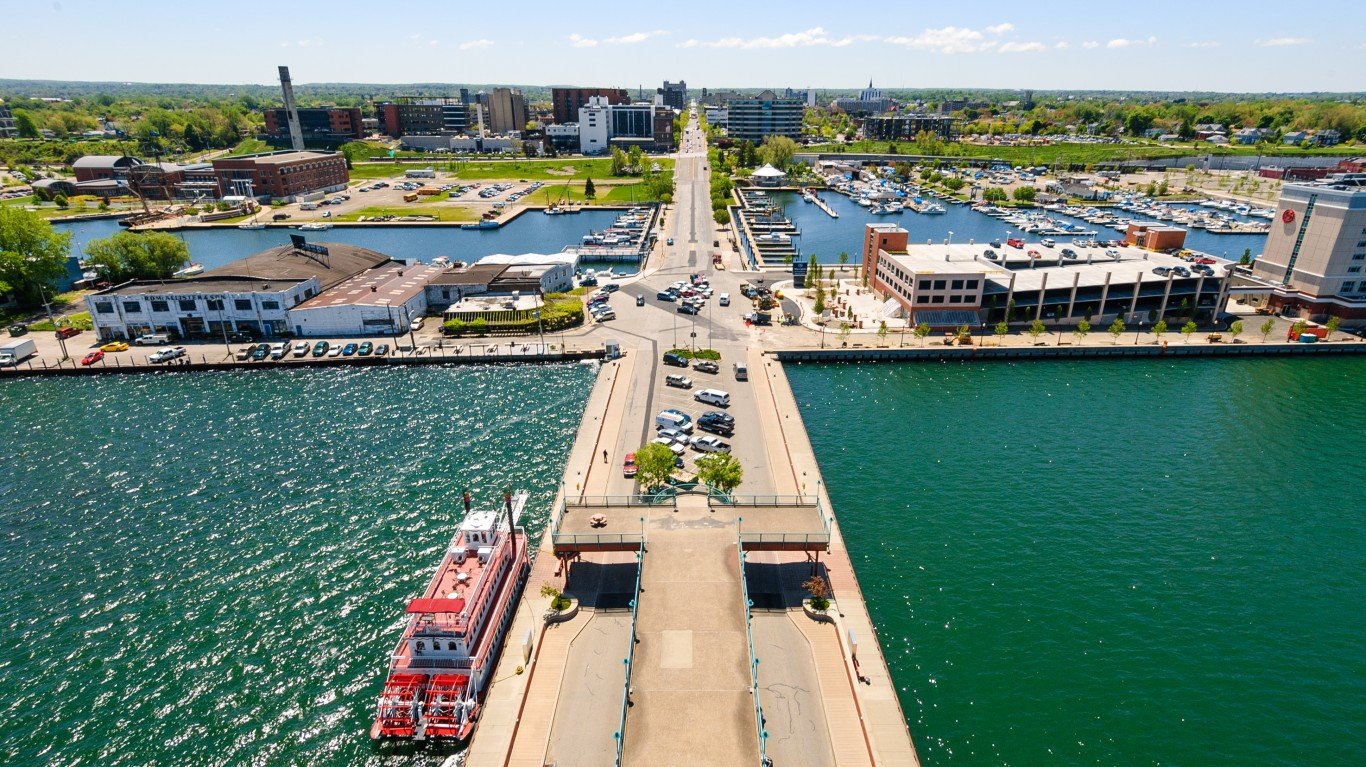
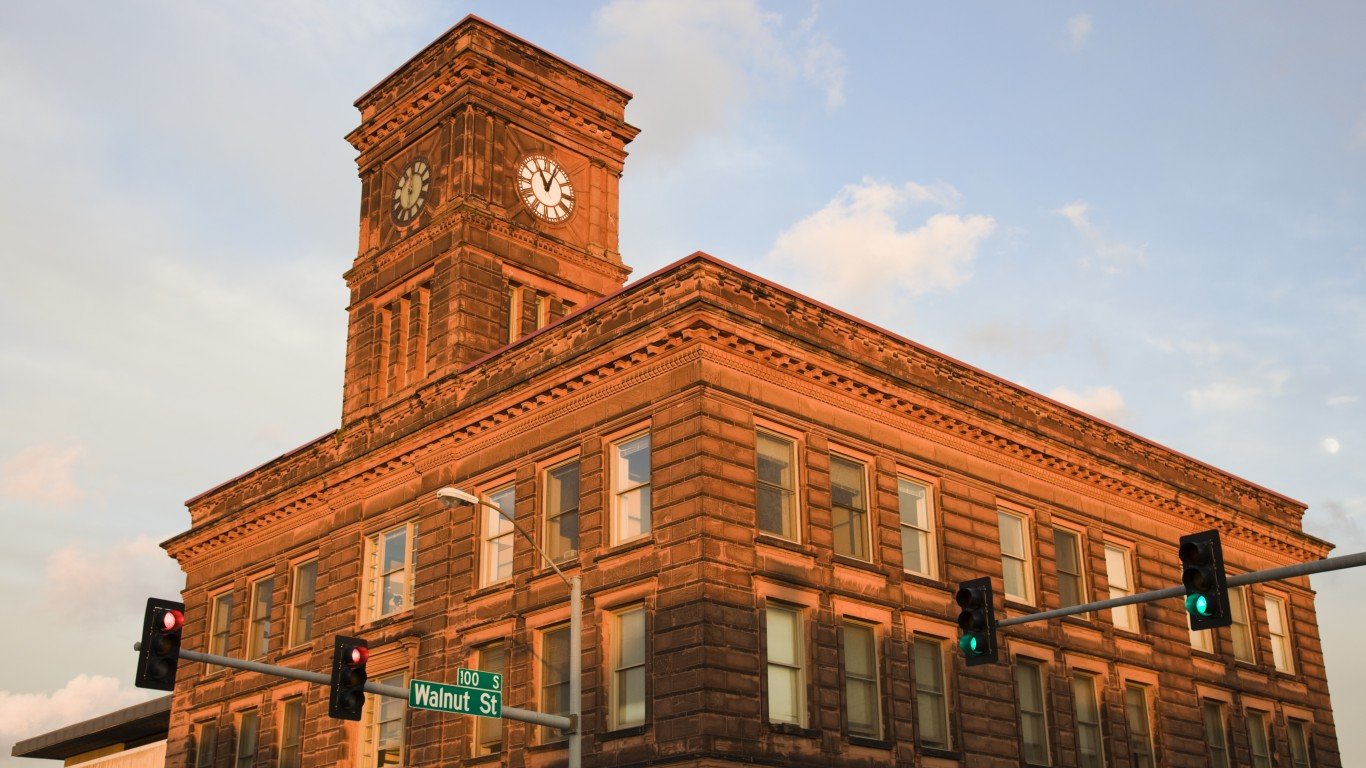
15. Erie, PA
> Black population: 18,859 (6.8%)
> Black median income: $23,074 (45.5% of white income)
> Unemployment: 13.5% (black); 5.8% (white)
> Homeownership rate: 29.3% (black); 69.6% (white)
Erie, Pennsylvania, is a metro area of approximately 278,000 residents on the south shore of Lake Erie. Because of the city’s substantial income, health, and other socioeconomic disparities between black and white residents, Erie ranks as one of the worst cities for black Americans.
The typical household with an African American head of household in Erie earns $23,074 a year, less than half the median income of $50,696 for white households in the metro area. Income is one of the most important determinants of health, and in Erie, 1,053 in every 100,000 black residents die every year, a far higher mortality rate than the white mortality rate of 792 deaths per 100,000 white residents and one of the highest black mortality rates of any U.S. metro area.
[in-text-ad]
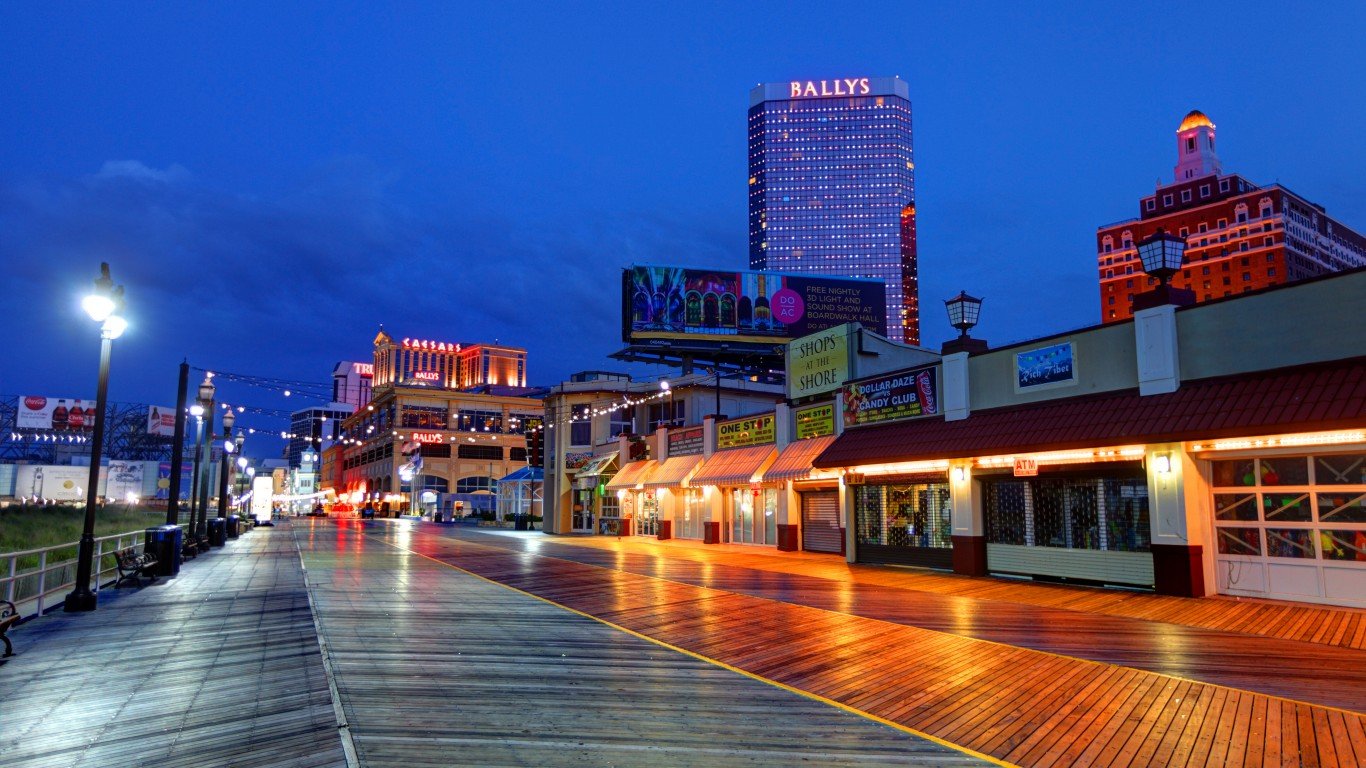
14. Atlantic City-Hammonton, NJ
> Black population: 38,978 (14.3%)
> Black median income: $31,404 (47.3% of white income)
> Unemployment: 16.2% (black); 9.5% (white)
> Homeownership rate: 39.2% (black); 76.0% (white)
The typical black household in Atlantic City earns an income of just $31,404 a year, which is $7,000 less than the nationwide median for black households and less than half the median income of $66,419 among white households in the metro area.
New Jersey has the worst incarceration disparity of any U.S. state. There are just 85 white people incarcerated per 100,000 white state residents, compared to over 1,000 incarcerated black residents per 100,000 black New Jersey residents, nearly 12 times the white state incarceration rate.
[recirclink id=705482]
13. Jackson, MI
> Black population: 13,066 (8.2%)
> Black median income: $21,419 (41.3% of white income)
> Unemployment: 18.0% (black); 7.0% (white)
> Homeownership rate: 35.4% (black); 76.0% (white)
Jackson is a relatively small metro area of approximately 159,000 residents located 70 miles west of Detroit. The typical African American household in Jackson has an income of just $21,419 a year, 41.3% of the median income of $51,829 among white households and 56.1% of the median income for all black households nationwide. Similarly, while 12.7% of white residents in Jackson live in poverty, 44.0% of black residents do — the 15th largest poverty rate disparity of any metro area.
One factor contributing to the large wealth disparity in Jackson may be the high unemployment disparity. An estimated 18.0% of black members of the labor force in Jackson were unemployed as of 2017, 11.0 percentage points more than the 7.0% white unemployment rate.
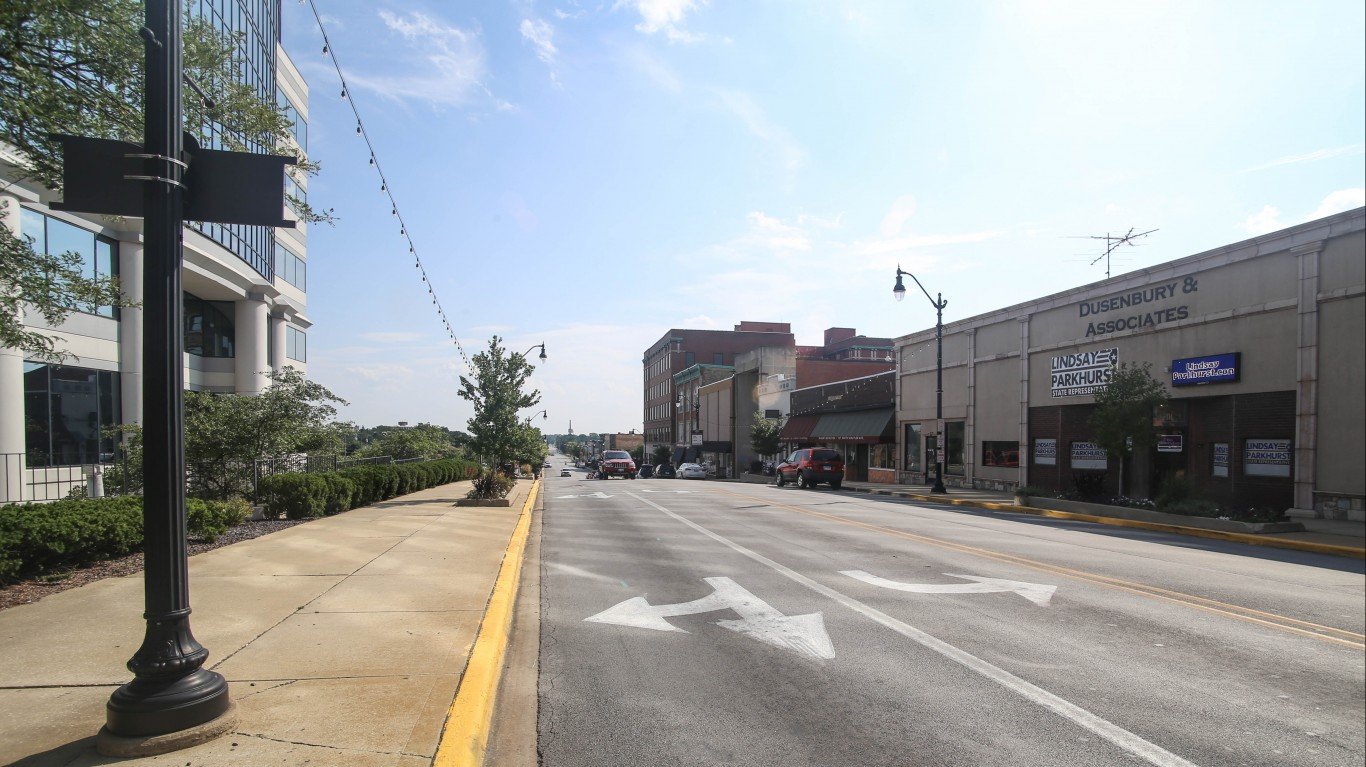
12. Kankakee, IL
> Black population: 16,681 (15.1%)
> Black median income: $29,046 (47.0% of white income)
> Unemployment: 17.3% (black); 5.7% (white)
> Homeownership rate: 33.1% (black); 75.0% (white)
Located approximately 50 miles southwest of Chicago, Kankakee, Illinois, is one of several Rust Belt metro areas where the disparities in poverty, employment, and other socioeconomic measures between white and black residents are far greater than the disparities across the nation as a whole.
In Kankakee, 38.7% of black residents live below the poverty line, more than three times the white poverty rate of 10.4%. Nationwide, the black poverty rate of 25.2% is over twice the 12.0% white poverty rate.
[in-text-ad-2]
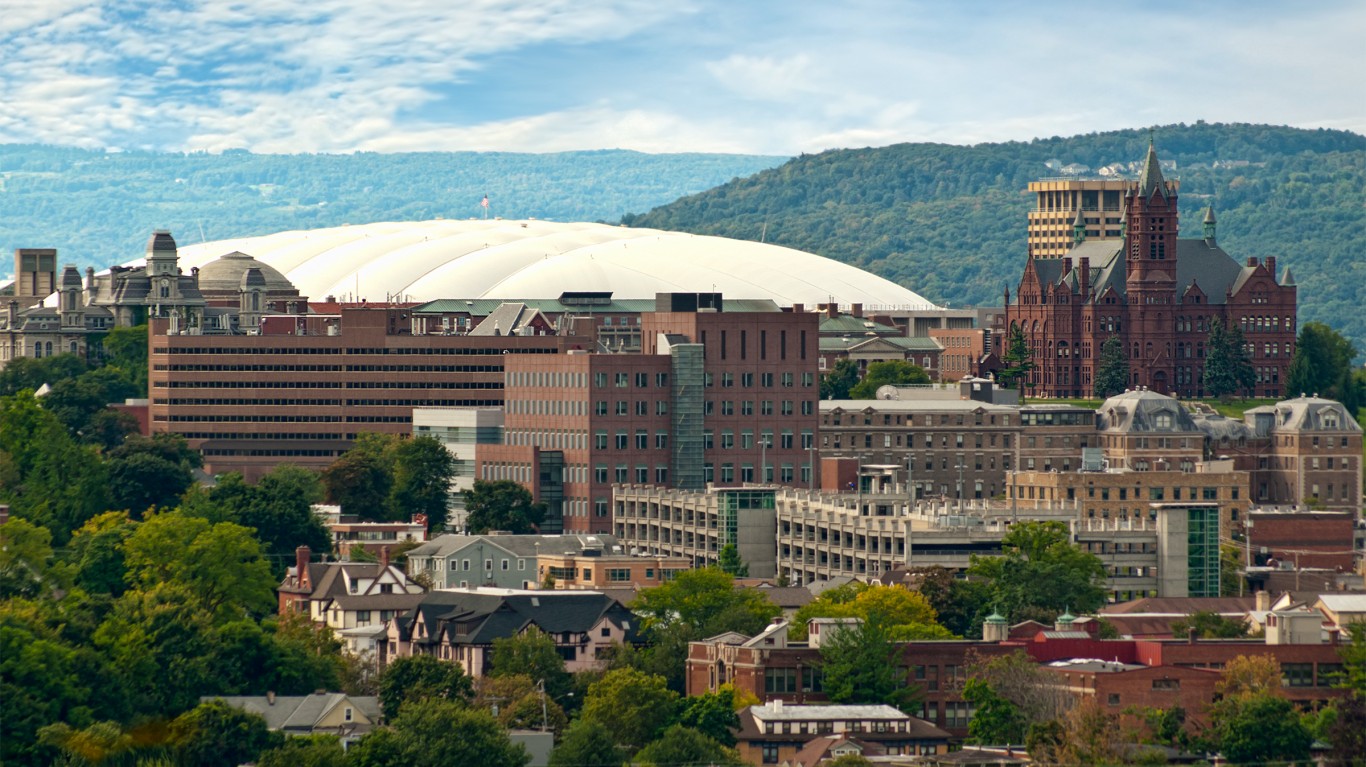
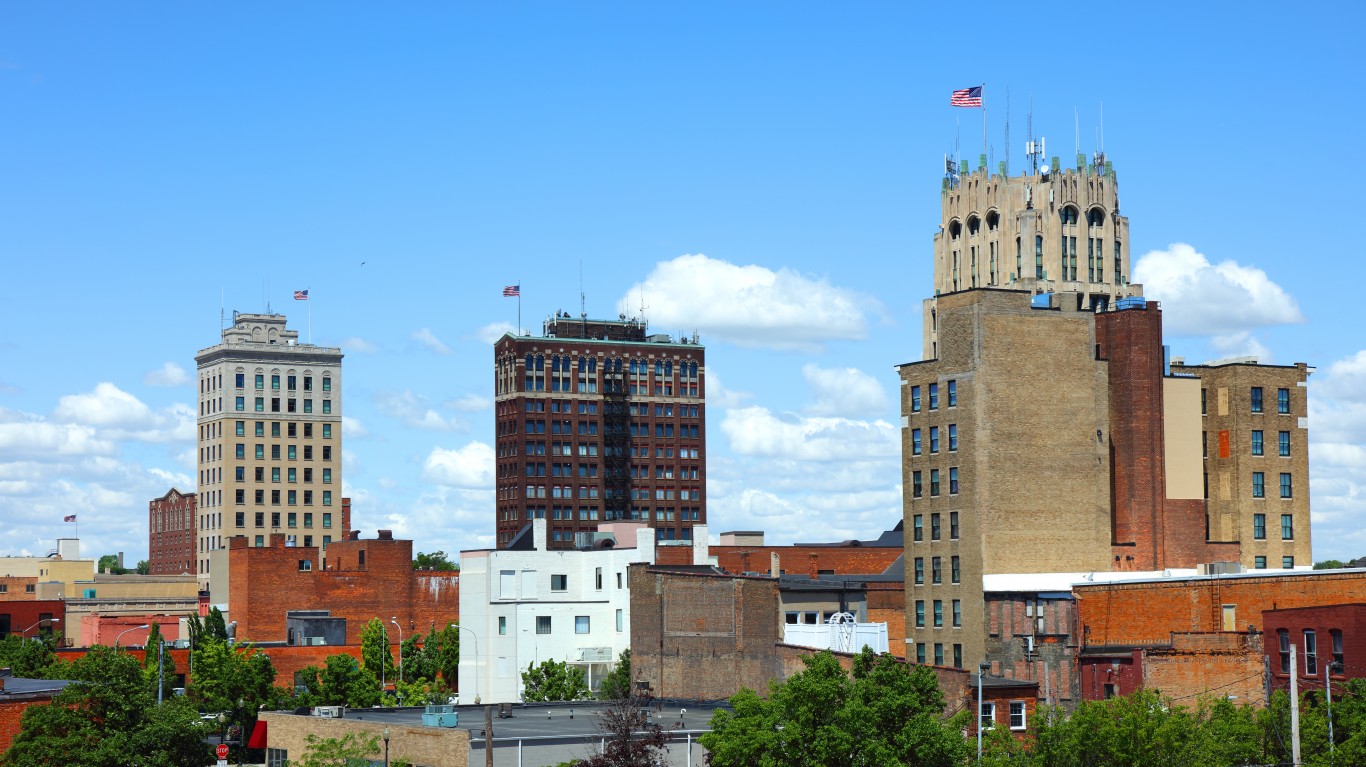
11. Syracuse, NY
> Black population: 52,499 (8.0%)
> Black median income: $30,362 (50.6% of white income)
> Unemployment: 15.1% (black); 5.7% (white)
> Homeownership rate: 27.6% (black); 72.3% (white)
Syracuse is one of several metro areas where the manufacturing sector declined since the middle of the 20th century. This has created economic challenges and may have further exacerbated racial disparities in the area. In 2017, 15.1% of black members of the labor force in Syracuse were unemployed, 9.5 percentage points above the 5.7% white unemployment rate — one of the largest unemployment gaps of any U.S. metro area.
The disparity in unemployment has likely contributed to the wide black-white income gap in Syracuse. The typical black household in Syracuse earns $30,362 a year, just 50.6% of the white median household income. Similarly, 37.0% of black residents live in poverty, more than three times the 11.9% white poverty rate.

10. Rochester, NY
> Black population: 117,757 (10.9%)
> Black median income: $29,084 (48.4% of white income)
> Unemployment: 14.8% (black); 5.0% (white)
> Homeownership rate: 31.9% (black); 72.8% (white)
Racial disparities in educational attainment in the United States are tied to other forms of inequality, including gaps in poverty and school quality. Nationwide, 84.9% of black adults have a high school diploma — 4.4 percentage points below the 89.3% of white adults with a high school diploma. In Rochester, 78.4% of black adults have a high school diploma, 14.0 percentage points below the 92.4% of whites — one of the largest gaps in the country.
People with a high school education are more likely to have higher wages than those without a high school education, and they are less likely to live in poverty. In Rochester, 34.5% of black residents live in poverty, more than three times the 10.2% white poverty rate. By comparison, nationwide, 25.2% of black Americans live in poverty, over twice the 12.0% white poverty rate.
[in-text-ad]
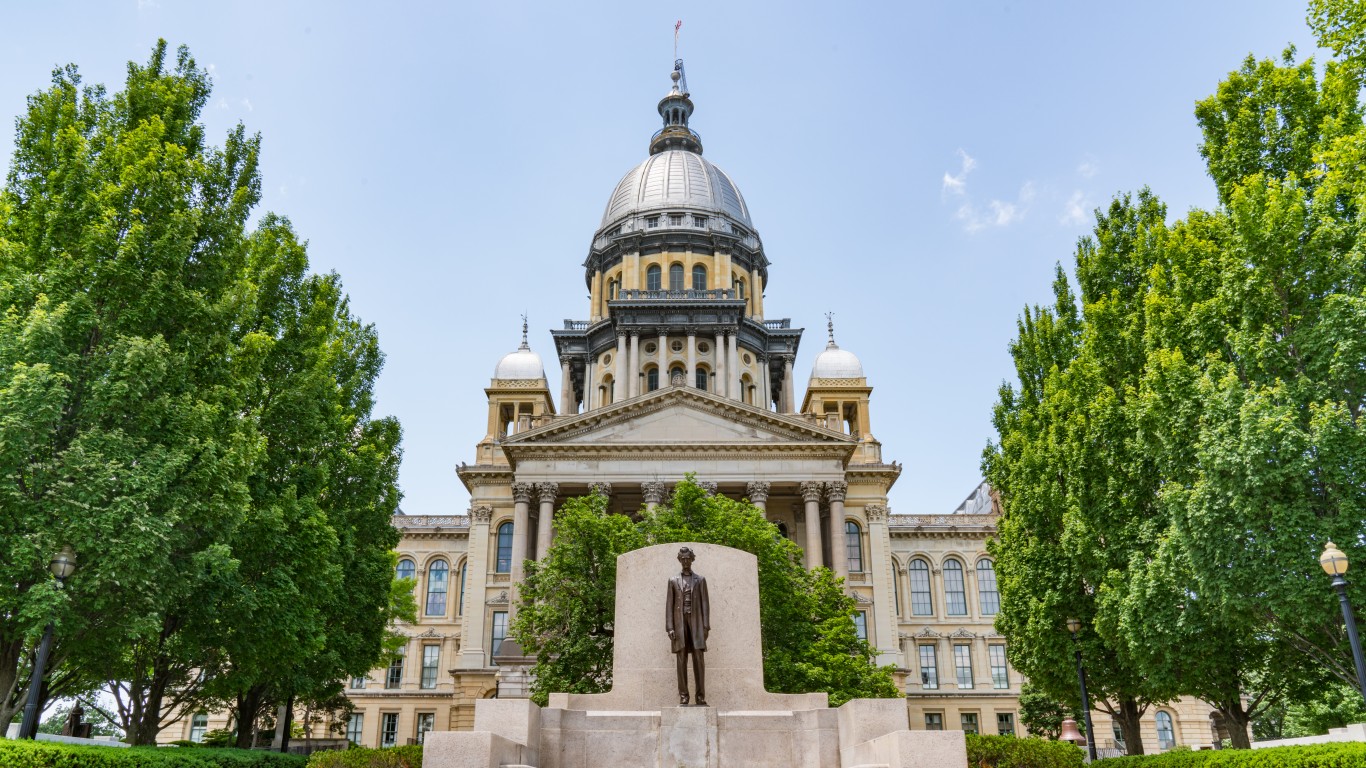
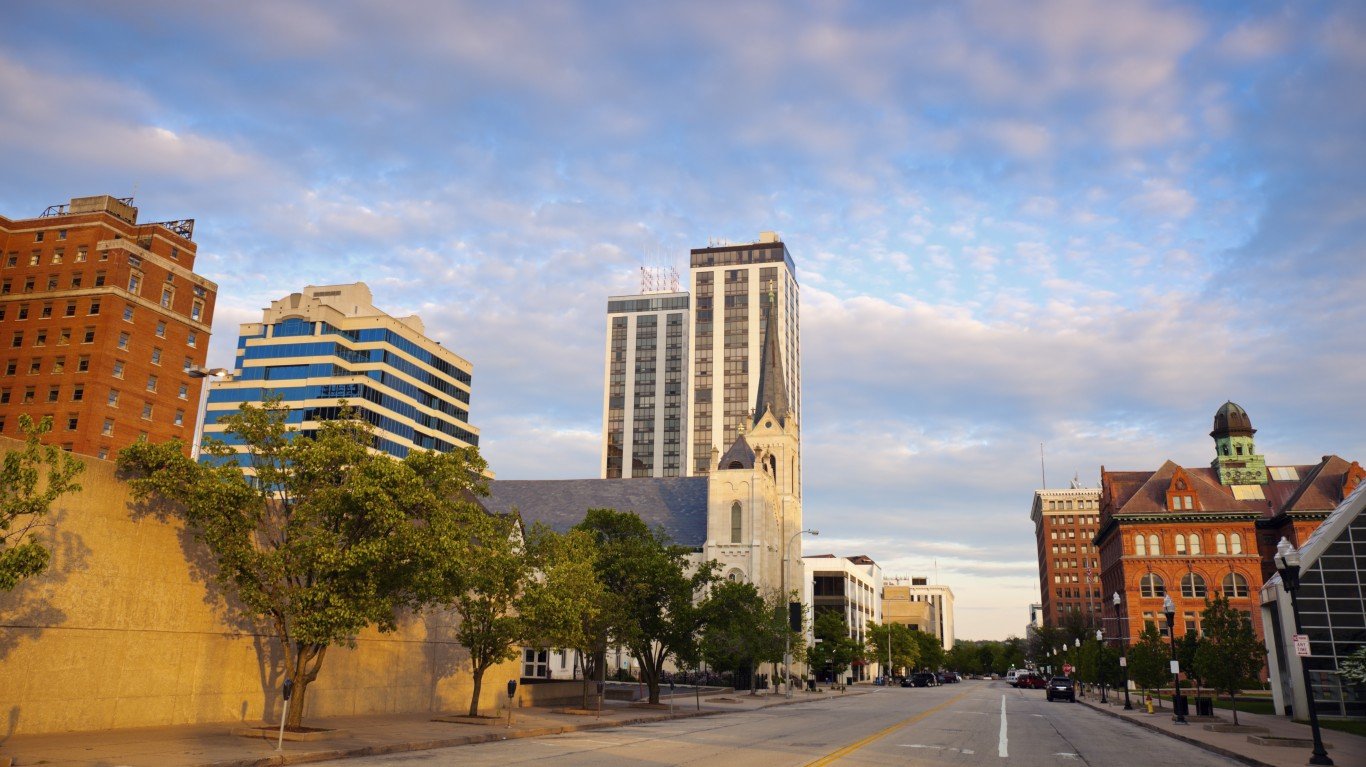
9. Springfield, IL
> Black population: 25,010 (11.9%)
> Black median income: $26,572 (42.0% of white income)
> Unemployment: 16.4% (black); 5.5% (white)
> Homeownership rate: 31.6% (black); 75.2% (white)
Springfield is one of several metro areas in central Illinois where disparities in income, education, and other socioeconomic measures are far greater than disparities across the nation as a whole. The median income for black households in Springfield of $26,572 is just 42.0% of the median income of $63,263 for white households, the 18th largest gap of any U.S. metro area.
One factor contributing to the income disparity in Springfield is the large gap in unemployment between white and black members of the labor force. While nationwide the 2017 black unemployment rate of 11.9% was 6.3 percentage points above the white unemployment rate of 5.5%, in Springfield, the black unemployment rate of 16.4% was 10.9 percentage points above the white figure of 5.5% — one of the largest disparities of any city in the country.
[recirclink id=709696]
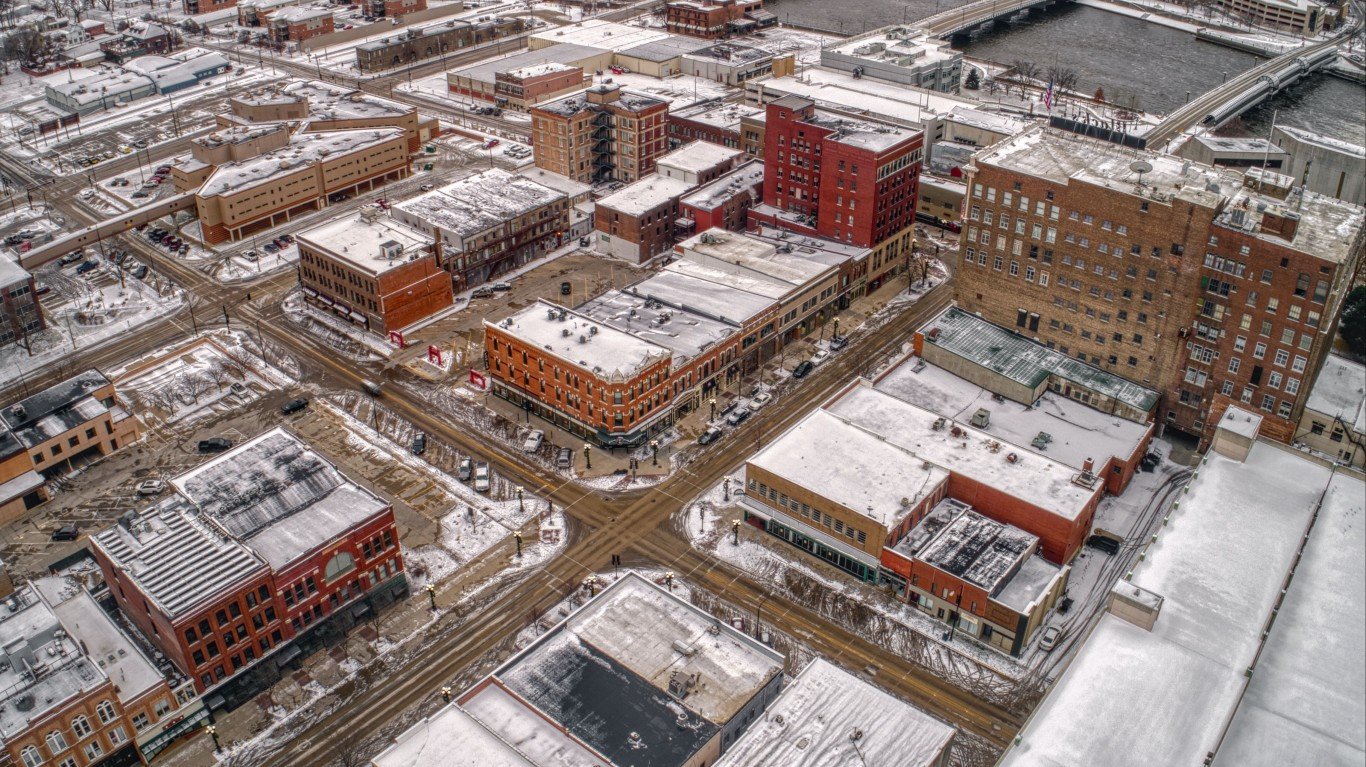
8. Rockford, IL
> Black population: 36,630 (10.7%)
> Black median income: $27,862 (49.7% of white income)
> Unemployment: 23.8% (black); 7.7% (white)
> Homeownership rate: 31.6% (black); 73.1% (white)
Rockford is a small metro area of approximately 341,000 residents located about 80 miles northwest of Chicago. As of 2017, 23.8% of black members of the labor force in Rockford were unemployed, the sixth largest share of any metro area and 16 percentage points above the 7.7% white unemployment rate — the ninth largest disparity of any U.S. city.
The gap in unemployment is one of the contributing factors to other racial inequalities in the area. The typical black household in Rockford earns $27,862 a year, less than half the white median household income of $56,026. Similarly, 37.3% of black residents live in poverty, more than three times the 10.3% white poverty rate.
7. Peoria, IL
> Black population: 34,326 (9.1%)
> Black median income: $28,019 (46.4% of white income)
> Unemployment: 18.1% (black); 5.5% (white)
> Homeownership rate: 32.6% (black); 76.1% (white)
Racial disparities in educational attainment in the United States are tied to other forms of inequality, including gaps in poverty and school quality. While nationwide, 84.9% of black adults have a high school diploma — 4.4 percentage points less than the white high school attainment rate of 89.3% — in Peoria, Illinois, 79.6% of black adults have a high school diploma, 13.4 percentage points below the area’s white high school attainment rate of 92.9%. This is one of the largest such gaps in the country. Those without a high school diploma are more likely to struggle financially, and in Peoria, 34.5% of black residents live below the poverty line, nearly four times the 9.3% white poverty rate in the area.
Homeownership is one way many Americans build long-term wealth and avoid the cycle of poverty. In Peoria, just 32.6% of African American households own homes — less than half the 76.1% white homeownership rate.
[in-text-ad-2]
6. Niles-Benton Harbor, MI
> Black population: 22,567 (14.6%)
> Black median income: $23,540 (45.2% of white income)
> Unemployment: 17.4% (black); 5.6% (white)
> Homeownership rate: 35.7% (black); 75.6% (white)
Less than 15% of Niles area residents are black, but 47.2% of the black population lives in census tracts where at least half of the population is also black — the fifth highest level of segregation of any U.S. metro area. Like in many of the most segregated cities in America, the segregation in Niles has likely led to significant gaps in employment and education opportunities and outcomes by race and contributed to the vast racial disparities in the metro area.
The typical African American household in the Niles-Benton Harbor metro area earns $23,540 a year, just 45.2% of the white median household income of $52,032 in the city. Income is one of the main determinants of health, and in Niles, 1,089 in every 100,000 black residents die every year, far more than the corresponding white mortality rate of 797 deaths per 100,000.

5. Danville, IL
> Black population: 10,995 (13.9%)
> Black median income: $23,963 (49.2% of white income)
> Unemployment: 18.8% (black); 6.9% (white)
> Homeownership rate: 31.7% (black); 75.8% (white)
Just 5.3% of black adults in Danville have a bachelor’s degree. This is the fourth lowest share of all metro areas nationwide and nearly one-third the 15.4% college attainment rate for white adults in the metro area — itself one of the lowest shares in the nation. Racial disparities in educational attainment in the United States are tied to other forms of inequality, including the concentration of poverty in nonwhite communities. Those without a college education are far more likely to live below the poverty line than those with a college education, and in Danville, 48.3% of black residents live in poverty — the ninth highest poverty rate nationwide and far more than the 15.2% white poverty rate in the metro area.
Poverty status is one of the clearest determinants of health and life expectancy, and in Danville, health outcomes are far worse for the black population than the white population. For every 100,000 black residents in Danville, 1,208 die each year, the third highest black mortality rate nationwide among metro areas. The white mortality rate in the area is considerably lower, at 923 deaths per 100,000 white residents.
[in-text-ad]

4. Minneapolis-St. Paul-Bloomington, MN-WI
> Black population: 278,802 (7.9%)
> Black median income: $34,174 (43.4% of white income)
> Unemployment: 10.3% (black); 3.6% (white)
> Homeownership rate: 25.4% (black); 75.3% (white)
While white residents of the Twin Cities metro area are better off than white Americans nationwide in a number of measures, the area’s black population is worse off by several metrics compared to both the metro area’s white residents and the black population nationwide.
The typical white household in Minneapolis, for example, earns $78,706 a year, over $17,000 more than the $61,363 national figure. Meanwhile, the typical black household in Minneapolis earns $34,174 a year, 43.4% of the median for white households in the area and $4,000 less than the median among black households nationwide.
[recirclink id=708610]
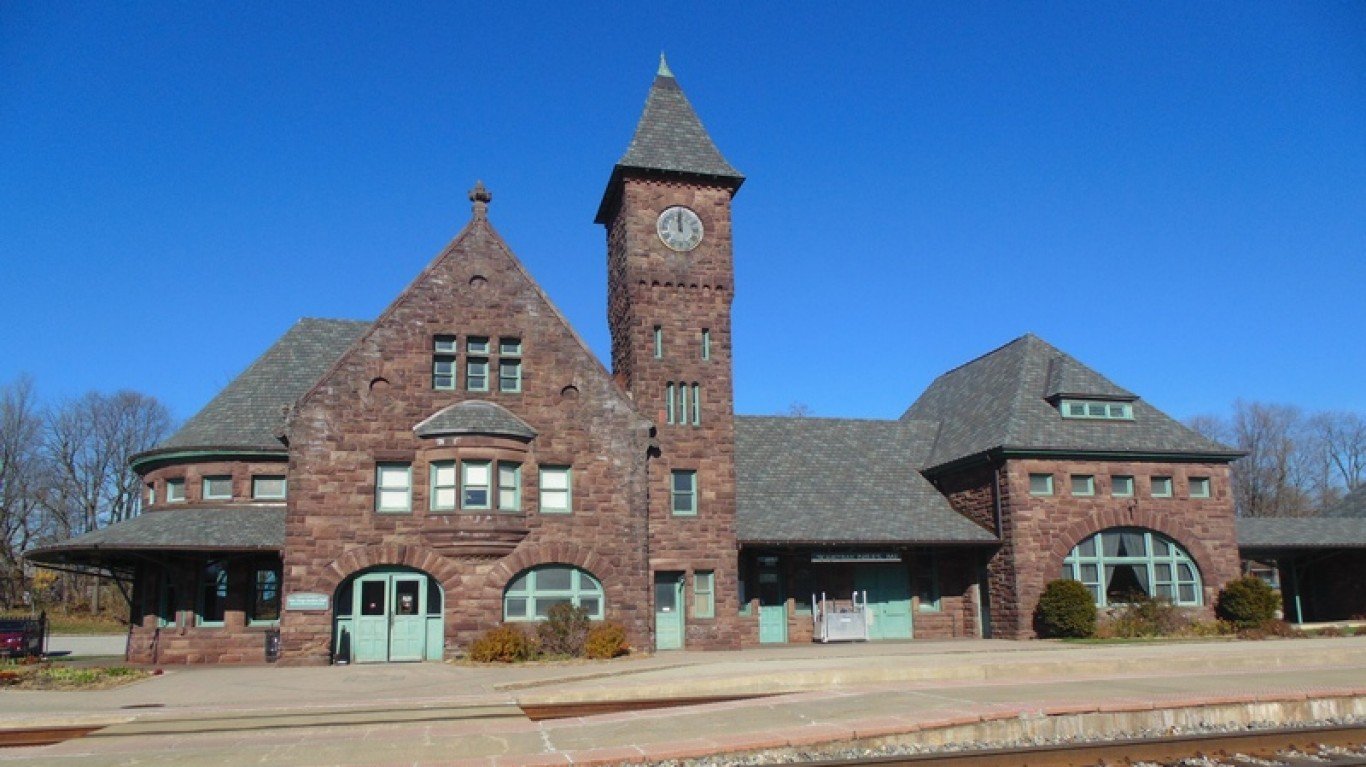
3. Waterloo-Cedar Falls, IA
> Black population: 12,074 (7.1%)
> Black median income: $27,811 (49.2% of white income)
> Unemployment: 19.7% (black); 4.0% (white)
> Homeownership rate: 34.4% (black); 72.3% (white)
While 84.9% of black adults nationwide have a high school diploma — 4.4 percentage points less than the white high school attainment rate of 89.3% — in the Waterloo-Cedar Falls metro area, 80.2% of black adults have a high school diploma, 13.4 percentage points below the 93.6% white attainment rate, one of the largest such gaps in the country.
Individuals without a high school education are far more likely to be unemployed than those with greater educational attainment. In the Waterloo-Cedar Falls area, 19.7% of black members of the labor force were unemployed as of 2017, 15.7 percentage points above the 4.0% white unemployment rate. By comparison, the 2017 black unemployment rate nationwide of 11.9% was 6.3 percentage points higher than the 5.5% white figure.
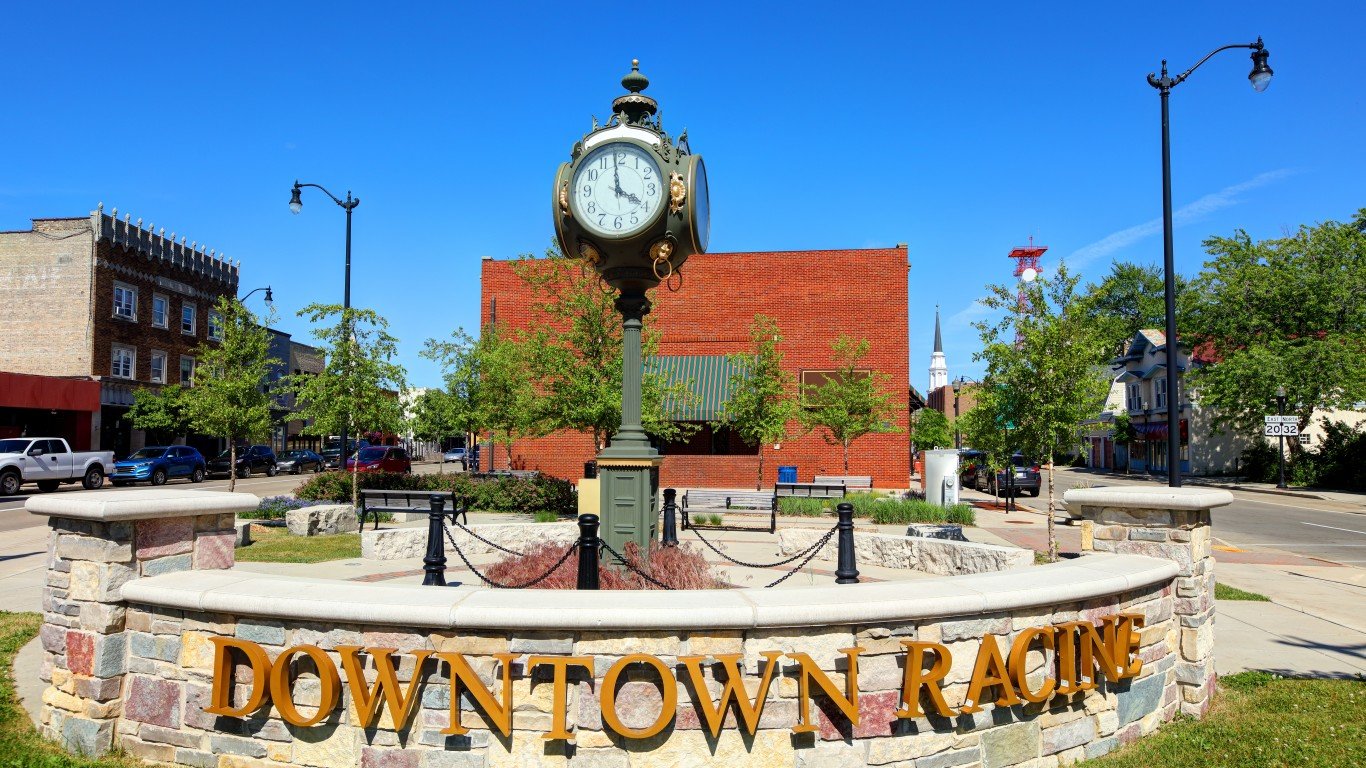
2. Racine, WI
> Black population: 20,797 (10.7%)
> Black median income: $27,658 (43.4% of white income)
> Unemployment: 13.1% (black); 5.1% (white)
> Homeownership rate: 30.6% (black); 74.8% (white)
Growing up in poverty presents various socioeconomic challenges that often serve as significant barriers to achieving a high school or postsecondary education, –and those with lower educational attainment are more likely to remain in these conditions.
Just 7.4% of black adults in Racine have a bachelor’s degree — the 12th smallest share of any metro nationwide and 19.3 percentage points less than the 26.7% college attainment rate for white adults in the metro area. Individuals without a bachelor’s degree are more likely to live below the poverty line than those with a college education, and in Racine, 30.8% of black residents live in poverty, nearly four times the corresponding white poverty rate of 8.7%.
[in-text-ad-2]

1. Milwaukee-Waukesha-West Allis, WI
> Black population: 257,895 (16.4%)
> Black median income: $28,928 (43.8% of white income)
> Unemployment: 13.9% (black); 3.9% (white)
> Homeownership rate: 27.8% (black); 68.2% (white)
Milwaukee is one of the many Rust Belt cities where a history of redlining, exclusionary zoning, and discriminatory lending practices have contributed to segregation — that remains today — and to some of the largest racial disparities in income, health, and other socioeconomic measures in the country. While nationwide some 16.8% of black Americans live in predominantly black neighborhoods, 35.2% of black Milwaukee residents do — the 20th largest share of any metro area.
The typical black household in Milwaukee earns just $29,928 a year, 43.8% of the median income of $66,097 among white households. Income is one of the primary correlates to health and life expectancy, and in Milwaukee, 1,020 in every 100,000 black residents die every year — over 300 more deaths per 100,000 than the white mortality rate, one of the largest disparities nationwide.
Methodology
To determine the 15 worst cities for black Americans, 24/7 Wall St. created an index consisting of eight measures to assess race-based gaps in socioeconomic conditions in each of the nation’s metropolitan areas. For each city we evaluated the gap in socioeconomic factors — such as poverty and education levels — between white and black Americans living in that city. Creating the index in this way ensured that cities were ranked on the differences between black and white residents and not on absolute levels of socioeconomic development.
For each measure, we constructed an index of the gaps between black and white Americans. The index was standardized using interdecile normalization so outliers in the data did not skew results. We excluded metro areas where black residents comprise less than 5% of the population or where data limitations made comparisons between racial groups impossible.
Within the index, we considered 2017 data from the U.S. Census Bureau’s American Community Survey on median household income, poverty, adult high school and bachelor’s degree attainment, homeownership, and unemployment for each racial group. All ACS data are five-year estimates.
Data on incarceration by race are for 2017 and came from the Bureau of Justice Statistics. These statistics were adjusted for population using one-year ACS data. Because states, rather than metro areas, are responsible for the prison population, incarceration rates are for the state where the metro area is located.
If a metro area spans more than one state, we used the state in which the metro area’s principal city is located. Using data on age-adjusted mortality rates by race for each U.S. county from 2013-2017 from the Centers for Disease Control and Prevention and boundary definitions from the Census Bureau, we calculated mortality rates at the metro level. Incarceration and mortality rates are per 100,000 residents.
Contact [email protected] for any questions or corrections.