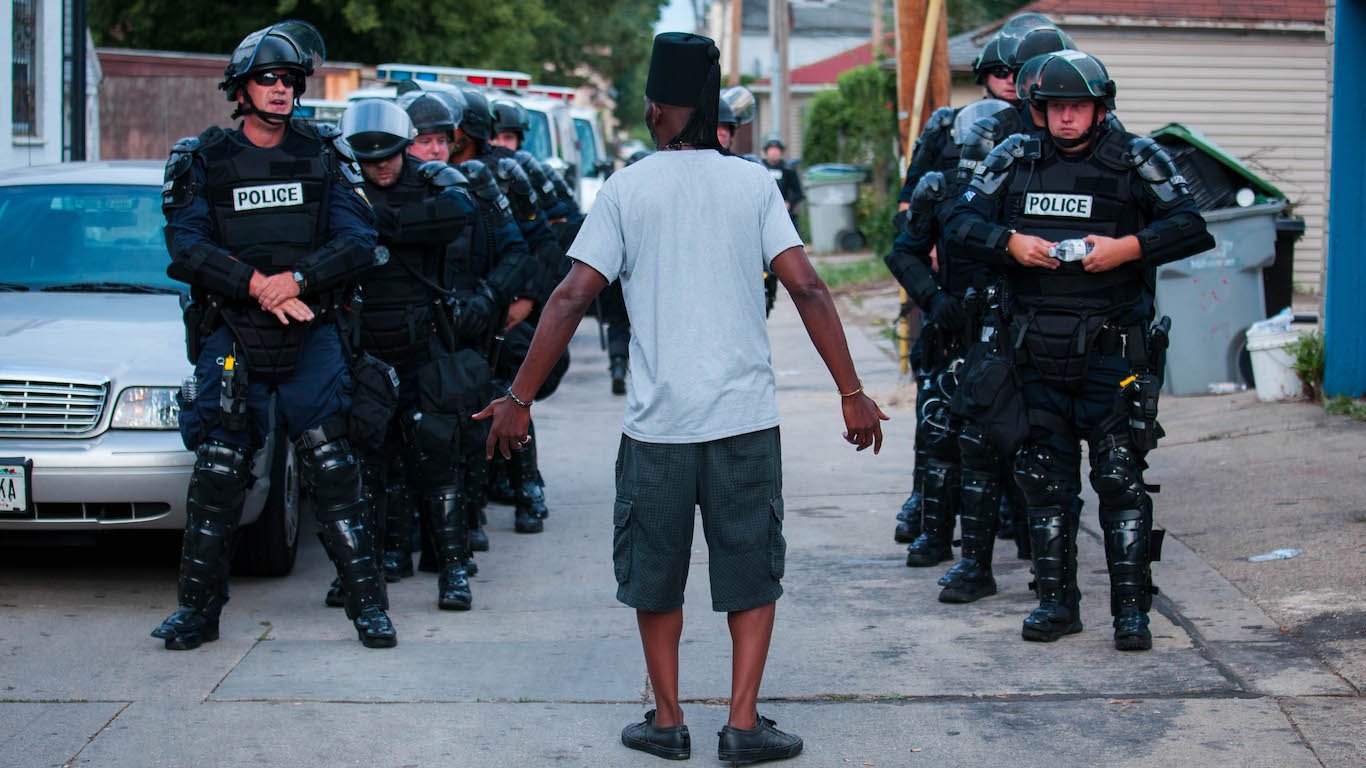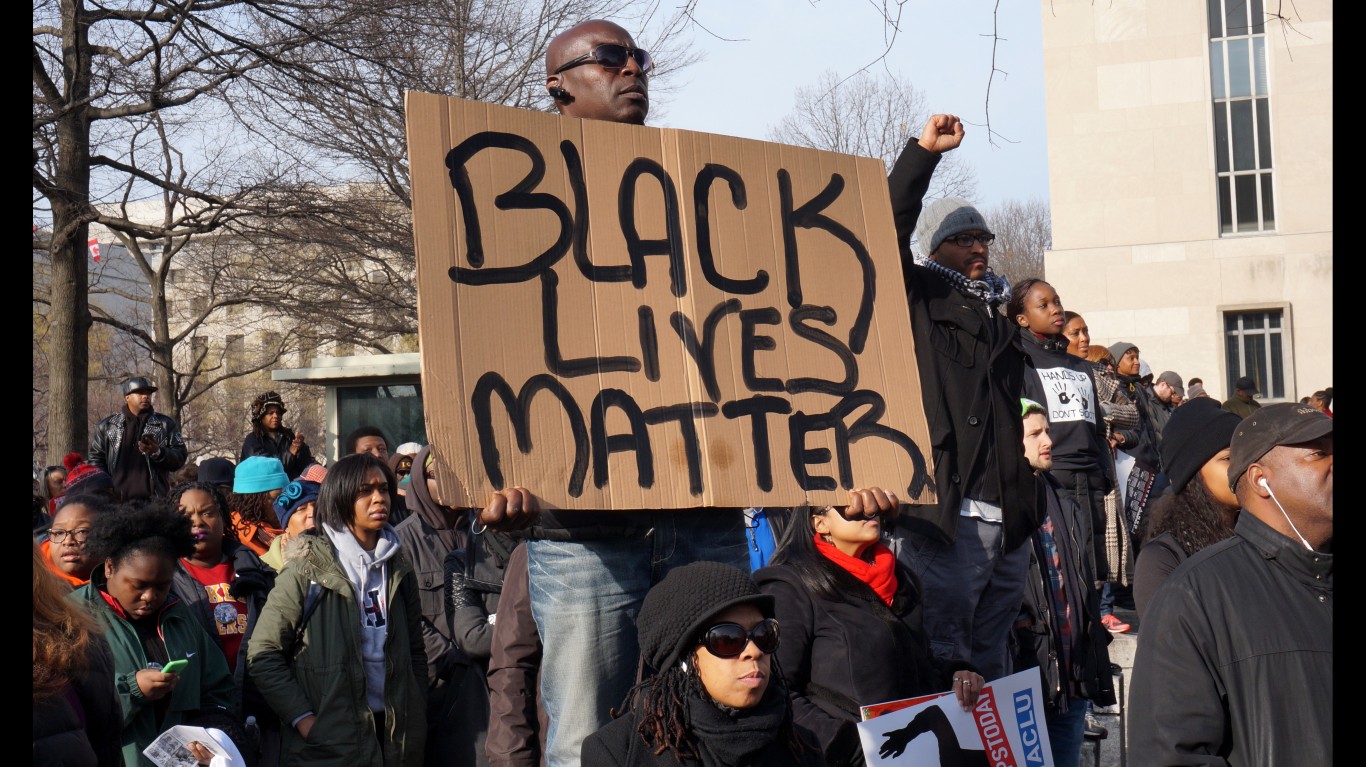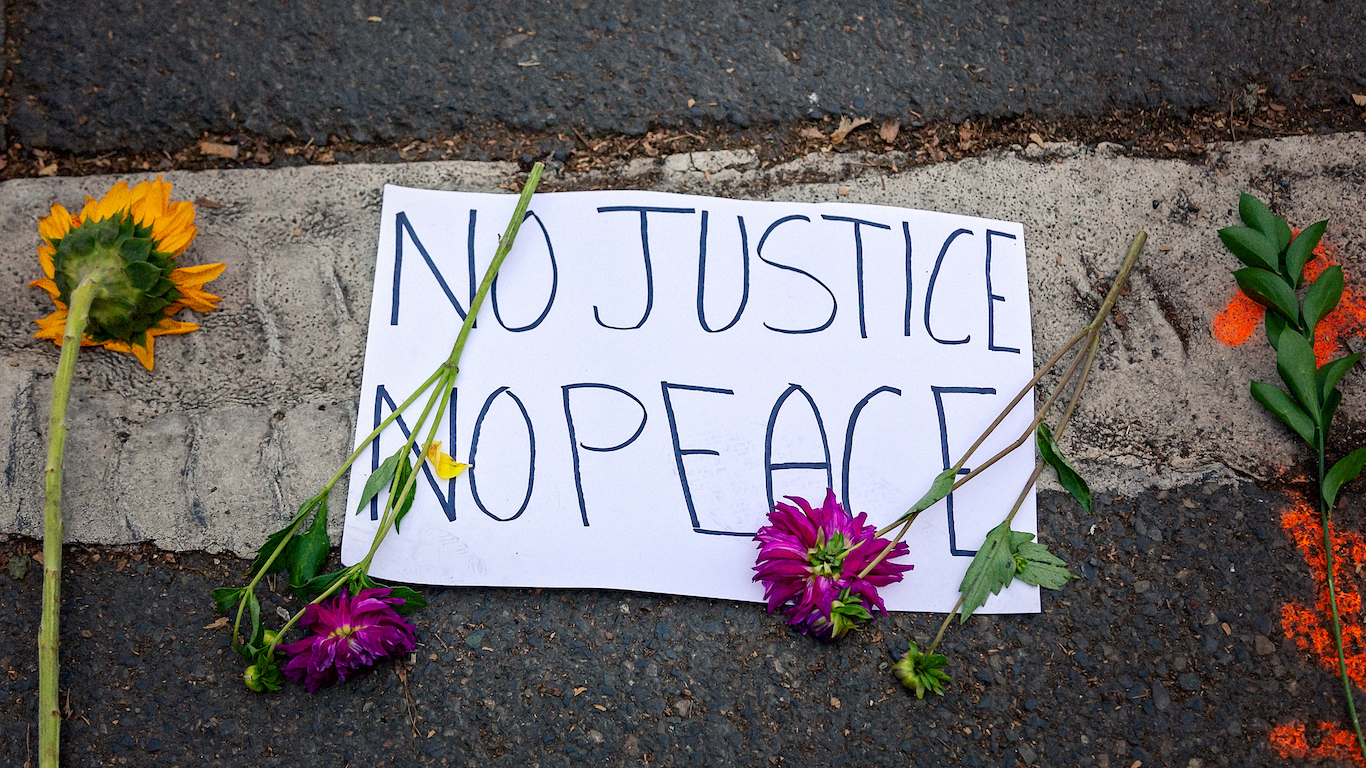
In the nation’s ongoing pursuit of racial equality, 2020 has been a year of reckoning. A series of high-profile police killings of unarmed Black Americans sparked protest demonstrations in over 100 U.S. cities and forced a broad acknowledgment of existing racial inequalities in the United States. And the facts are sobering.
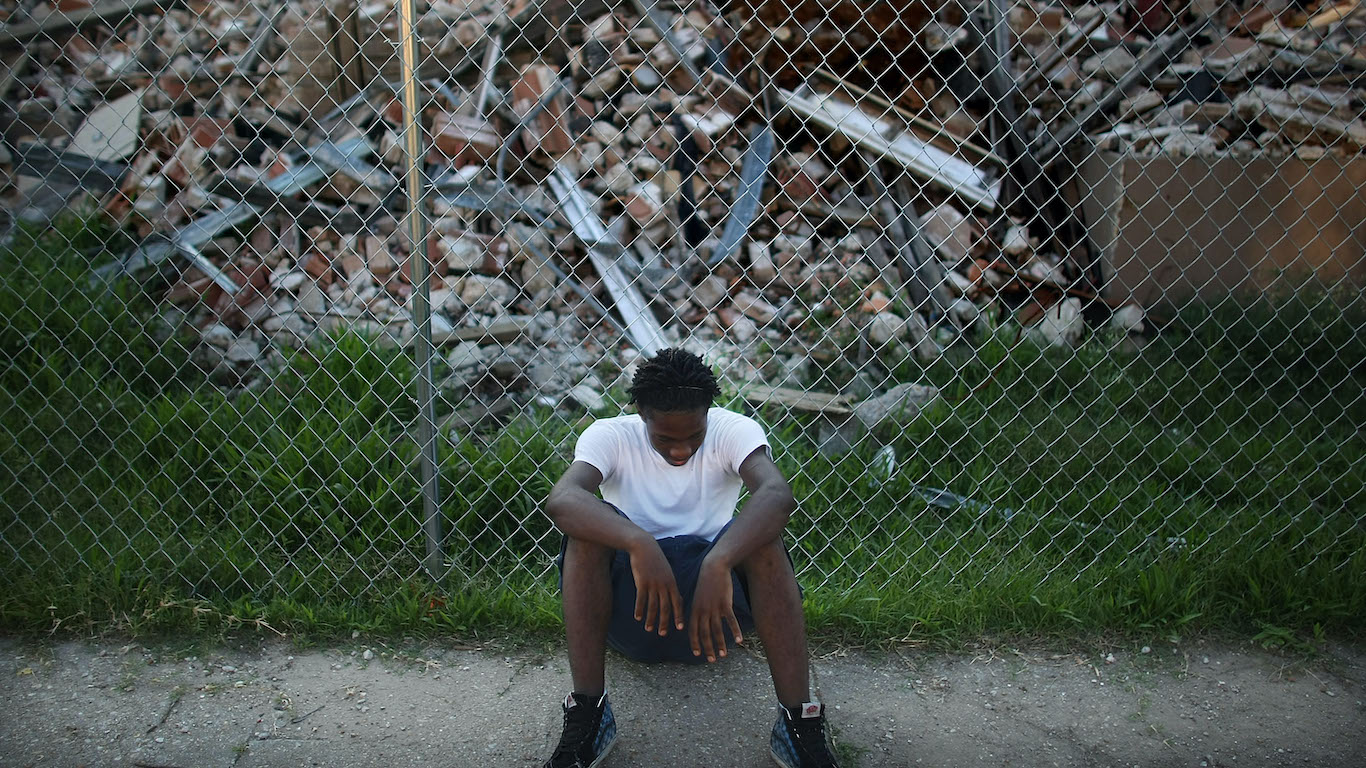
Across the country, Black Americans are more than twice as likely as white Americans to live below the poverty line. In the labor force, Black workers are more than twice as likely as whites to be unemployed. Black people in the U.S. are also far less likely to have a college education or own a home than white Americans. As stark as these disparities are, in some U.S. cities, they are far worse.
Using metro area level data, 24/7 Wall St. created an index measuring racial disparities in income, education, health, incarceration, and other socioeconomic measures to determine the 15 worst cities for Black Americans.
Racial inequalities in the United States are largely a byproduct of institutionalized racism established centuries ago. Many racist policies in the U.S. were legal just decades ago. Still other policies and practices are still in existence and continue to lead to unequal effects of the law on Black and white Americans. In many cities on this list, racist housing covenants forbade Black homeownership in certain neighborhoods. Redlining policies made it difficult for Black families to secure mortgage loans, limiting homeownership opportunities and with it a means of building intergenerational wealth.
Though practices such as these were outlawed in the 1960s (in some places in the ’70s), they were in place long enough to entrench racial segregation. And segregation often results in disparities on multiple fronts, including education, employment opportunities, policing, and access to health care services. The detrimental effects of segregation are evident in every city on this list. Here is a look at the 25 most segregated cities in America.
It is important to note that the cities on this list are those in which the relative differences in social and economic outcomes between white and Black residents are most profound. These are not necessarily the cities where conditions are the worst for Black residents in an absolute sense, as in those places social and economic outcomes tend to be below average for all residents, regardless of race. Here is a look at the worst city to live in in every state.
Click here to see the worst cities for black Americans.
Click here to see our detailed methodology.

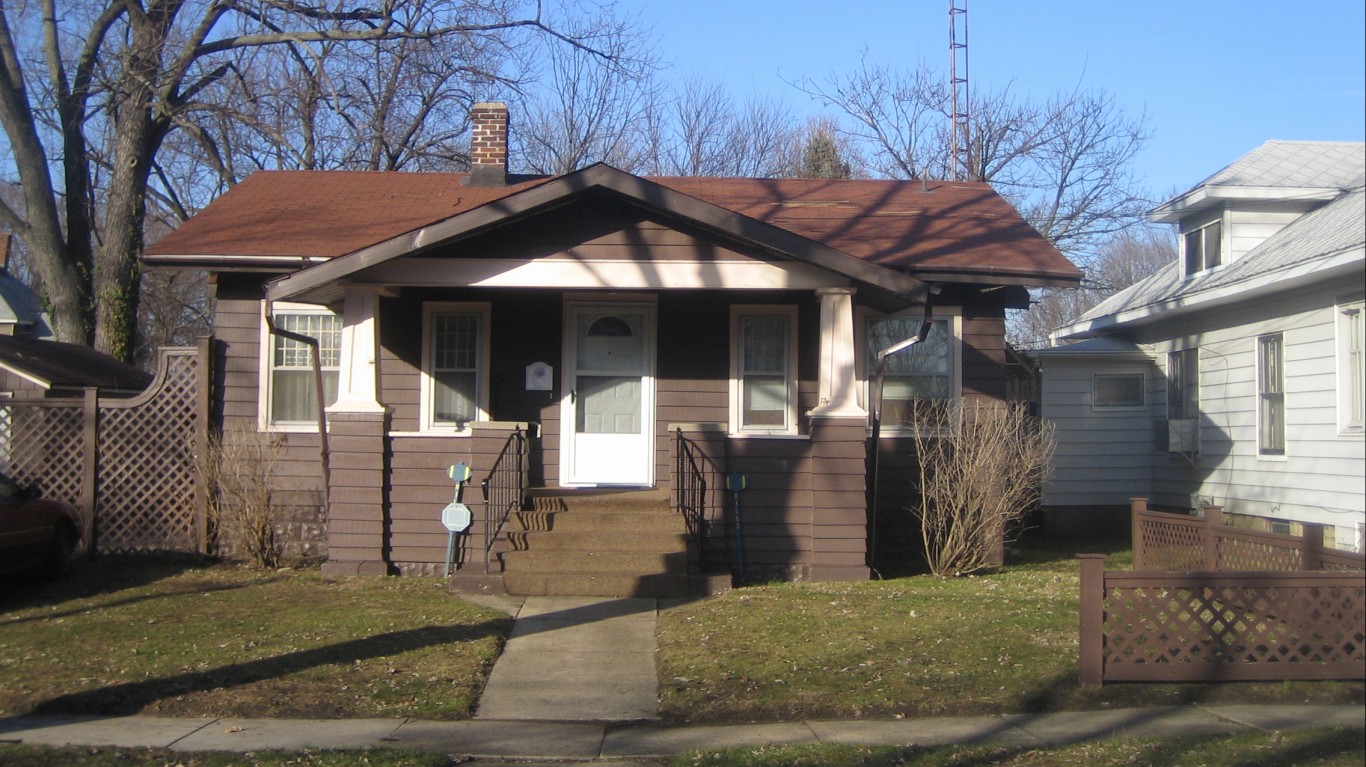
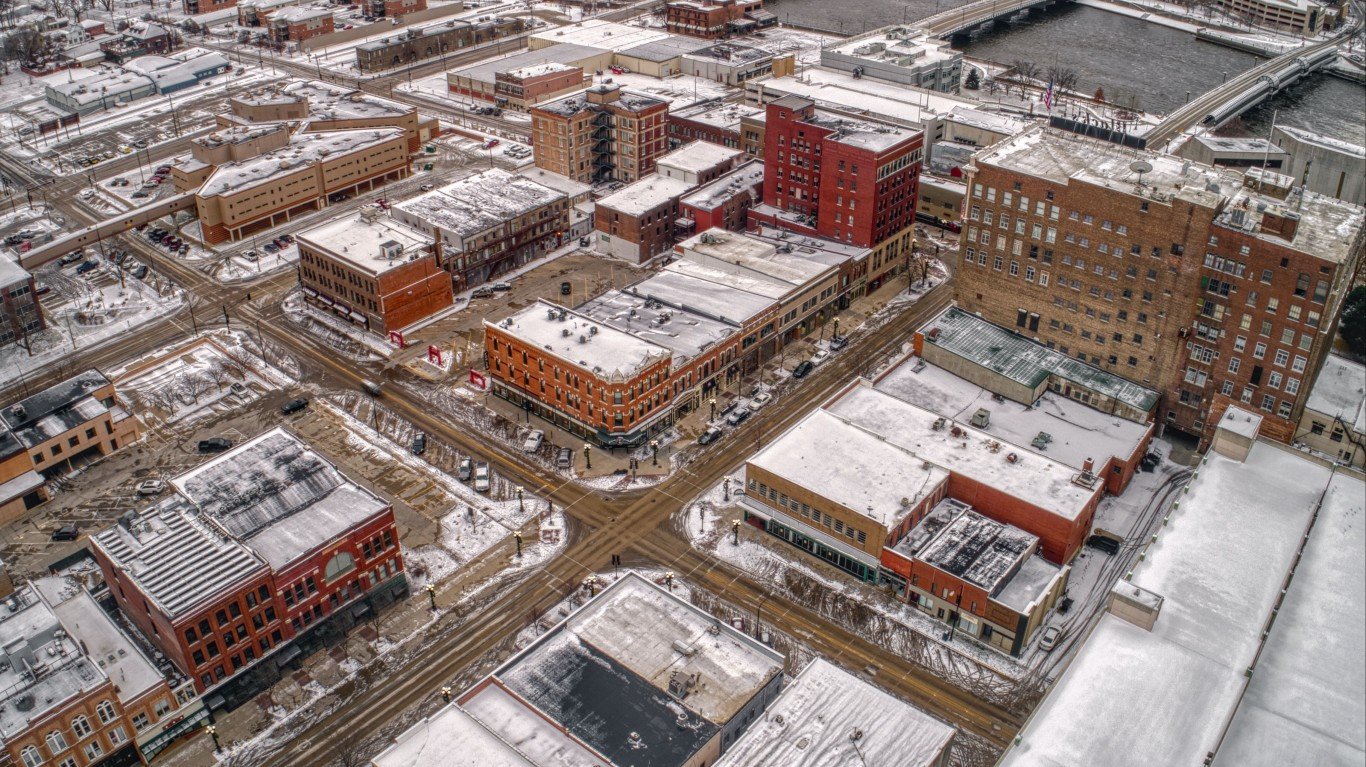
15. Rockford, IL
> Black population: 36,955 (10.9% of total)
> Black median income: $29,969 (51.7% of white income)
> Unemployment: 21.0% (Black); 6.9% (white)
> Homeownership rate: 31.1% (Black); 73.2% (white)
Illinois is home to four of the 15 metro areas with the worst disparities between Black and white residents — and Rockford is one of them. The typical Black household in Rockford earns less than $30,000 a year, while most white households in the area earn more than $58,000 annually.
Homeownership is one of the most practical ways to build intergenerational wealth in the United States, and in Rockford, Black residents have historically faced hurdles to homeownership that white residents have not. The Department of Housing and Urban Development recently reached a $1 million settlement with a local bank that allegedly did not offer mortgage loans in minority neighborhoods. Such practices were widespread in the Midwest in the mid-20th century, and their effects linger today. The Black homeownership rate in Rockford is 31.1% — less than half the white homeownership rate of 73.2%.
[in-text-ad]
14. Erie, PA
> Black population: 18,972 (6.9% of total)
> Black median income: $24,354 (46.3% of white income)
> Unemployment: 14.0% (Black); 5.1% (white)
> Homeownership rate: 28.2% (Black); 69.4% (white)
Erie, a small city in northwestern Pennsylvania, is the only metro area in the state to rank on this list. The poverty rate among the city’s Black population is 38.3% — more than double the 13.6% white poverty rate. The higher likelihood of living in poverty among Black Erie residents is likely due in part to an even greater disparity in job opportunities. Over the last five years, before the COVID-19 recession, Black unemployment in Erie has averaged 14.0% — nearly three times higher than the 5.1% white unemployment rate.
Stark socioeconomic disparities along racial lines are deeply rooted in Erie’s history. Throughout the early and mid-20th century, real estate agencies and zoning laws deliberately excluded Erie’s Black population from residing in affluent, white neighborhoods. As is the case in other cities on this list, these policies led directly to intergenerational disparities in wealth and opportunity along racial lines.
[recirclink id=561780]

13. Davenport-Moline-Rock Island, IA-IL
> Black population: 27,862 (7.3% of total)
> Black median income: $34,155 (58.8% of white income)
> Unemployment: 14.5% (Black); 4.4% (white)
> Homeownership rate: 32.4% (Black); 74.2% (white)
The Davenport-Moline-Rock Island metro area covers parts of both Iowa and Illinois — states that are home to multiple cities on this list. Across the metro area, Black workers are more than three times as likely to be unemployed as white workers — and Black residents are also more than three times as likely to live below the poverty line as white residents.
These starkly disparate outcomes are partially attributable to inequality in education. About 27.2% of white adults in the metro area have a bachelor’s degree or higher, compared to 16.1% of Black adults. Additionally, more than nine in every 10 white adults in the metro area have completed high school compared to fewer than eight in every 10 Black adults.
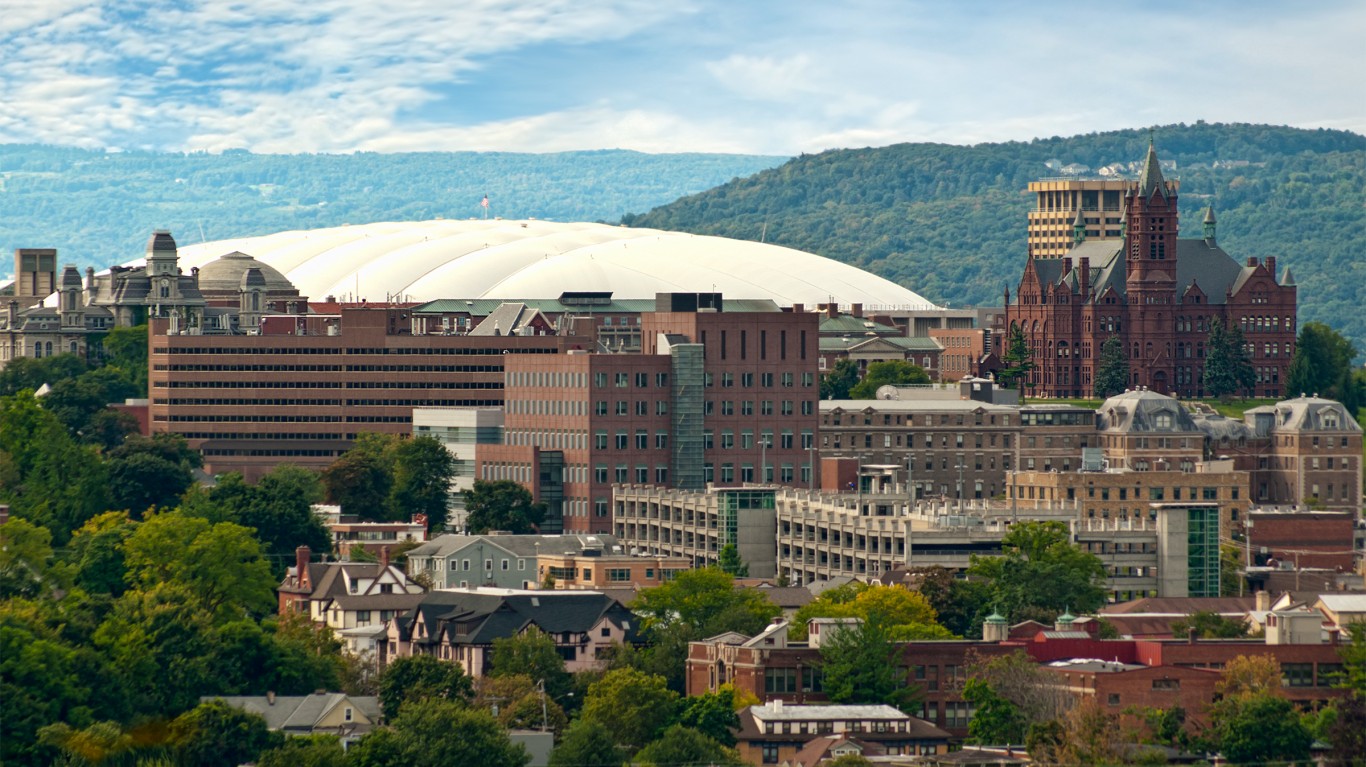
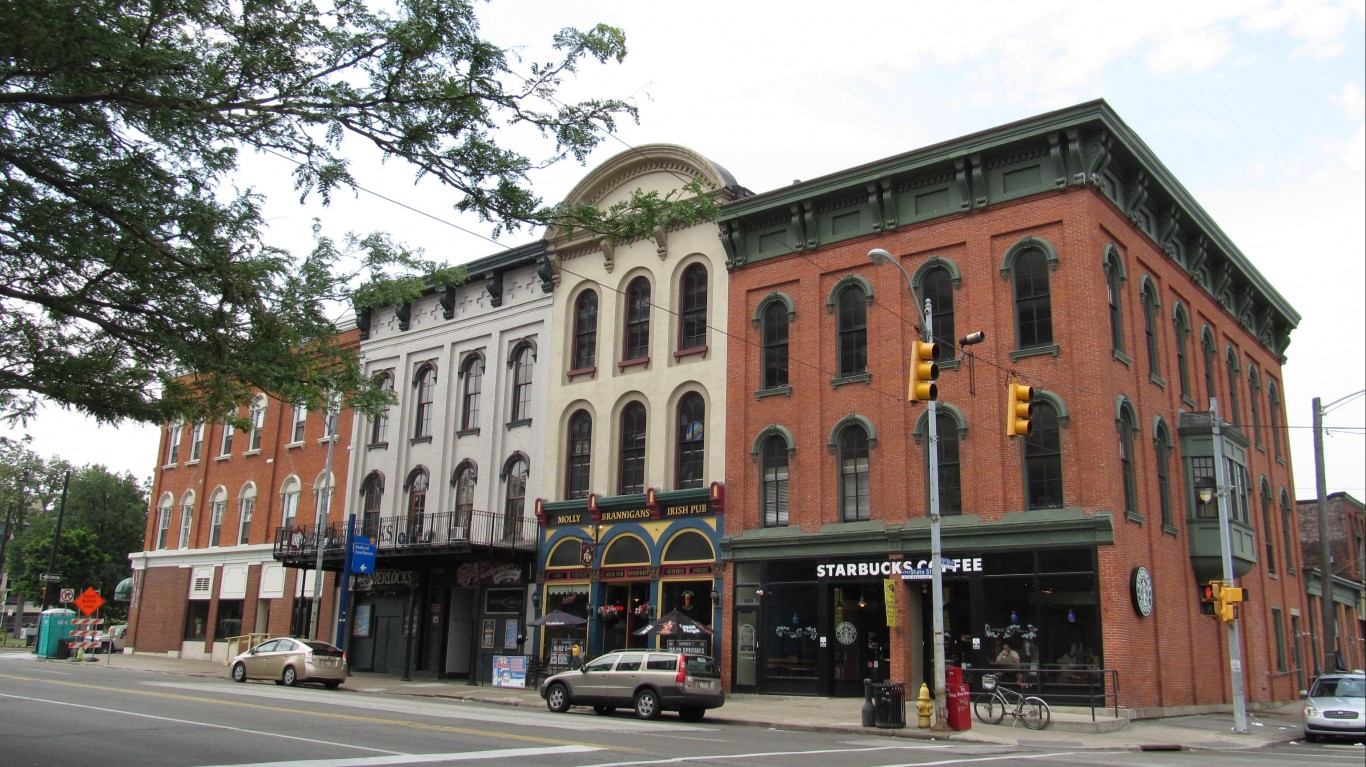
12. Syracuse, NY
> Black population: 52,792 (8.1% of total)
> Black median income: $31,827 (51.5% of white income)
> Unemployment: 15.0% (Black); 5.3% (white)
> Homeownership rate: 28.2% (Black); 72.2% (white)
In Syracuse, New York, Black workers are nearly three times as likely to be unemployed and Black residents are more than three times as likely to live in poverty than their white counterparts.
Along with Erie, Pennsylvania and Rochester, New York, Syracuse is one of only three cities outside of the Midwest to rank on this list. Still, Syracuse shares a similar history to many Midwestern cities, a history that has led to nation-leading racial inequalities. Racist housing policies in the mid-1900s relegated Black residents to certain neighborhoods where they were restricted from accessing federally backed mortgages. These segregated neighborhoods, where homeownership was out of reach for many, became the home of Interstate 81 in the 1950s and ’60s and many argue the highway has had a crippling effect on economic development.
[in-text-ad-2]

11. Des Moines-West Des Moines, IA
> Black population: 31,776 (5.0% of total)
> Black median income: $37,303 (52.5% of white income)
> Unemployment: 9.1% (Black); 3.5% (white)
> Homeownership rate: 31.0% (Black); 72.4% (white)
White residents of the Des Moines metro area are less likely to face serious financial hardship than most white Americans — while Black area residents are far more likely to struggle financially than most Black Americans. Just 8.2% of white Des Moines residents live below the poverty line compared to the 11.6% U.S. white poverty rate. Meanwhile, 27.9% of Black area residents live in poverty compared to the 24.2% national Black poverty rate.
Des Moines is one of several metropolitan areas in Iowa to rank on this list — and socioeconomic disparities along racial lines extend well beyond the borders of these metro areas. Across all of Iowa, the incarceration rate among the Black population is nearly 10 times greater than the white incarceration rate. The nearly 2,400 Black Iowans in federal and state prisons, as well as their families, face considerable economic hurdles — attributable to both lack of income while serving a prison sentence and reduced employment opportunities upon release.

10. Rochester, NY
> Black population: 117,166 (10.9% of total)
> Black median income: $30,146 (48.4% of white income)
> Unemployment: 13.9% (Black); 4.4% (white)
> Homeownership rate: 32.2% (Black); 72.7% (white)
Rochester, New York, ranks as the worst city in the Northeastern United States for Black Americans. The typical Black household in the metro area earns about $30,000 a year. Meanwhile, most white area households earn over $60,000 annually. The lower incomes among Black area residents translate to a greater likelihood of financial insecurity. More than one in every three Black Rochester residents live below the poverty line, compared to only about one in every 10 white residents.
Economic disparities in the metro area are attributable in part to disparate educational outcomes produced by one of the most segregated school systems in the country. The Rochester City School district is about 90% Black, while the neighboring suburban school district is about 90% white. Only about 78% of Black adults in Rochester have a high school diploma, compared to over 90% of white adults in the metro area.
[in-text-ad]
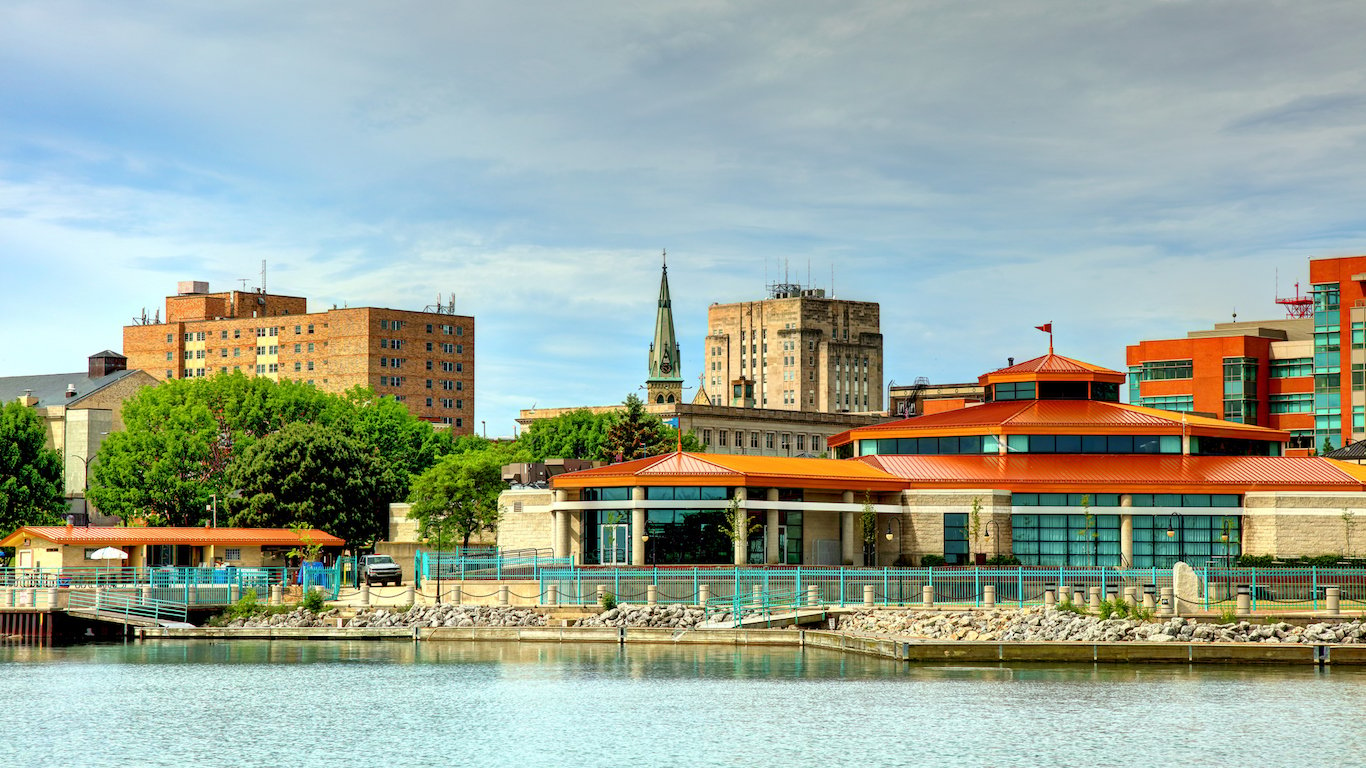
9. Niles-Benton Harbor, MI
> Black population: 22,572 (14.6% of total)
> Black median income: $23,382 (43.4% of white income)
> Unemployment: 15.4% (Black); 4.9% (white)
> Homeownership rate: 35.4% (Black); 76.3% (white)
The Niles-Benton Harbor metro area in southwest Michigan has the worst racial income disparities of any metro area in the state — and the ninth worst of any U.S. metro area. The typical Black household in the metro area earns just $23,382 a year, while most area white households earn over $53,000. The income gap along racial lines is due in part to unequal access to jobs. The Black unemployment rate across Niles-Benton Harbor is 15.4% — more than triple the 4.9% jobless rate among the local white labor force.
Higher-income Americans tend to have better access to health care and can afford a greater range of healthy options related to diet and lifestyle. As a result, higher-income Americans typically report better health outcomes than those with lower incomes. In the Niles-Benton Harbor metro area, low incomes appear to be taking a public health toll in the Black community. The age-adjusted death rate among the local Black population is about 35% higher than it is among the local white population.
[recirclink id=730208]
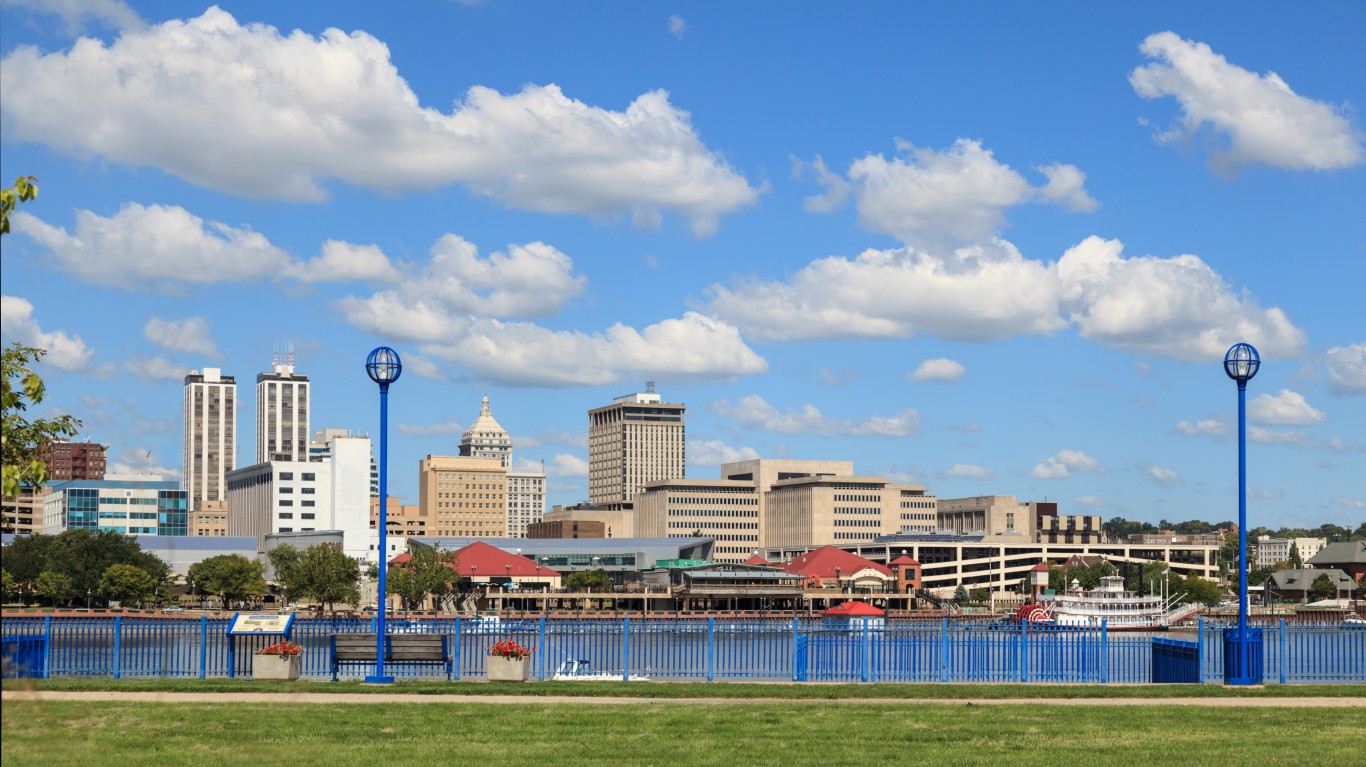
8. Peoria, IL
> Black population: 34,279 (9.2% of total)
> Black median income: $28,300 (46.0% of white income)
> Unemployment: 16.8% (Black); 5.0% (white)
> Homeownership rate: 31.7% (Black); 76.2% (white)
Racial segregation contributes to long-term disparity, and the legacy of redlining has made Peoria, Illinois, one of the most segregated cities in the United States. Redlining effectively made it impossible for many Black Americans to secure a mortgage loan in the early and mid-1900s, leading to a low Black homeownership rate — and limiting intergenerational wealth building opportunities with it.
In Peoria, the Black homeownership rate stands at 31.7%, less than half the 76.2% white homeownership rate. Opportunities to build wealth are further limited in Peoria’s Black community by high unemployment. Over the last five years, before the COVID-19 recession, an average of 16.8% of the local Black labor force was unemployed, more than triple the 5.0% white unemployment rate. Partially as a result, Black Peoria residents are more than three times as likely as white residents to live below the poverty line.

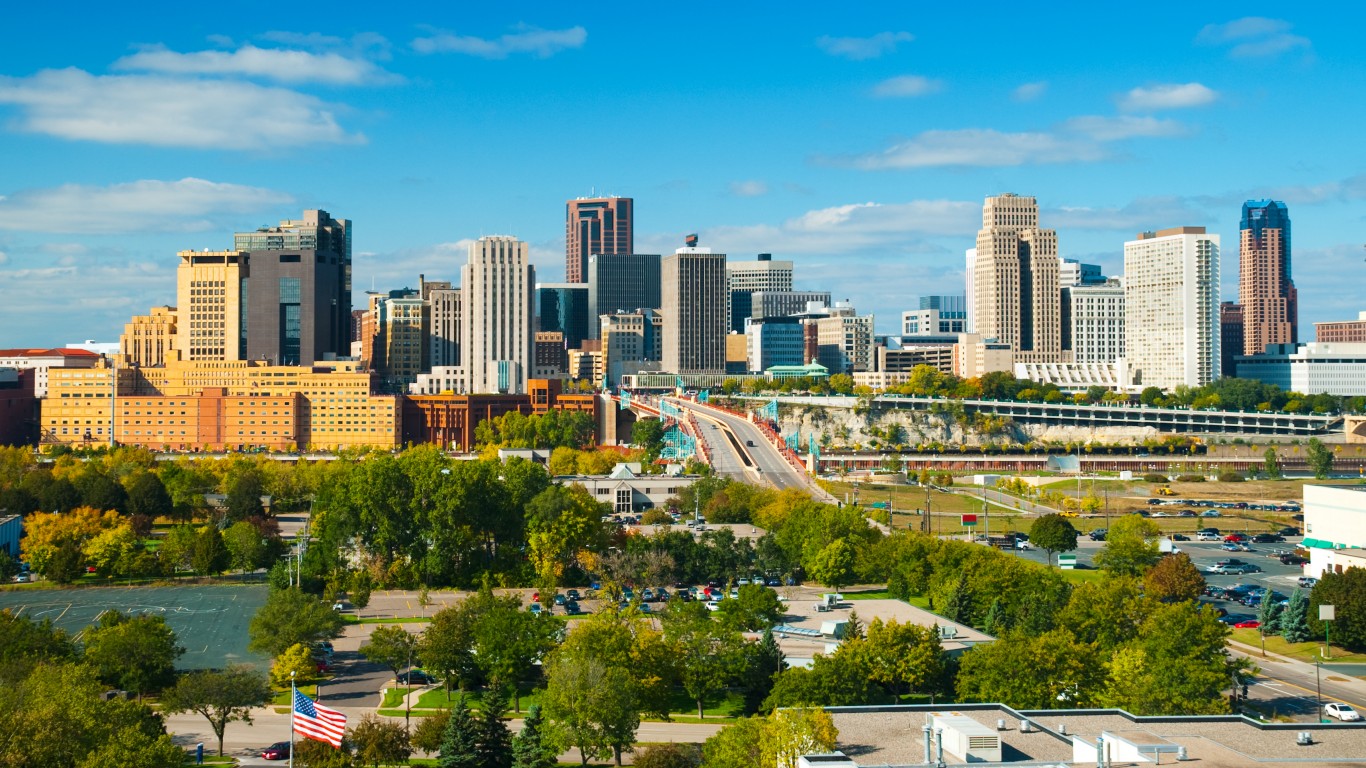
7. Minneapolis-St. Paul-Bloomington, MN-WI
> Black population: 290,210 (8.2% of total)
> Black median income: $36,127 (44.0% of white income)
> Unemployment: 9.2% (Black); 3.2% (white)
> Homeownership rate: 25.2% (Black); 75.5% (white)
While white residents of the Twin Cities metro area are financially better off than white Americans nationwide, the area’s Black population is worse off than the Black population nationwide and of course compared to the metro area’s white residents.
For example, the Black poverty rate of 28.3% in the metro area is well above the 24.2% national Black poverty rate. Meanwhile, just 5.9% of white residents in Minneapolis-St. Paul live below the poverty line compared to 11.6% of all white Americans. Similarly, the typical Black household in the area earns just $36,127 a year — about $4,000 below the median income among Black households nationwide. In contrast, the median income among white area households is $82,118, or about $18,000 more than the national median.
[in-text-ad-2]
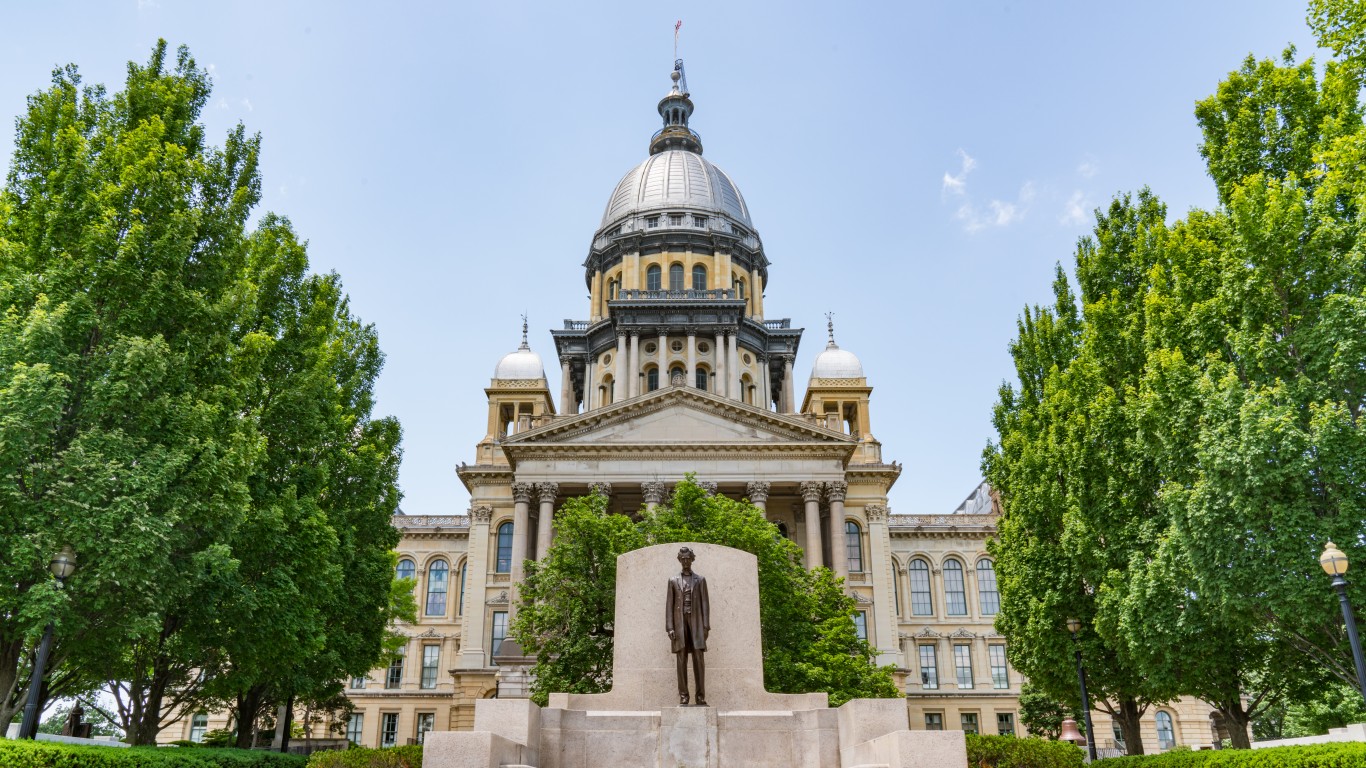
6. Springfield, IL
> Black population: 24,959 (11.9% of total)
> Black median income: $26,573 (40.5% of white income)
> Unemployment: 16.2% (Black); 4.8% (white)
> Homeownership rate: 29.2% (Black); 75.2% (white)
Springfield, Illinois, is home to some of the worst income inequality along racial lines in the United States. The typical Black household in Illinois’ capital city earns just $26,573 a year. Meanwhile, the typical white household earns $65,650 a year. Additionally, the Black poverty rate in the metro area of 40.9% is about four times greater than the 10.7% white poverty rate.
Higher-income Americans tend to have better access to health care and can afford a greater range of healthy options related to diet and lifestyle. Typically, higher-income Americans report better health outcomes than lower-income Americans. In Springfield, the low incomes appear to be taking a public health toll in the Black community. The age-adjusted death rate among the local Black population is about 21% higher than the rate among the local white population.
5. Waterloo-Cedar Falls, IA
> Black population: 12,347 (7.3% of total)
> Black median income: $28,671 (49.1% of white income)
> Unemployment: 16.0% (Black); 3.4% (white)
> Homeownership rate: 34.2% (Black); 72.4% (white)
The Waterloo-Cedar Falls metro area has the worst racial income disparities of any metro area in Iowa and the fifth worst of any metro area nationwide. Black workers are far more likely to struggle to find a job than their white counterparts, as over the last five years, Black unemployment has been more than four times higher than the white unemployment rate, on average. Such disparity in employment opportunities has pronounced financial consequences. The median income among white households in the area is more than double the median income among Black households.
Across Waterloo-Cedar Falls, and the rest of Iowa, disproportionate incarceration rates further exacerbate economic inequality along racial lines. Black Iowans are about 10 times more likely to be incarcerated than white Iowans.
[in-text-ad]

4. Danville, IL
> Black population: 10,885 (13.9% of total)
> Black median income: $22,419 (45.2% of white income)
> Unemployment: 19.7% (Black); 5.9% (white)
> Homeownership rate: 29.5% (Black); 75.2% (white)
Danville, Illinois, located near the state’s eastern border with Indiana, has some of the worst racial disparities of any city in the United States. Like many cities on this list, Danville is among the most segregated places in the country — and over the last several decades, it has made little progress toward integration.
Segregation can exacerbate inequality, and in Danville, the typical Black household earns just $22,419 a year — less than half the median income among white households of $49,592. Economic inequality is further evidenced by the poverty rate in Danville, as nearly half of all Black residents live below the poverty line compared to 15.0% of white residents. Incomes tend to rise with educational attainment, and less than 5% of Black adults in the metro area have a bachelor’s degree, while 16.1% of the white adults do.
[recirclink id=822874]
3. Racine, WI
> Black population: 21,257 (10.9% of total)
> Black median income: $26,512 (39.9% of white income)
> Unemployment: 10.7% (Black); 4.2% (white)
> Homeownership rate: 27.2% (Black); 74.2% (white)
Few U.S. metro areas have a worse income gap along racial lines than Racine, Wisconsin. The typical Black household in the area earns just $26,512 a year, about $40,000 less than what the typical white household earns. Incomes tend to rise with educational attainment, and in Racine, fewer than one in every 10 Black adults have a four-year college degree, compared to more than one in four white area adults.
Racine is one of two Wisconsin metropolitan areas to rank on this list — and socioeconomic disparities along racial lines extend well beyond their borders. Across all of Wisconsin, the incarceration rate among the Black population is 12 times greater than incarceration rate among the white population. The more than 10,000 Black Wisconsin residents in federal and state prisons, as well as their families, face considerable economic hurdles — attributable to both lack of income while serving their sentence and reduced employment opportunities upon release.
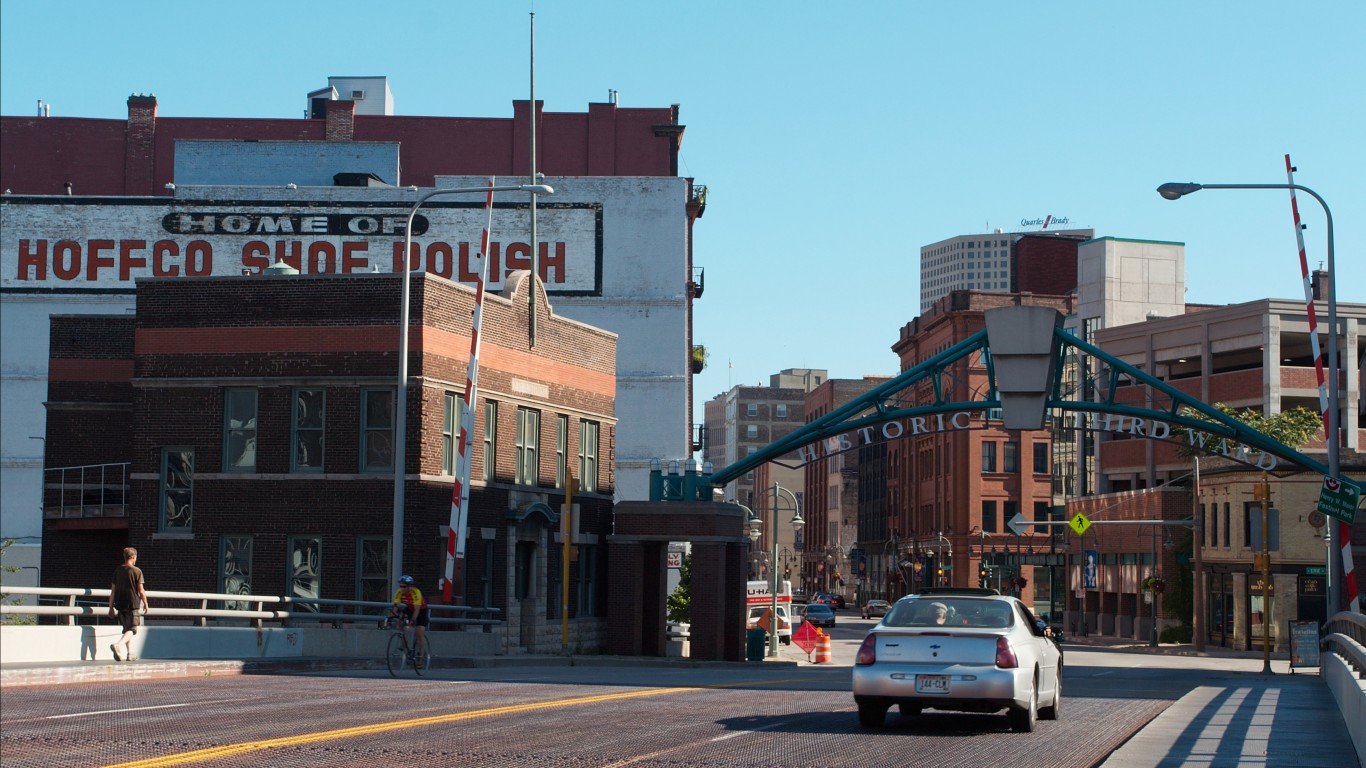
2. Milwaukee-Waukesha-West Allis, WI
> Black population: 258,081 (16.4% of total)
> Black median income: $29,655 (43.1% of white income)
> Unemployment: 12.1% (Black); 3.3% (white)
> Homeownership rate: 27.4% (Black); 68.5% (white)
Over a third of Black residents in the Milwaukee-Waukesha-West Allis metro area live below the poverty line, compared to less than one in every 10 white metro area residents and less one-quarter of the Black population nationwide. Additionally, most Black households in the area earn less than $30,000 a year, about $39,000 less than the median income among white area households and $10,000 less than the median household income among Black households nationwide.
Like other cities on this list, racial disparities that are evident in Milwaukee today have roots in racist housing policies of the previous century. In addition to redlining, which made it difficult for many Black residents to secure mortgage loans, neighborhood-specific housing covenants explicitly forbade the sale or rental of real estate to anyone who was not white. Such policies entrenched inequality along racial lines on multiple fronts, including education, employment opportunities, policing, and access to health care services.
[in-text-ad-2]
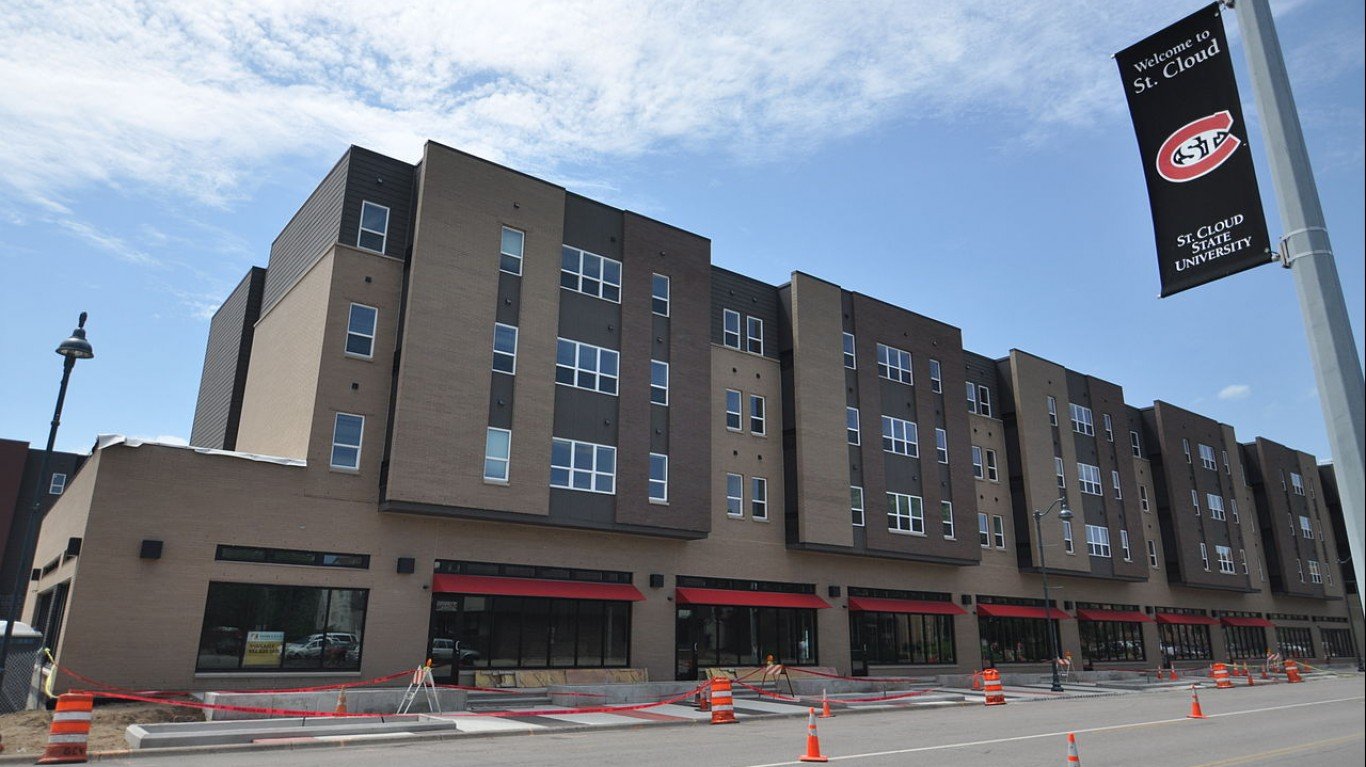
1. St. Cloud, MN
> Black population: 10,370 (5.3% of total)
> Black median income: $23,790 (38.2% of white income)
> Unemployment: 17.4% (Black); 3.7% (white)
> Homeownership rate: 9.3% (Black); 72.4% (white)
St. Cloud, Minnesota, has the worst socioeconomic disparities along racial lines of any U.S. metro area. Homeownership is a practical way to build intergenerational wealth, and in St. Cloud, the Black homeownership rate is just 9.3%, compared to the 72.4% white homeownership rate. Differences in income are also pronounced. The typical Black household earns just $23,790 a year, while most white households earn over $62,000 annually. Also, Black St. Cloud workers are nearly five times more likely to be unemployed and Black residents are five times more likely to live below the poverty line than their white counterparts.
Many of St. Cloud’s Black residents are newly settled immigrants and refugees. Over the last three decades, the city has seen an influx of new residents from East Africa.
Methodology
To determine the 15 worst cities for Black Americans, 24/7 Wall St. created an index of eight variables measuring racial socioeconomic gaps in each of the nation’s 383 metropolitan areas. For each city we evaluated the gap between white and Black residents in poverty, education, income, homeownership, unemployment, mortality, and incarceration.
Creating the index in this way means cities were ranked on relative differences between Black and white residents, and not on absolute levels of socioeconomic development — which, if used instead for the ranking, would result in a list of cities with the worst social and economic measures for anyone regardless of their race.
For each measure, we constructed an index of the gaps between Black and white Americans. The index was standardized using interdecile normalization so outliers in the data did not skew results.
We excluded metro areas where Black residents comprise less than 5% of the population or where data limitations made comparisons between racial groups impossible.
Within the index, we considered data from the U.S. Census Bureau’s 2018 American Community Survey on median household income, poverty, adult high school and bachelor’s degree attainment, homeownership, and unemployment for each racial group. All ACS data are five-year estimates for 2018.
Data on the number of prisoners in state or federal correctional facilities by race are for 2019 and came from the Bureau of Justice Statistics. These statistics were adjusted for population using ACS data. Because states, rather than metro areas, are responsible for the prison population, incarceration rates are for the state where the metro area is located. If a metro area spans more than one state, we used the state in which the metro area’s principal city is located.
We also included age-adjusted mortality rates for the years 2016 to 2018 from the Centers For Disease Control and Prevention. We aggregated mortality rates from the county to the metropolitan level using boundary definitions from the Census Bureau. Incarceration and mortality rates are per 100,000 residents.
Contact [email protected] for any questions or corrections.