As the COVID-19 pandemic stretches into its second year, Americans are still feeling the effects the pandemic has had on all aspects of life. In addition to the health risks, the virus has in some cases made food production more difficult and more expensive. Consumer demands for certain types of food shifted quickly, and companies struggled to keep up with demand, especially as the food supply chain was often interrupted.
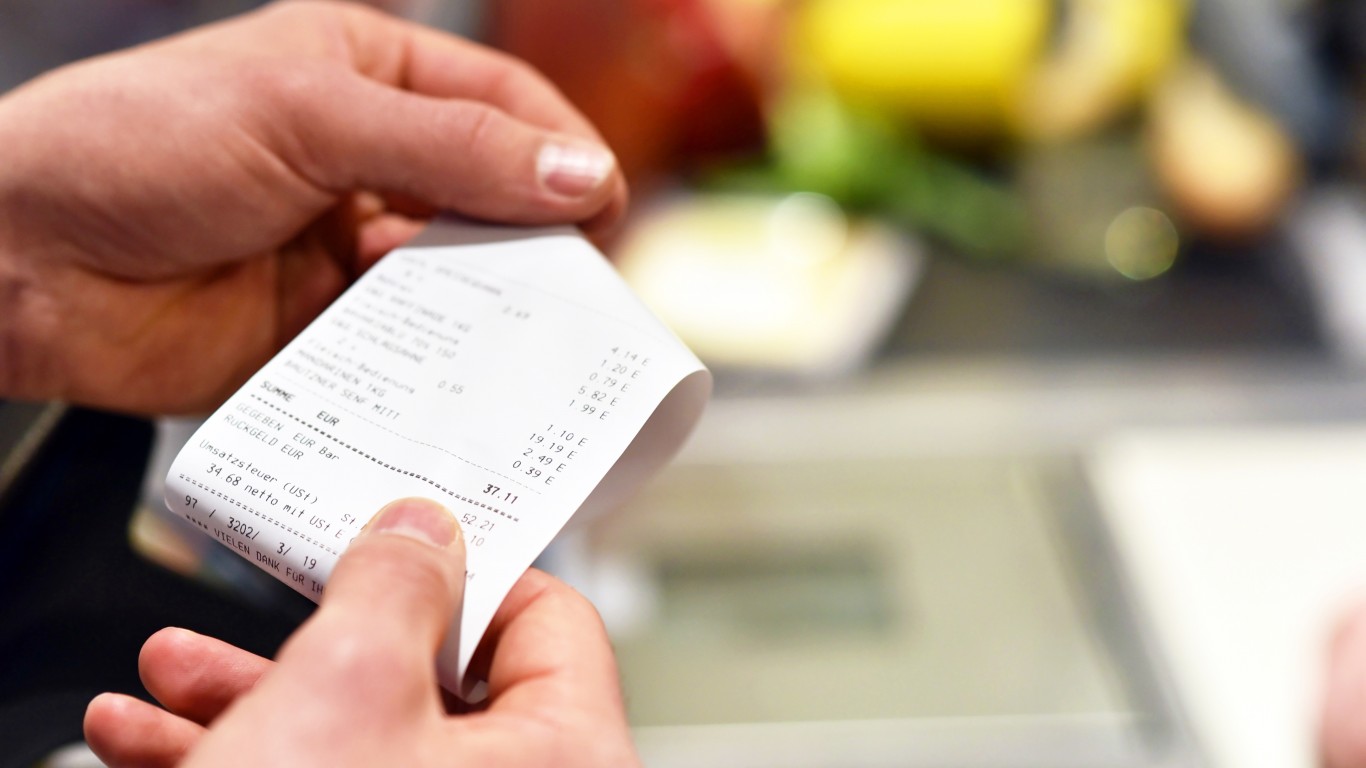
While the prices of grocery store items increased across the board from the beginning of 2020 to the beginning of 2021, many types of food reported increases that were several times higher.
To determine the groceries driving up your food bill the most during the pandemic, 24/7 Wall St. reviewed the change in the consumer price index from the Bureau of Labor Statistics for all categories of food from January 2020 to January 2021.
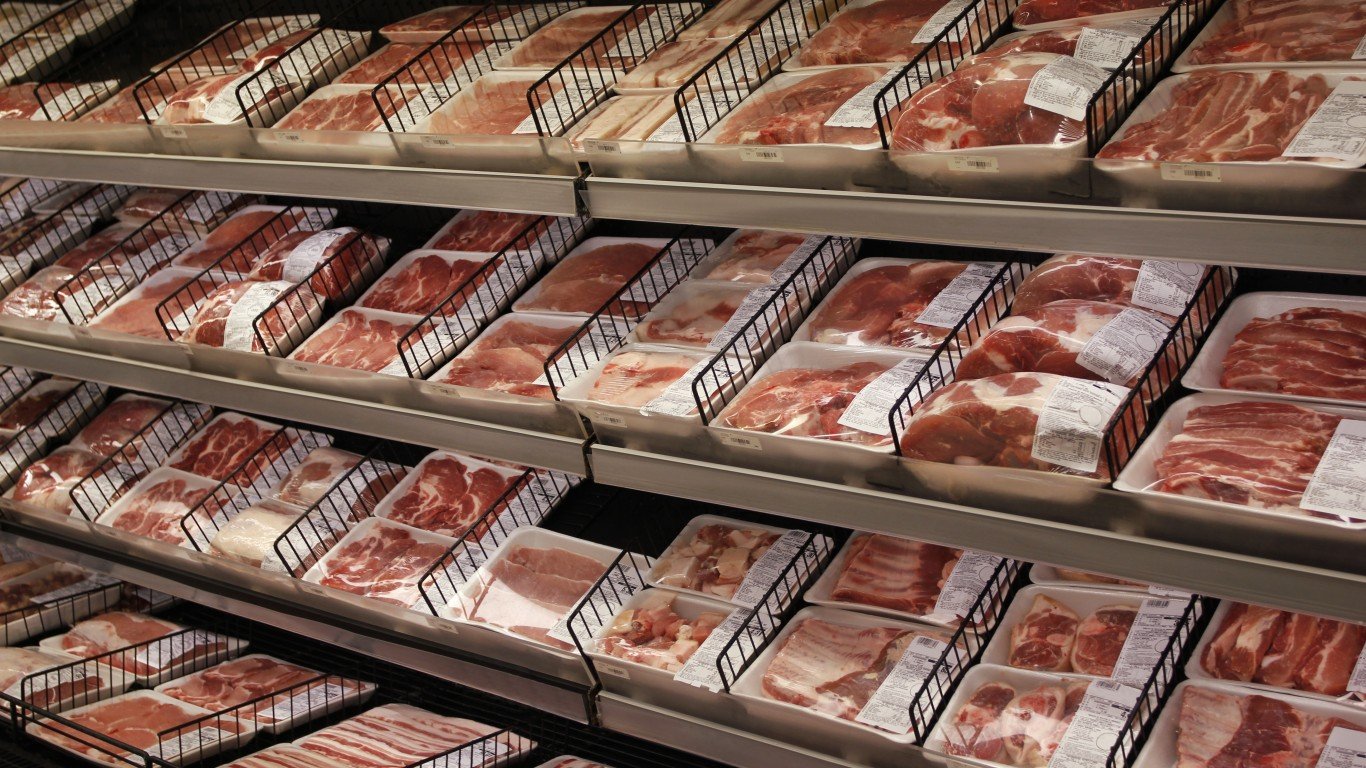
In the early days of the COVID-19 pandemic, as more states issued stay-at-home orders, Americans rushed to grocery stores to buy shelf-stable products, stocking up in case food became difficult to find or less accessible if the pandemic worsened. Lockdown orders also shifted consumer behavior with Americans cooking at home more. Shoppers also purchased proteins like meats — especially those that could be frozen and saved for an extended period of time.
These products became more expensive as demand increased and supply chains were impacted. Meat processing plants were frequently shut down due to COVID-19 outbreaks at the plant.
With food prices rising and millions of workers losing their jobs, many Americans have struggled to afford even the basic necessities throughout 2020. An increasingly large number of Americans turned to federal government’s programs like the Supplemental Nutrition Assistance Program and the Special Supplemental Nutrition Program for Women, Infants, and Children. These are the states where government food assistance is spiking.
Click here to see the 20 groceries driving up your food bill the most during the pandemic.
Click here to see our methodology.
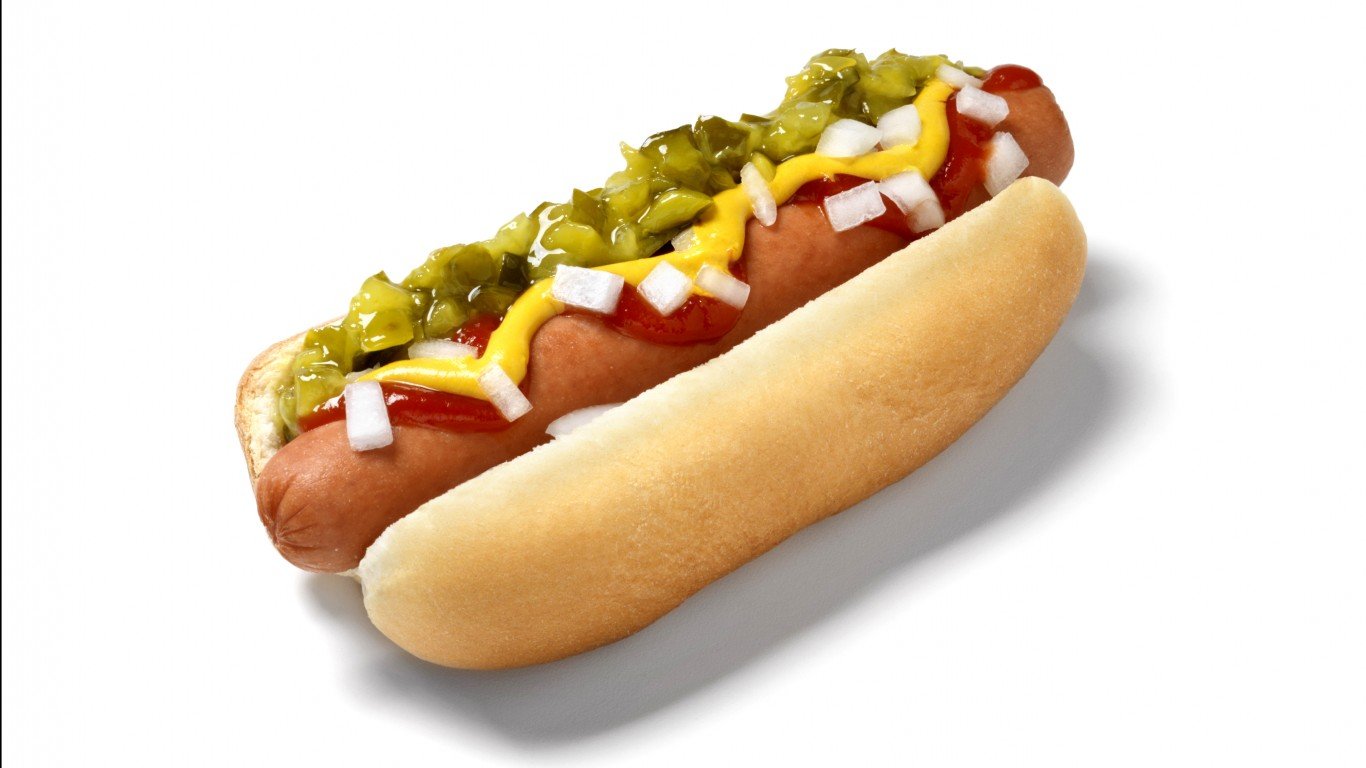
20. Frankfurters
> One year price increase: +4.4%
Frankfurters, a thin type of sausage, have had one of the largest price increases at American grocery stores from January 2020 to January 2021, at 4.4%. For context, all food items increased in price by 1.4% during that time.
[in-text-ad]
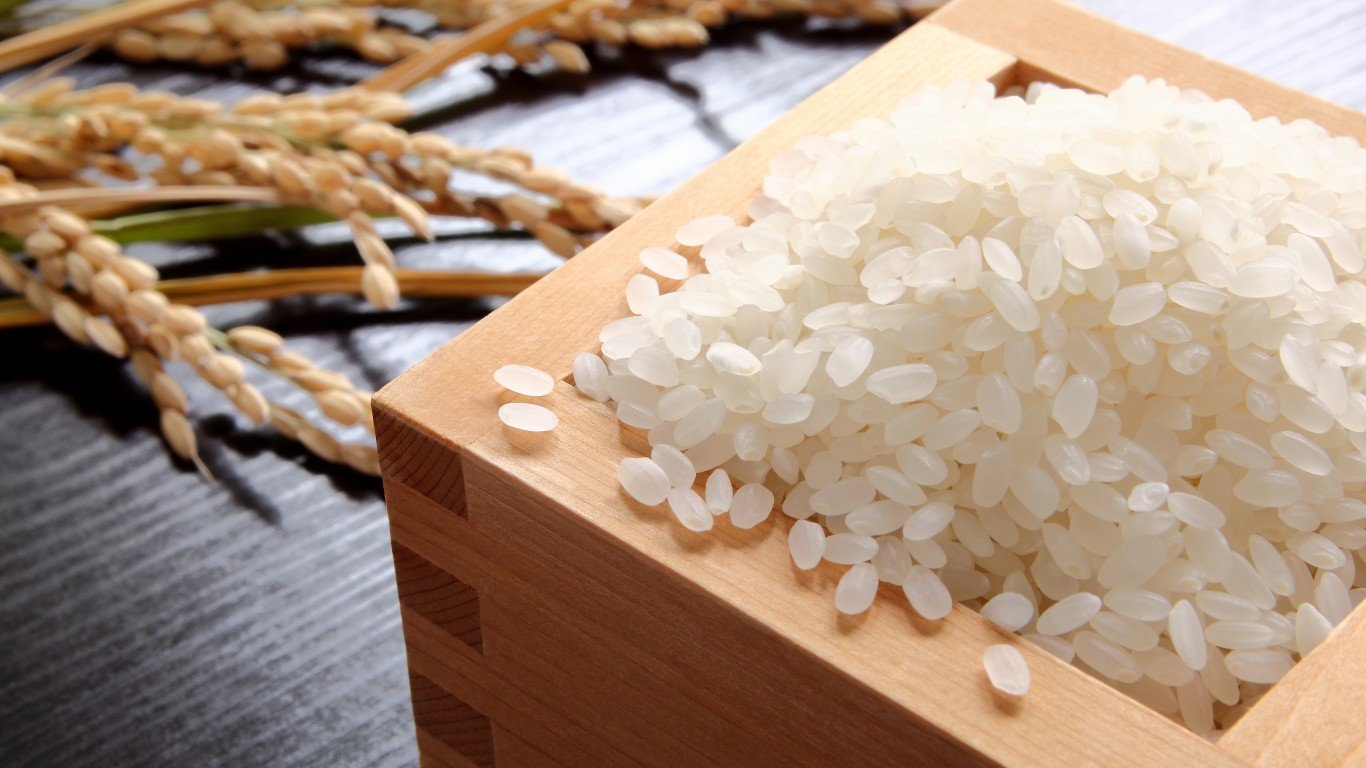
19. Rice
> One year price increase: +4.4%
Across American grocery stores, the price of rice had been in decline throughout 2019. Rice cost about 2.1% less in January 2020 than it did a year earlier. But as a growing number of consumers sought shelf-stable products like rice, prices grew rapidly, especially between March and April of 2020.
[recirclink id=829058]
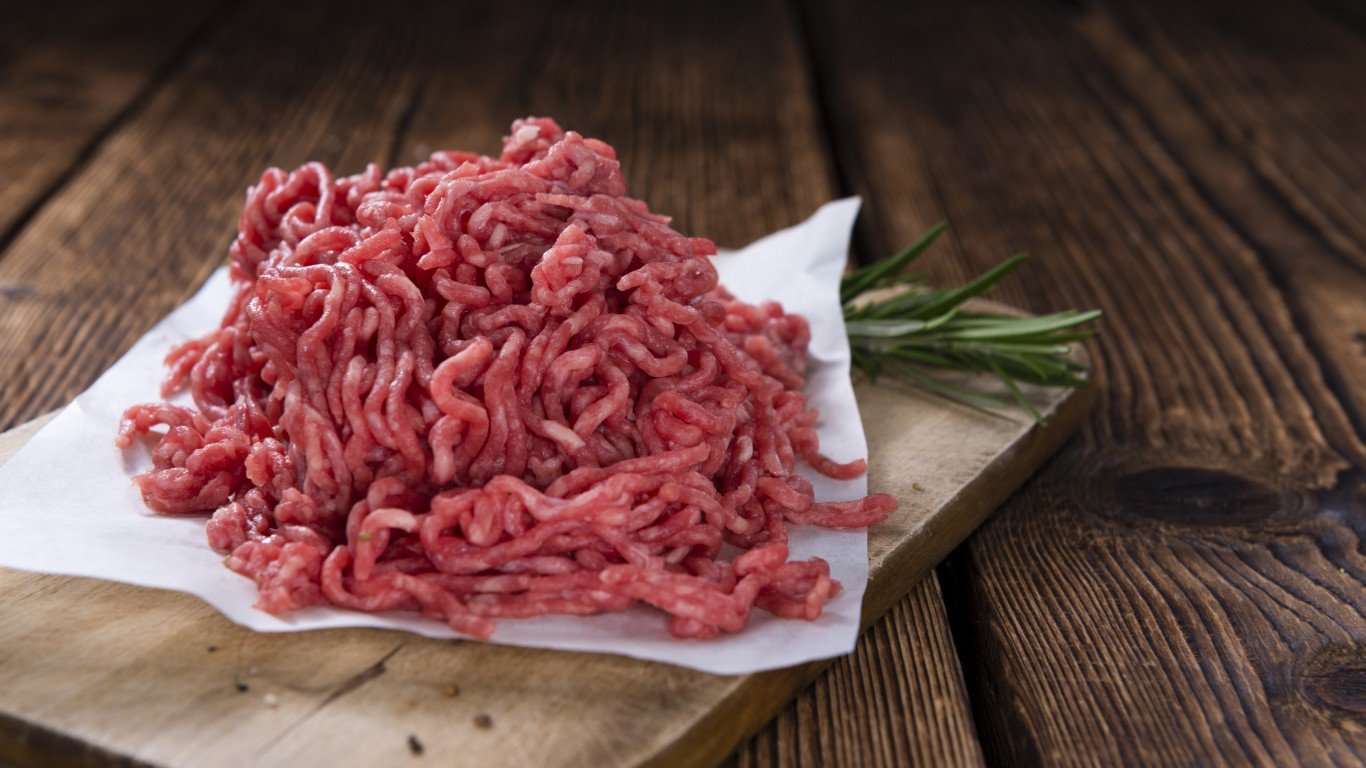
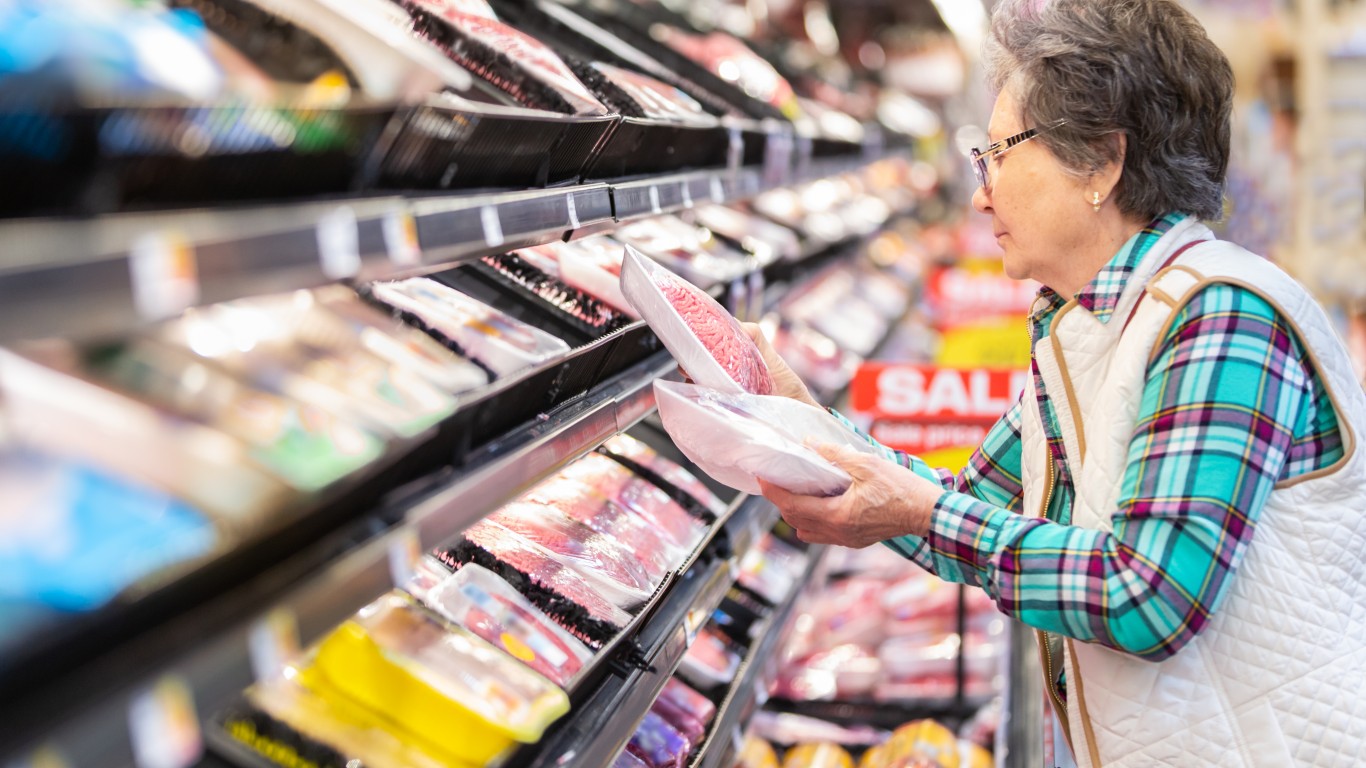
18. Uncooked ground beef
> One year price increase: +4.4%
Of the 20 grocery items that increased in price the most from January 2020 to January 2021, 10 are meat products, like uncooked ground beef, poultry, or fish products. Meat prices spiked as demand increased — due to both households stocking meat over pandemic concerns and more people cooking at home — while supply chains were interrupted by outbreaks in meat plants.
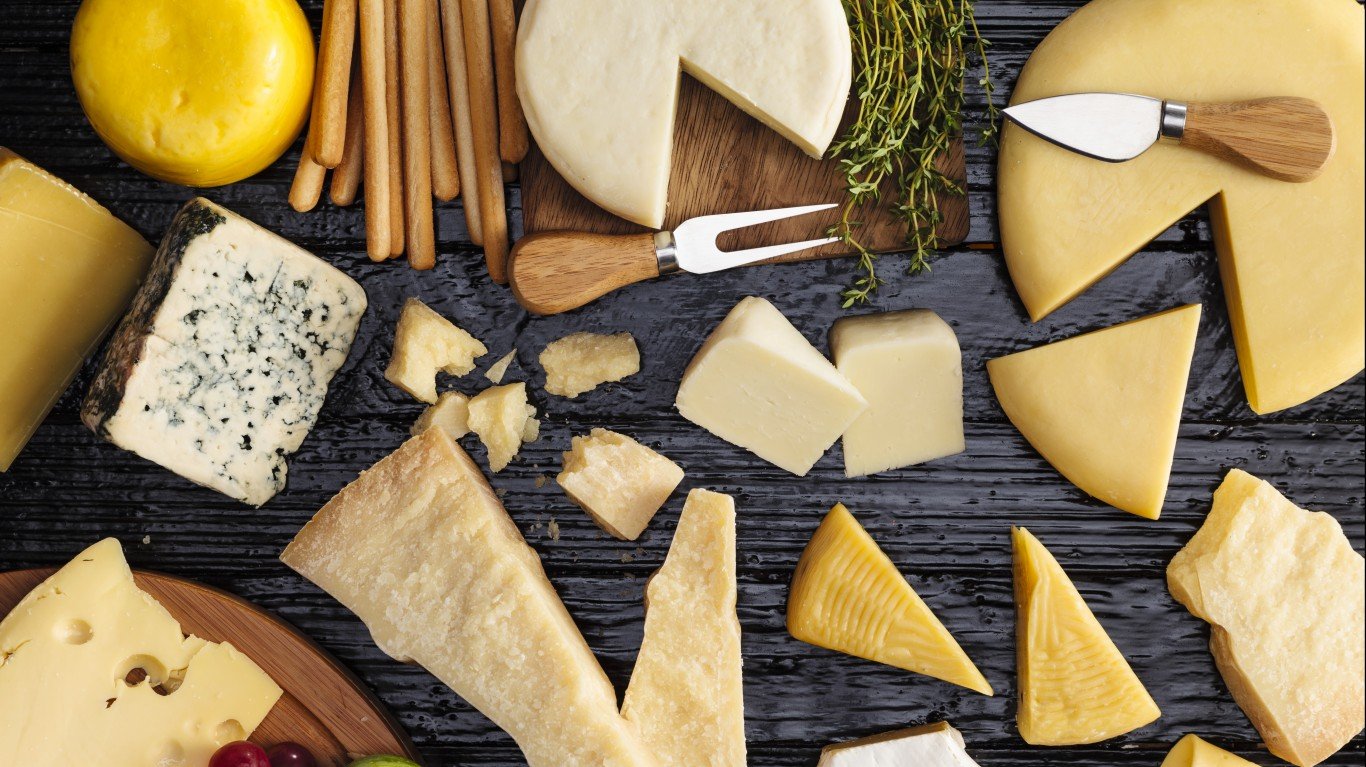
17. Cheese and related products
> One year price increase: +4.5%
Though the COVID-19 pandemic undoubtedly had at least some effect on the U.S. cheese supply, the increase in cheese prices from January 2020 to January 2021 seems more a continuation of a trend. Through 2020, cheese prices grew by 3.5%.
[in-text-ad-2]
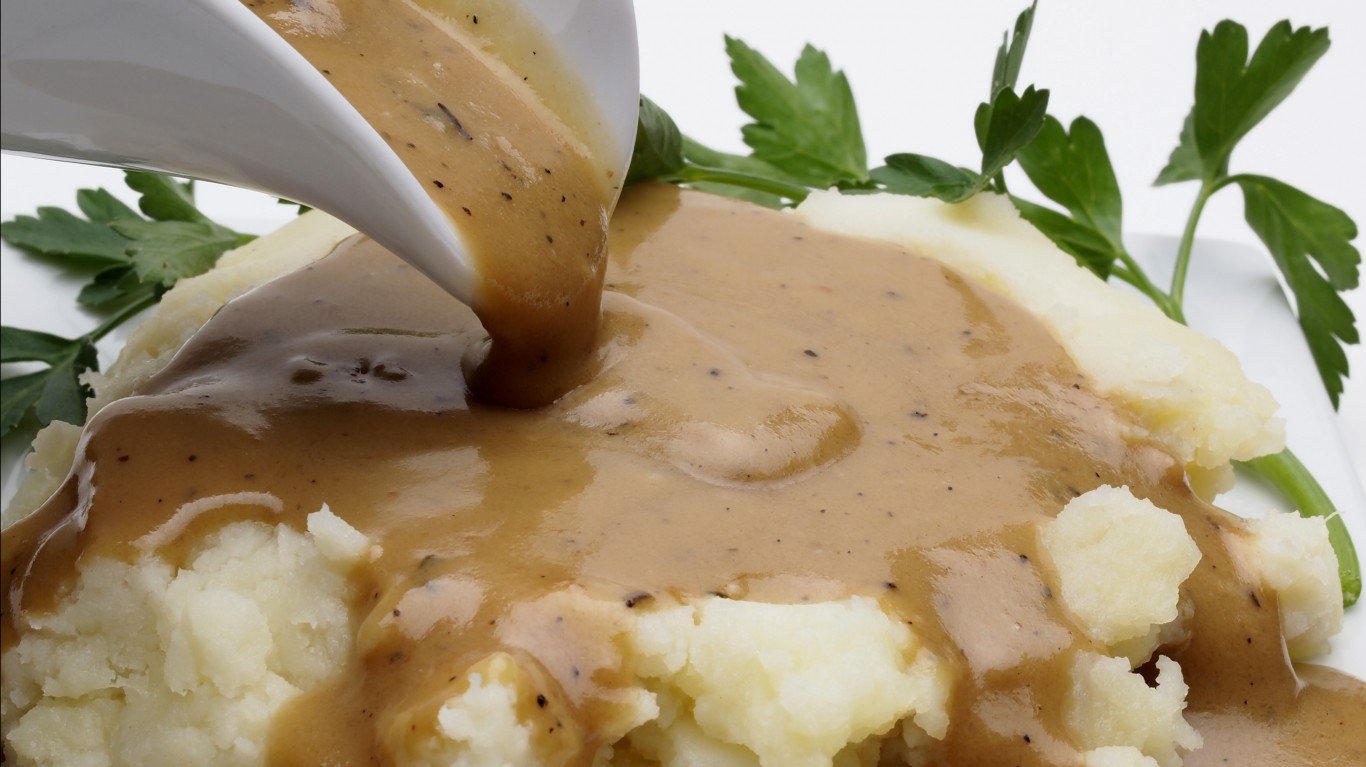
16. Sauces and gravies
> One year price increase: +4.7%
In the year-long stretch before the COVID-19 pandemic altered our lives — from February 2019 through February 2020 — the price of sauces and gravies had actually declined slightly. Amid the pandemic, the overall price of this food segment grew significantly, peaking in October before starting to decline. Stll, in January 2021, prices of sauces and gravies were 4.7% higher than they were a year earlier.
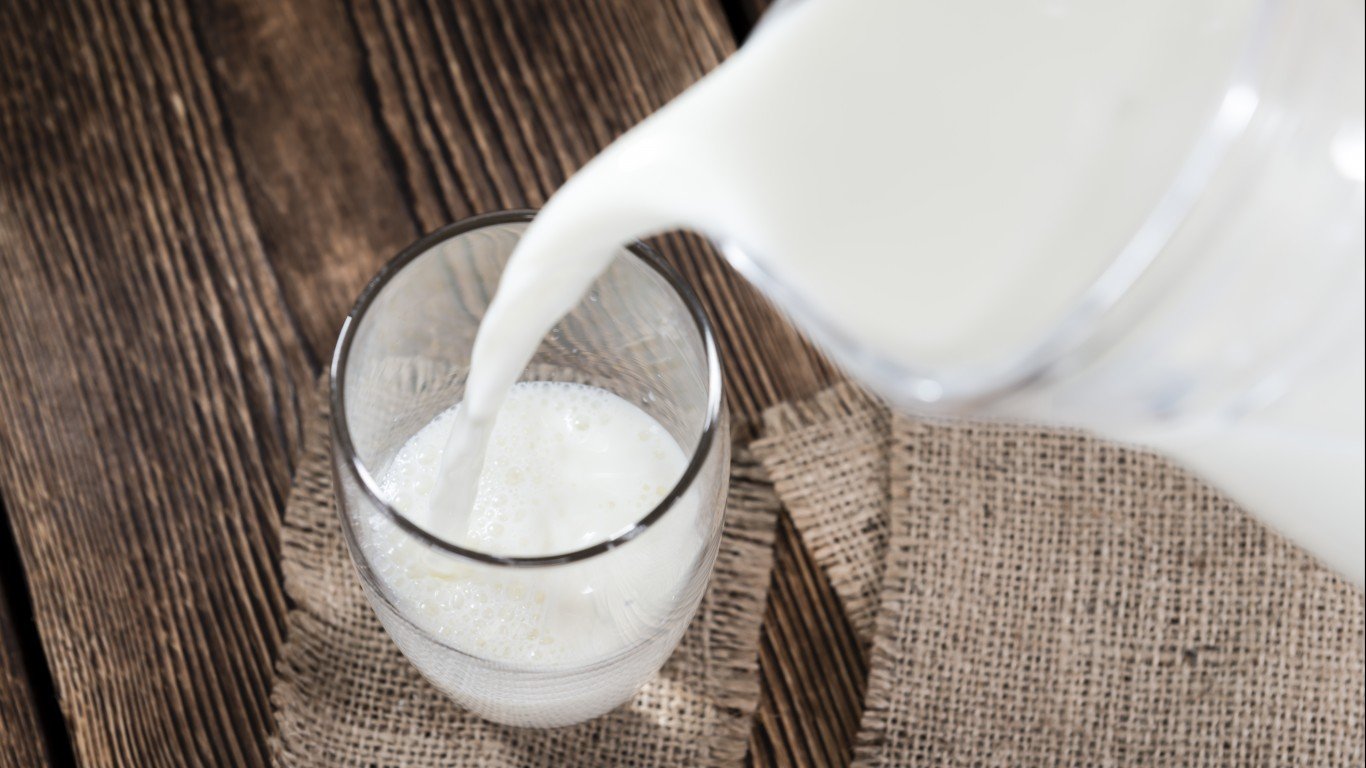
15. Fresh whole milk
> One year price increase: +4.7%
The price of fresh whole milk was initially in decline when COVID-19 hit. Dairy farmers were forced to dump their supply because of falling demand as major milk consumers like schools and restaurants were shuttered. In the summer, with a surge in seasonal demand but with supply still low, prices surged and have remained relatively high. Milk prices rose 4.7% over the past year.
[in-text-ad]
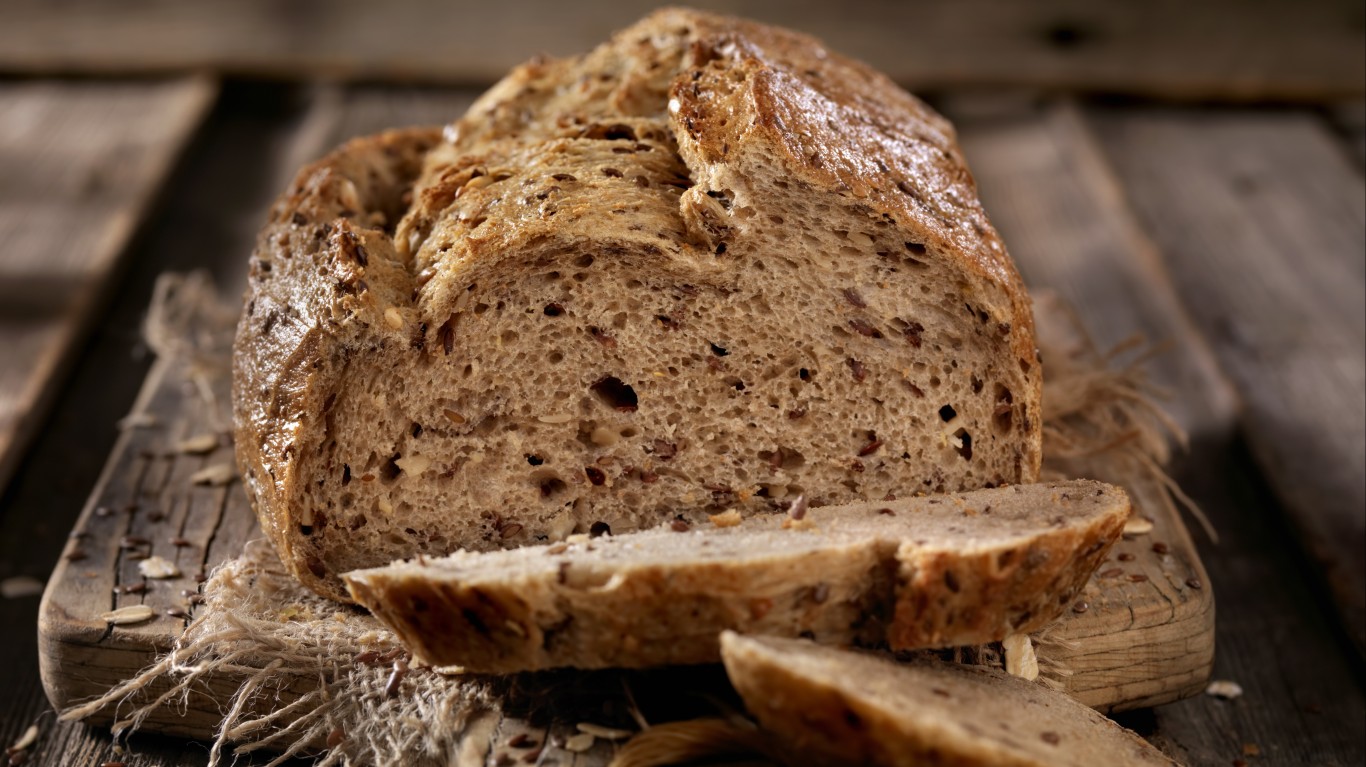
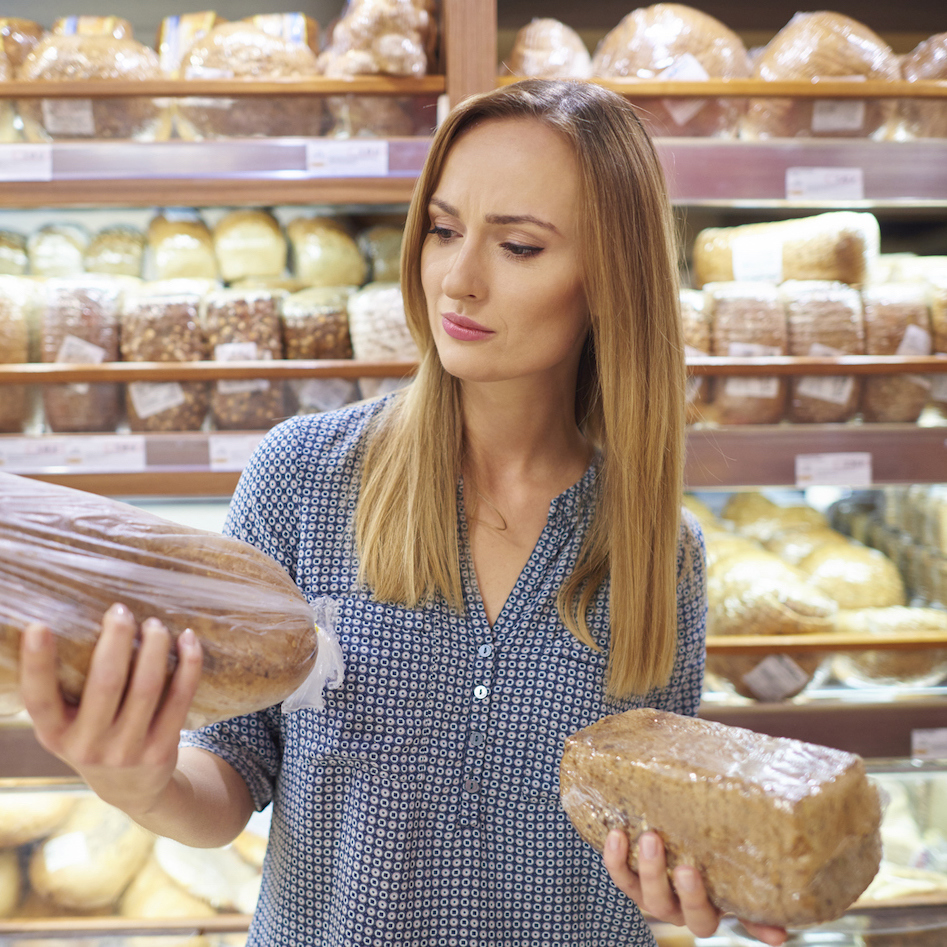
14. Bread other than white
> One year price increase: +4.8%
Breads other than white breads, like multigrain varieties, increased 4.8% in price throughout 2020. Much of this increase occurred at the very beginning of the pandemic, when restaurants were initially shuttered. The price of non-white bread varieties increased nearly 3.5% from March to April 2020.
[recirclink id=738598]
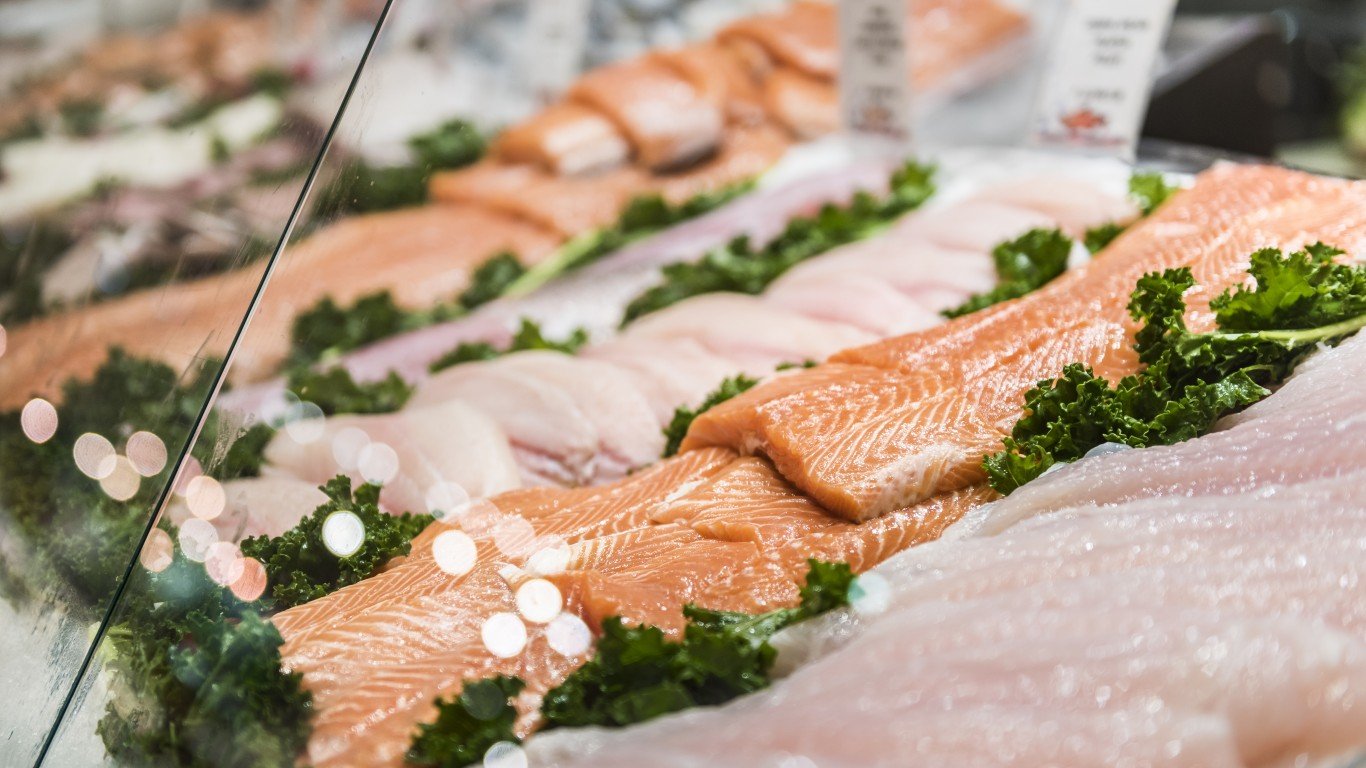
13. Processed fish and seafood
> One year price increase: +4.9%
Processed fish and seafood products were nearly 5% more expensive in January 2021 than 12 months earlier. While demand for fish and seafood actually dropped sharply in the earlier months of the pandemic, supply chains were interrupted. Prices for seafood increased as consumers sought beef alternatives beginning in the summer of 2020.
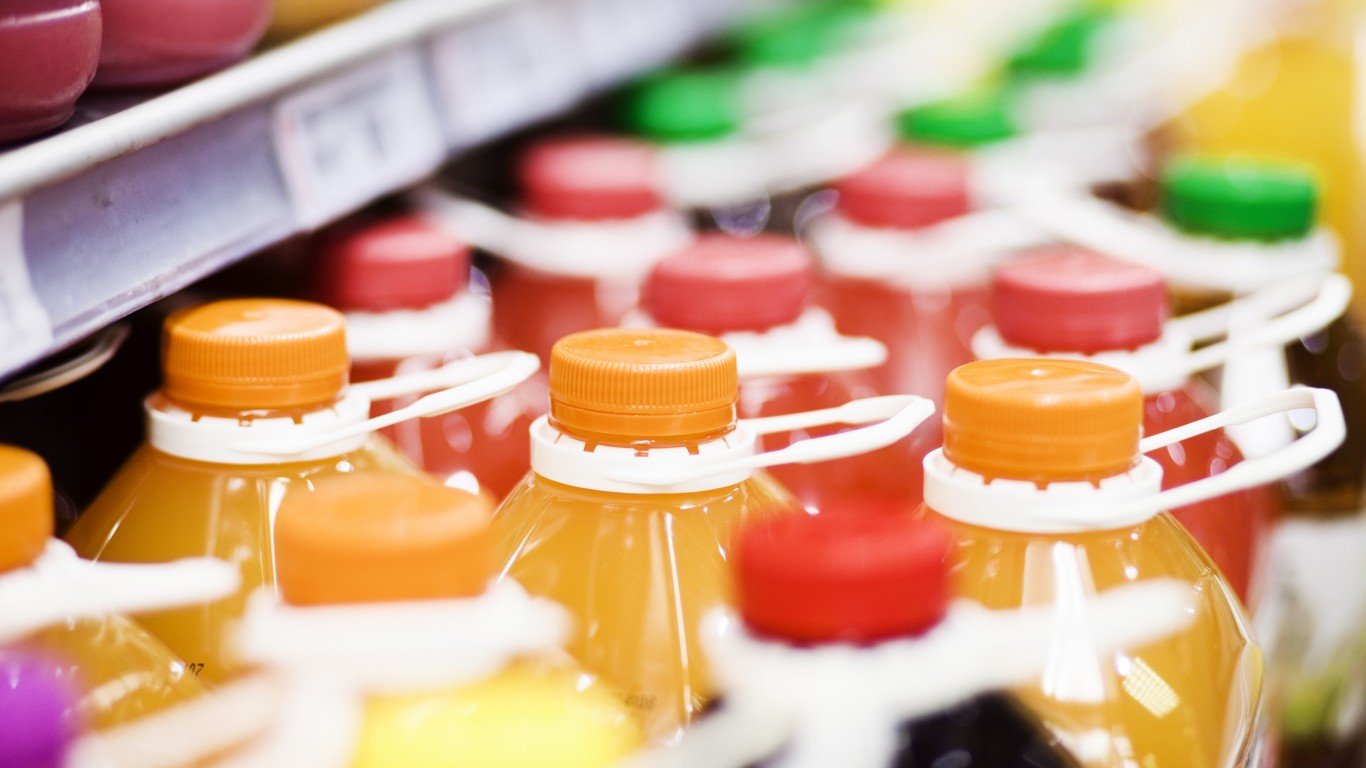
12. Juices and nonalcoholic drinks
> One year price increase: +5.0%
Juices and nonalcoholic drinks were one of just 12 food and grocery categories that increased in price by at least 5% from January 2020 to January 2021. Like many other items on this list, the price of juice surged between March and April of 2020. The price of juices and nonalcoholic drinks has remained relatively high, peaking in January of 2021.
[in-text-ad-2]
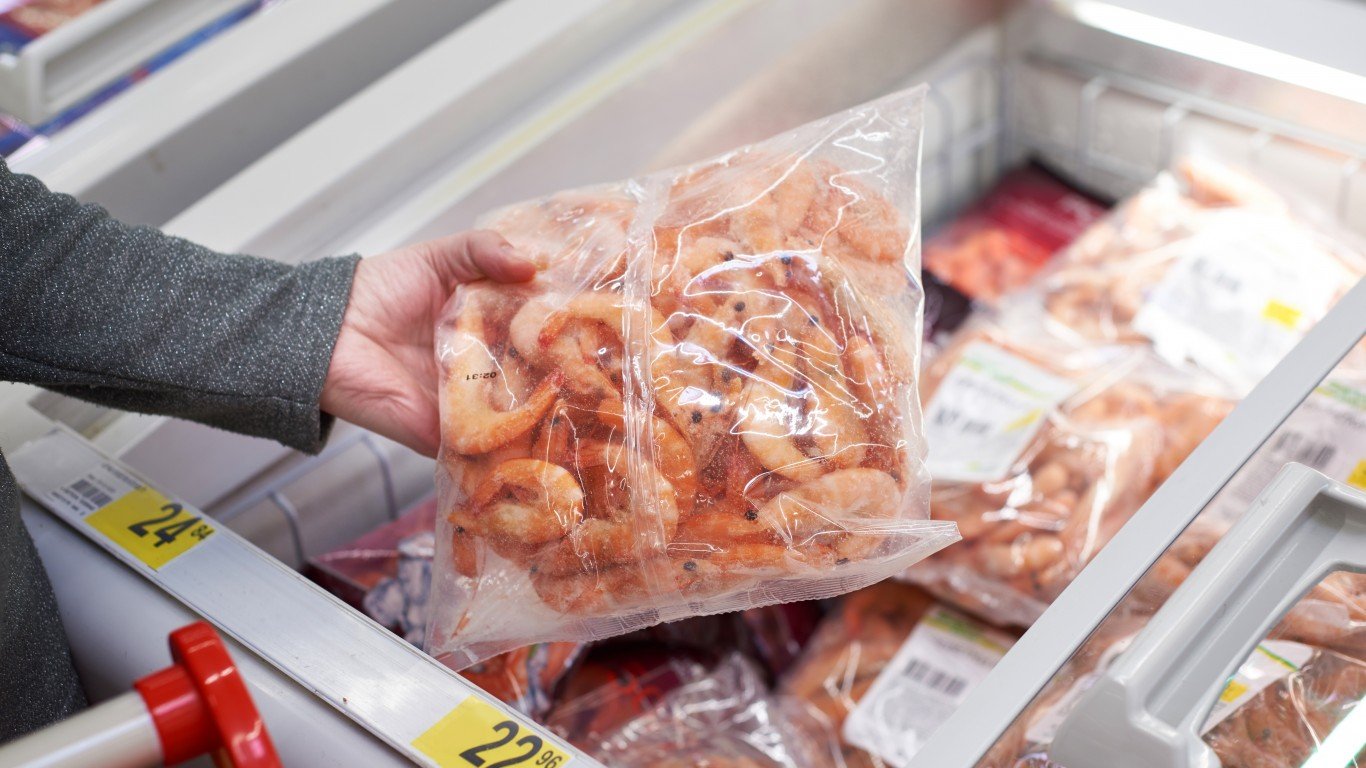
11. Frozen fish and seafood
> One year price increase: +5.0%
The price of frozen fish and seafood increased by over 7.5% in April 2020 compared to the previous month. At that time, as more states issued stay-at-home orders, demand for frozen and shelf-stable seafoods significantly increased, especially compared to the same stretch of 2019.
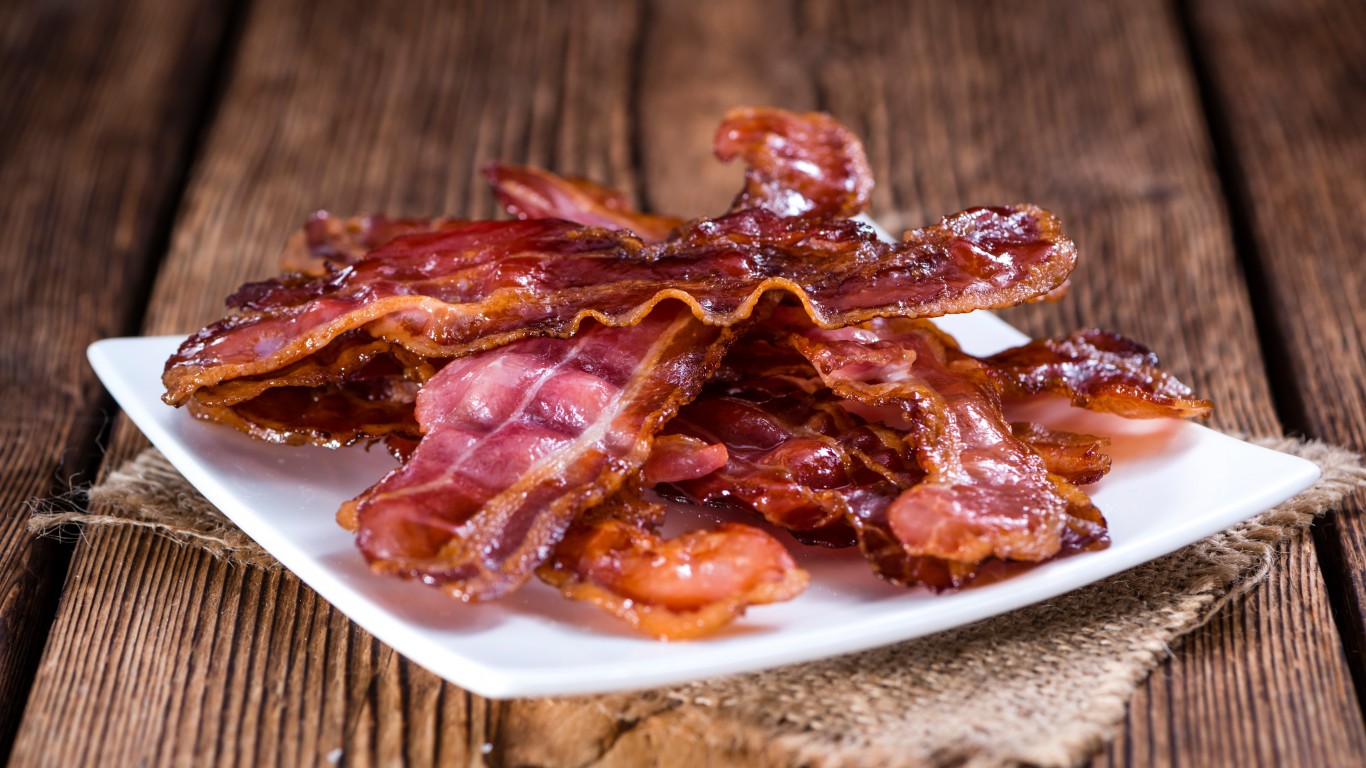
10. Bacon and related products
> One year price increase: +5.0%
The bacon and related products category ranks as one of the 10 grocery categories with the largest price increase amid the COVID-19 pandemic, with prices for items in the category soaring by 5.4% from January 2020 to January 2021. As people cooked at home much more frequently, proteins like bacon surged in popularity, leading to a price increase across the country.
[in-text-ad]
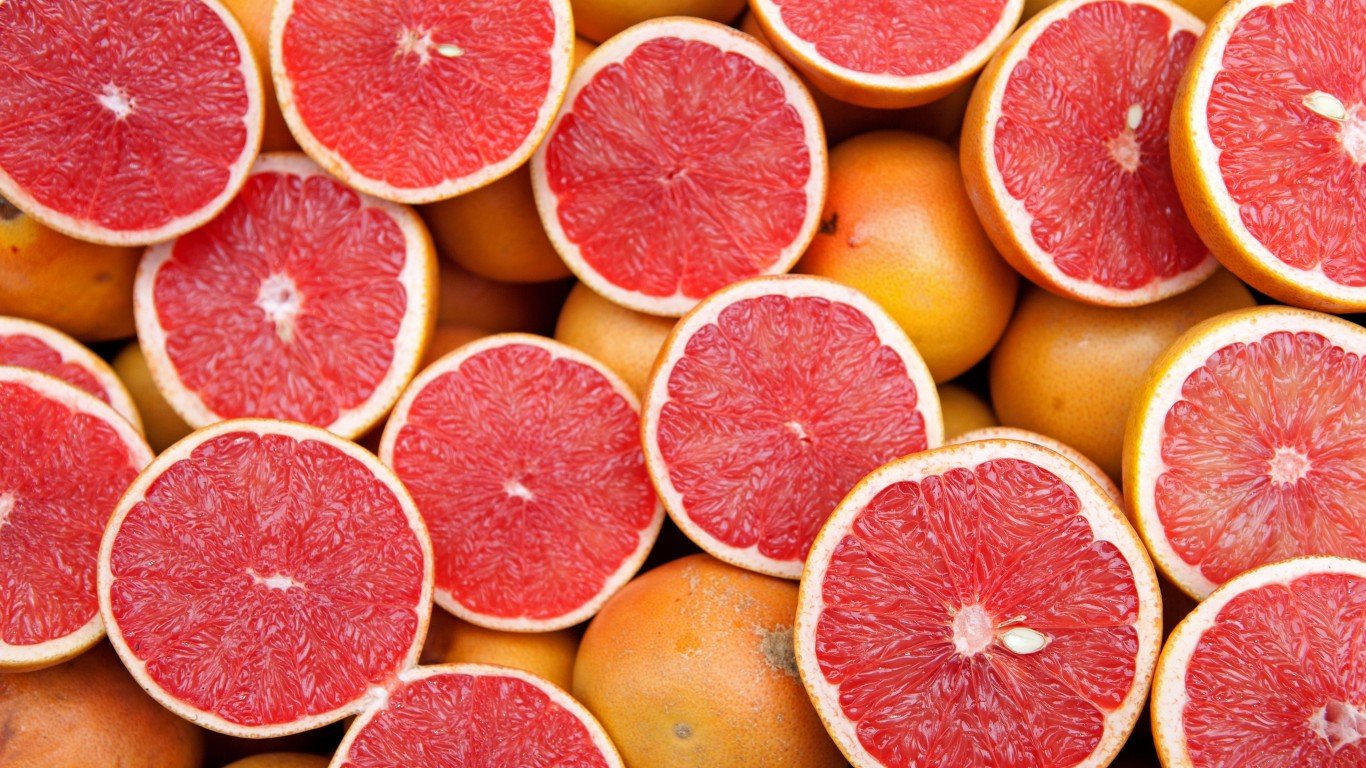
9. Citrus fruits
> One year price increase: +5.4%
Citrus fruit prices wax and wane with their seasonality each year, with prices generally bottoming out around February or March. Even before the pandemic, citrus prices were at their lowest level in years in early 2020. The pandemic appears to have caused a huge increase in demand for citrus fruits, which are rich in vitamin C, which supports normal immune system function.
[recirclink id=845020]
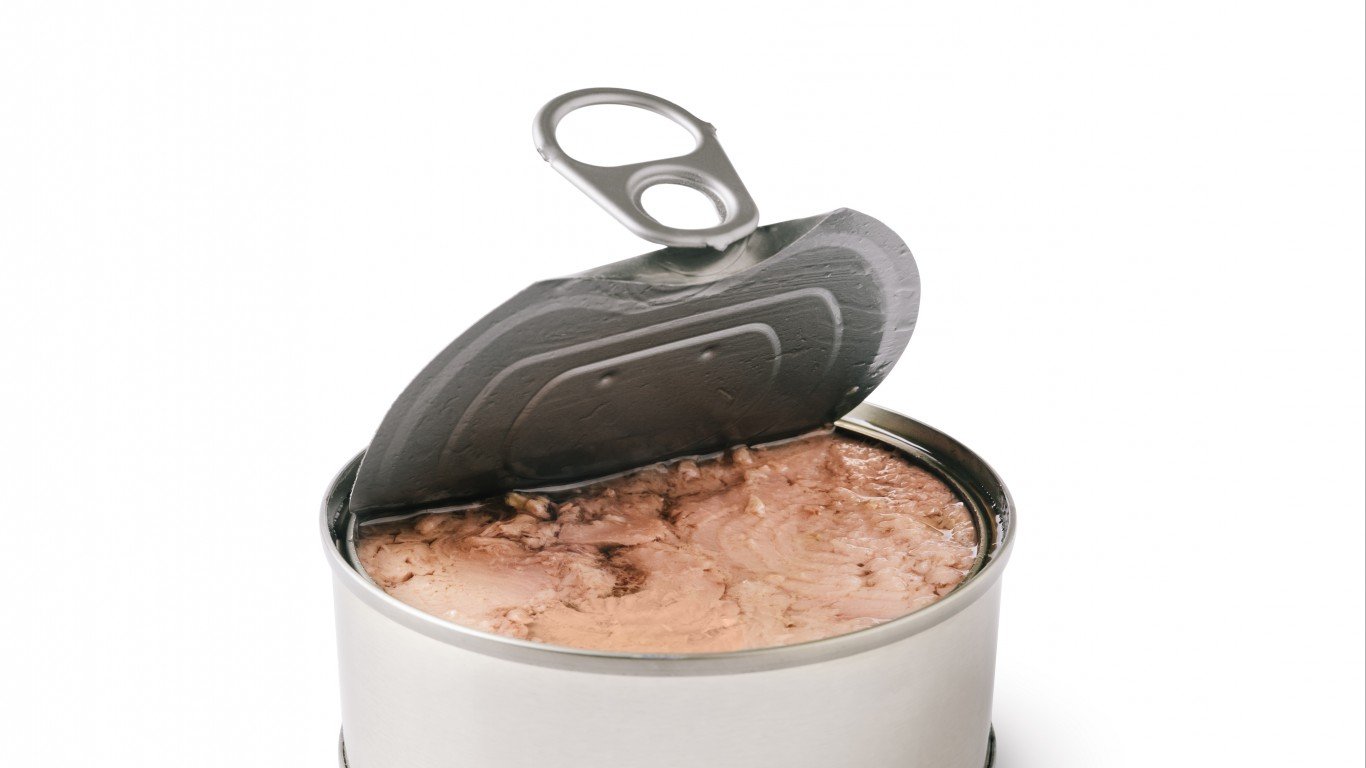
8. Shelf stable fish and seafood
> One year price increase: +5.5%
Shelf-stable fish and seafood like canned tuna had one of the largest price increases during the pandemic of all grocery items, with prices spiking by 5.5%. Americans stocked up on such proteins because of their “shelf life, availability, and relatively low price,” according to a congressional report on the seafood industry and its response to COVID-19.
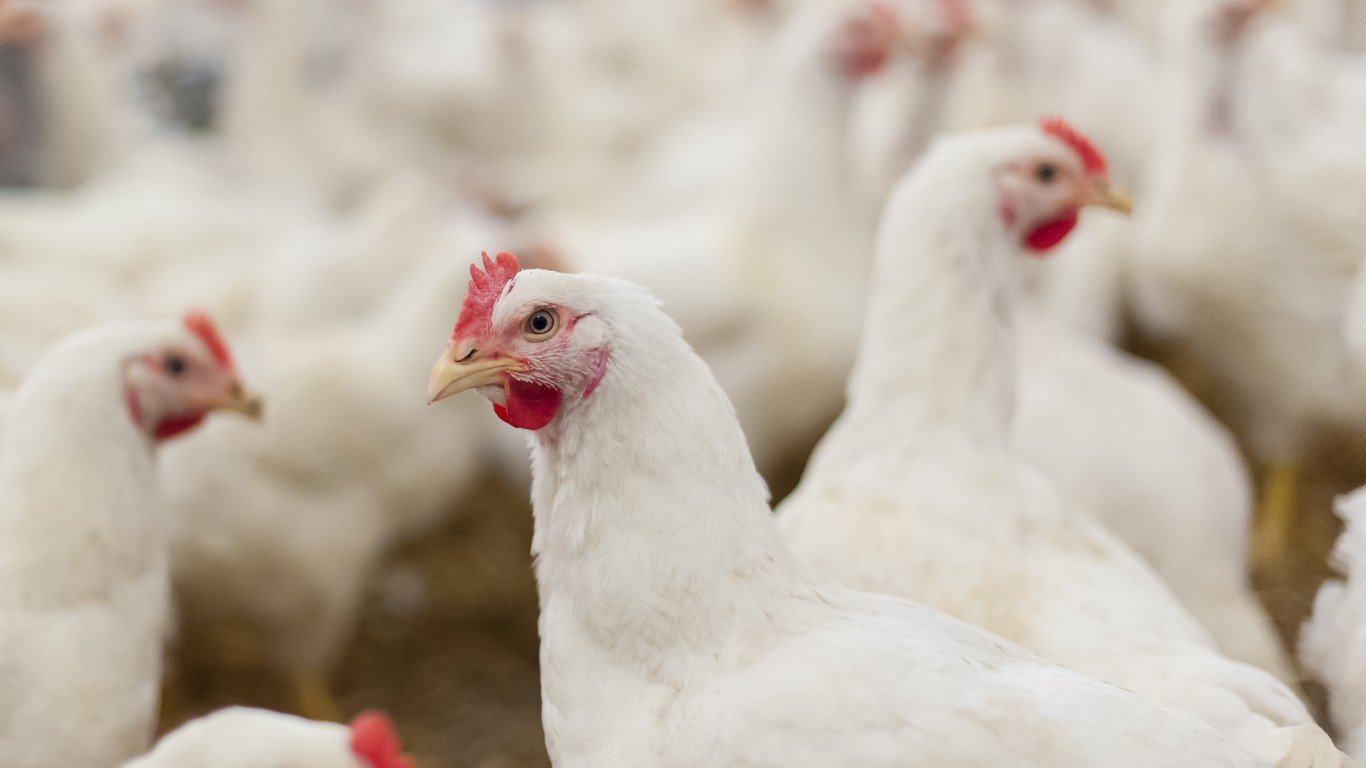
7. Poultry
> One year price increase: +6.1%
Poultry like chicken is one of just seven grocery categories in which prices increased by more than 6% from January 2020 to January 2021. The global poultry supply chain, like many others, was significantly affected by COVID-19. Workers at many poultry plants were asked to work overtime hours to keep up with demand at early points in the pandemic, but many of these plants then closed because of virus outbreaks at the plants.
[in-text-ad-2]
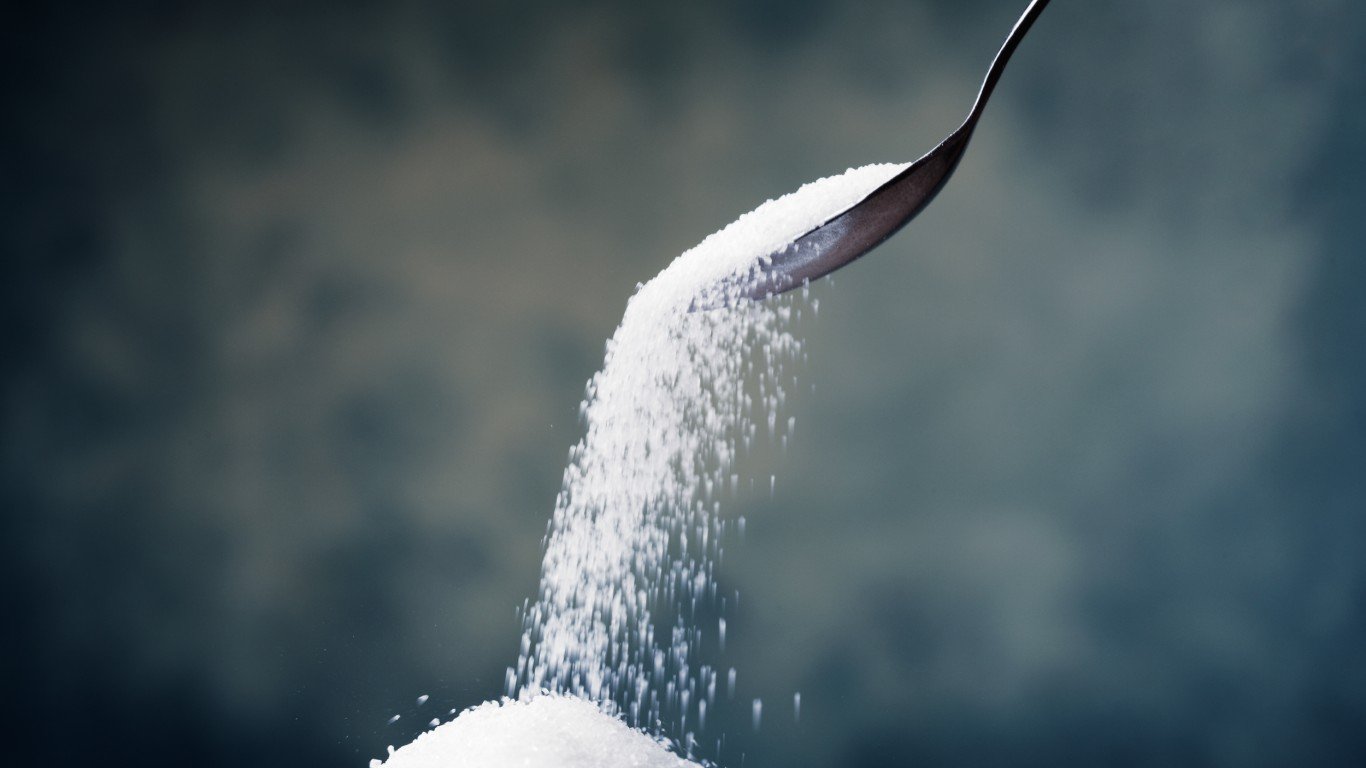
6. Sugar and artificial sweeteners
> One year price increase: +6.1%
Sugar and artificial sweetener prices had peaked in early 2012 before declining sharply, and they had stayed relatively stagnant from 2015 to 2019. Since the pandemic hit, sugar and sweetener prices have risen significantly, increasing 6.1% from January 2020 to January 2021. In this year-long window, the cost of sugar and artificial sweeteners has been relatively volatile, with significant month-to-month changes.
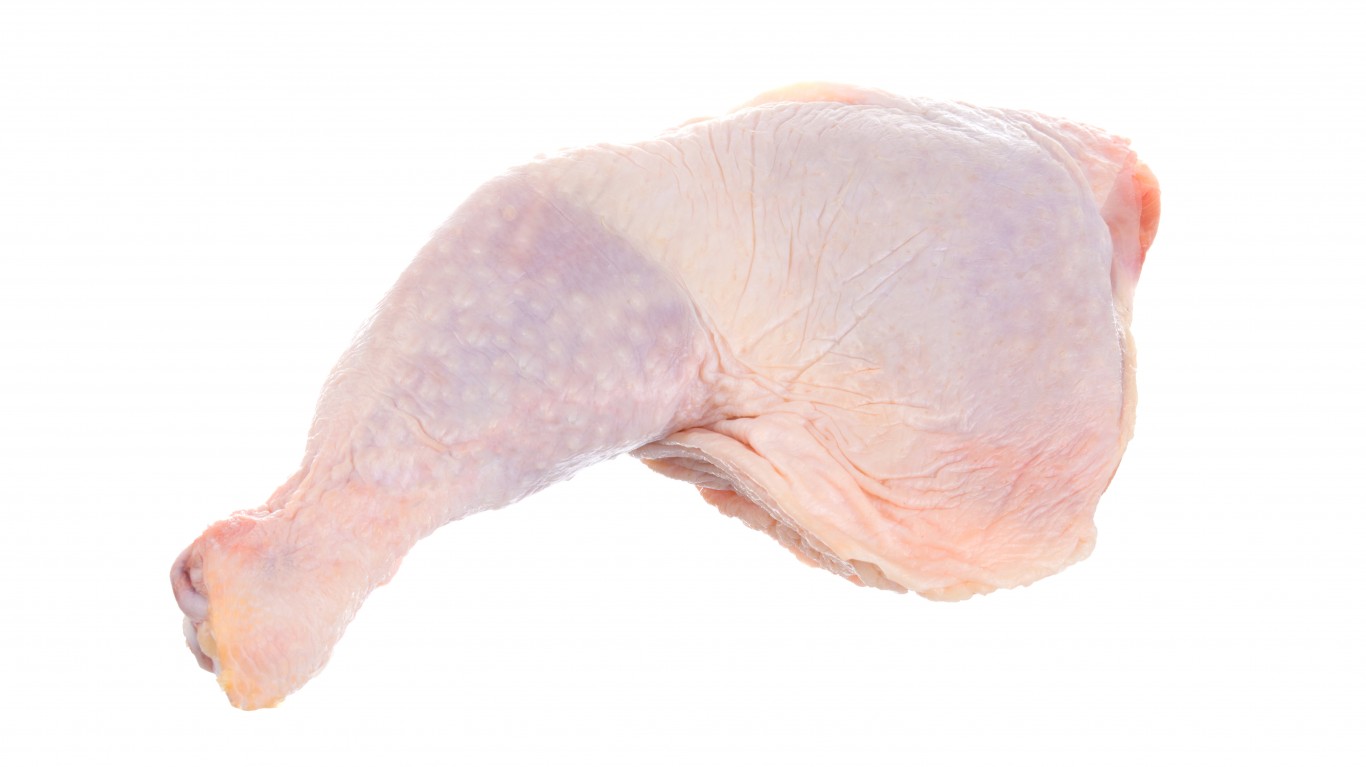
5. Fresh and frozen chicken parts
> One year price increase: +6.2%
Fresh and frozen chicken parts are among the five grocery store items that have increased the most in price over the past year. Chicken parts were 6.2% more expensive in January 2021 than a year earlier. For context, prices increased just 1.4% across all grocery items during that time. Amid the COVID-19 pandemic, American shoppers have stocked up on meats and proteins as they cooked at home much more frequently.
[in-text-ad]
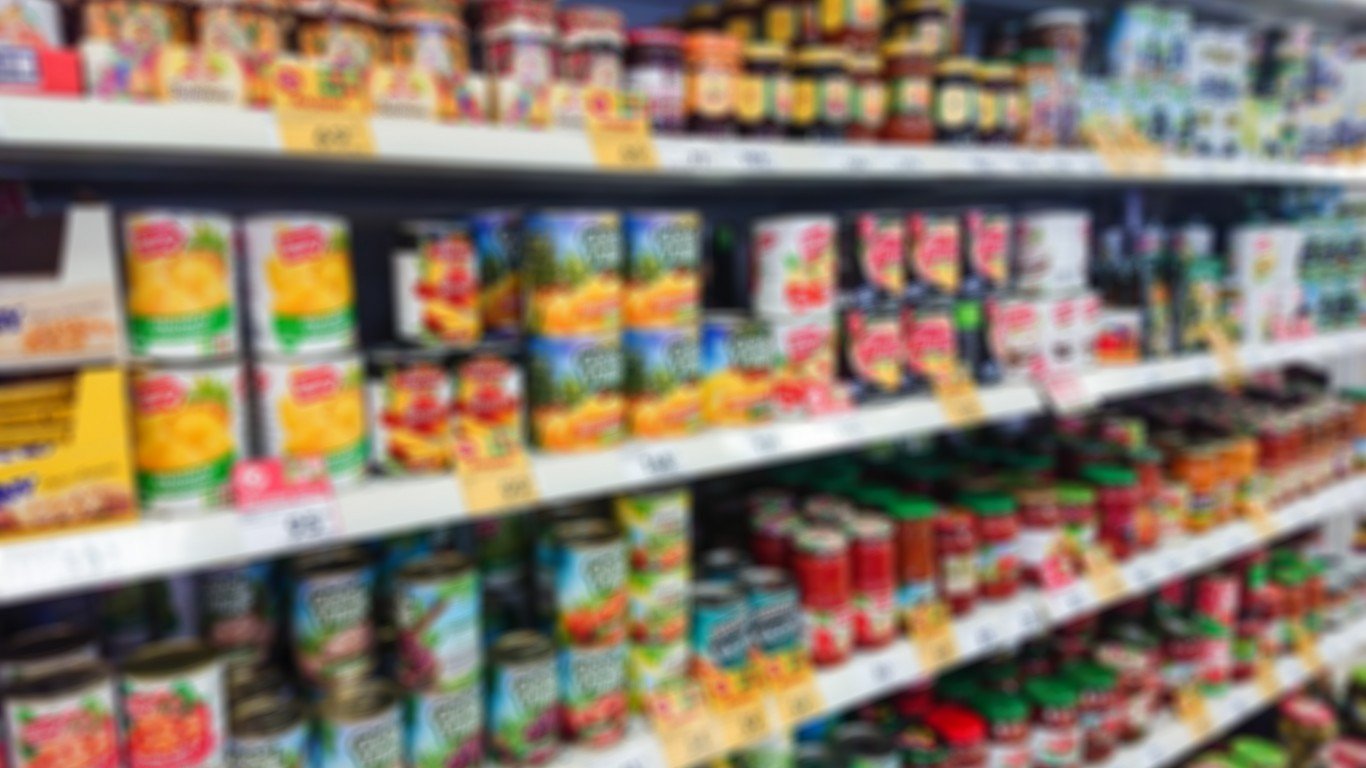
4. Canned vegetables
> One year price increase: +6.5%
The price of canned vegetables had remained relatively stable throughout the 2010s, even as the price of all grocery items steadily increased. Yet as COVID-19 shuttered restaurants and the supply chains for fresh produce was interrupted, many consumers stocked up on shelf-stable canned vegetables. After the initial spike in price from March to April, canned vegetables continued to get more expensive, peaking in June.
[recirclink id=848544]
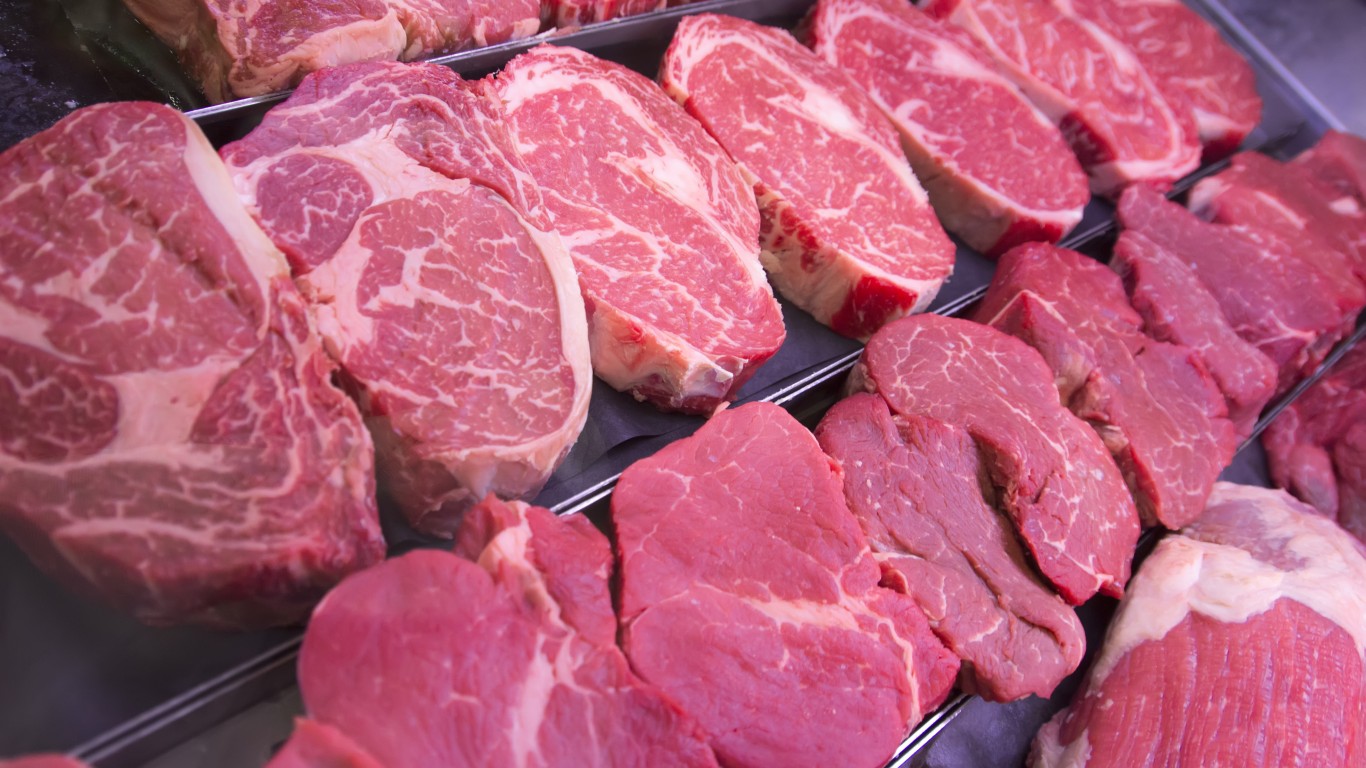
3. Uncooked beef steaks
> One year price increase: +6.6%
Like many other meat products available at grocery stores, uncooked beef steaks became more expensive throughout the COVID-19 pandemic Consumers sought out more proteins to cook at home, but the virus affected many meat processing plants, hampering their ability to meet demand.
The price of uncooked beef steak peaked in June 2020. Prices then declined by more than 15% to January 2021 levels, but remained 6.6% higher than January 2020.

2. Carbonated drinks
> One year price increase: +7.4%
Carbonated drinks increased in price by 7.4% from January 2020 to January 2021, more than all but one other grocery category. Yet these drinks stand out on this list, as they are not a protein or shelf-stable food product.
The increase in price was largely due to an interruption in the supply chain of carbon dioxide, the chemical that gives carbonated drinks their fizz. Ethanol producers, whose ethanol products end up in gasoline, capture CO2 as a byproduct and sell it to drink makers. But with demand for ethanol declining because Americans were driving less, ethanol producers made less CO2. Carbonated drink manufacturers reported that carbon dioxide prices increased by around 25%, and much of that increase was passed on to consumers.
[in-text-ad-2]
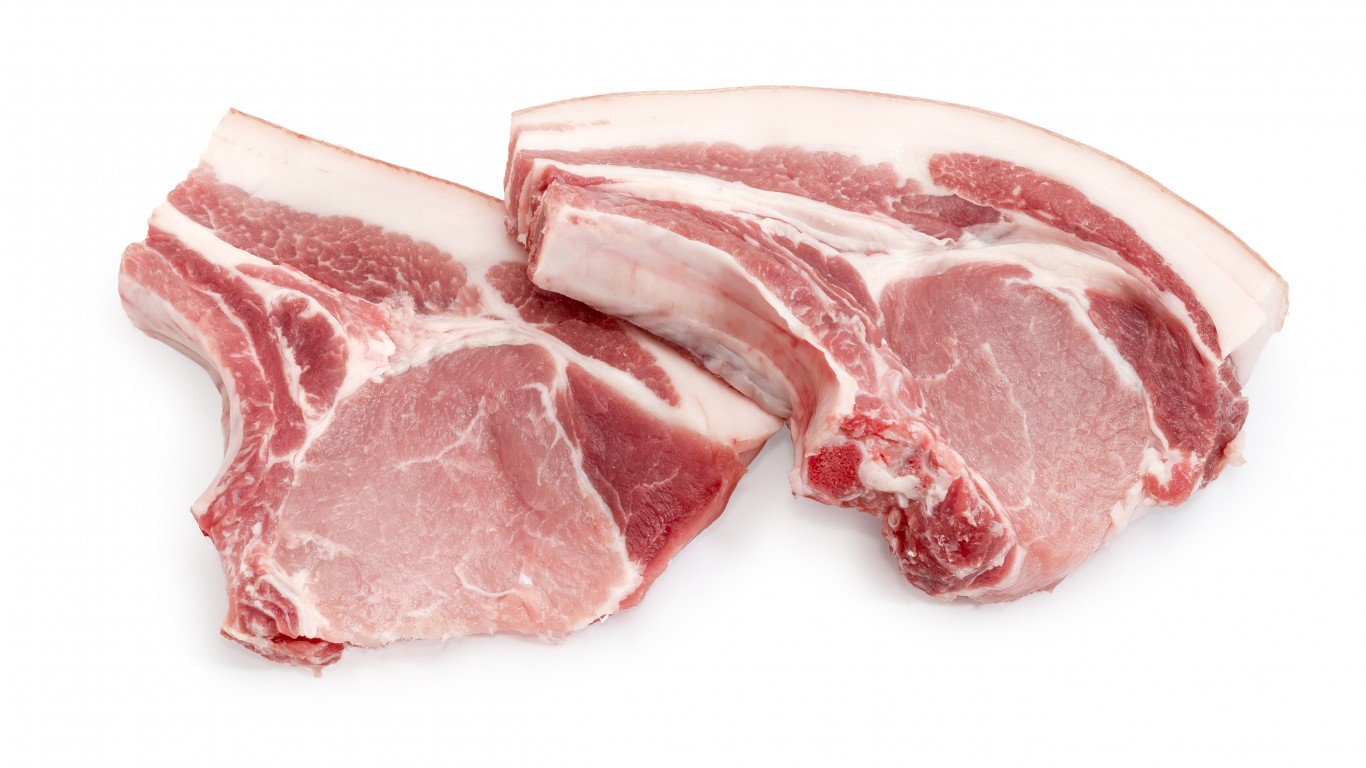
1. Pork chops
> One year price increase: +7.8%
No single grocery item had a larger percentage price increase during COVID-19 than pork chops. Across all types of pork, sales increased by 14.9% in volume and 22.6% in dollar sales through September 2020 compared to the same time in 2019. Though pork chops were 7.8% more expensive in January 2021 than they were the previous January, they actually peaked in price in June — that month, pork chops rose in price by 21% in just a few months.
Methodology:
To determine the groceries driving up your food bill the most during the pandemic, 24/7 Wall St. reviewed the change in the consumer price index for all urban consumers, which breaks down the change in CPI per detailed food category, from January 2020 to January 2021. Grocery items were ranked based on the percentage change in each category’s CPI from January 2020 to January 2021. Data used to calculate percentage change came from the Bureau of Labor Statistics and is not seasonally adjusted. Only food and beverage products were considered.
Contact [email protected] for any questions or corrections.