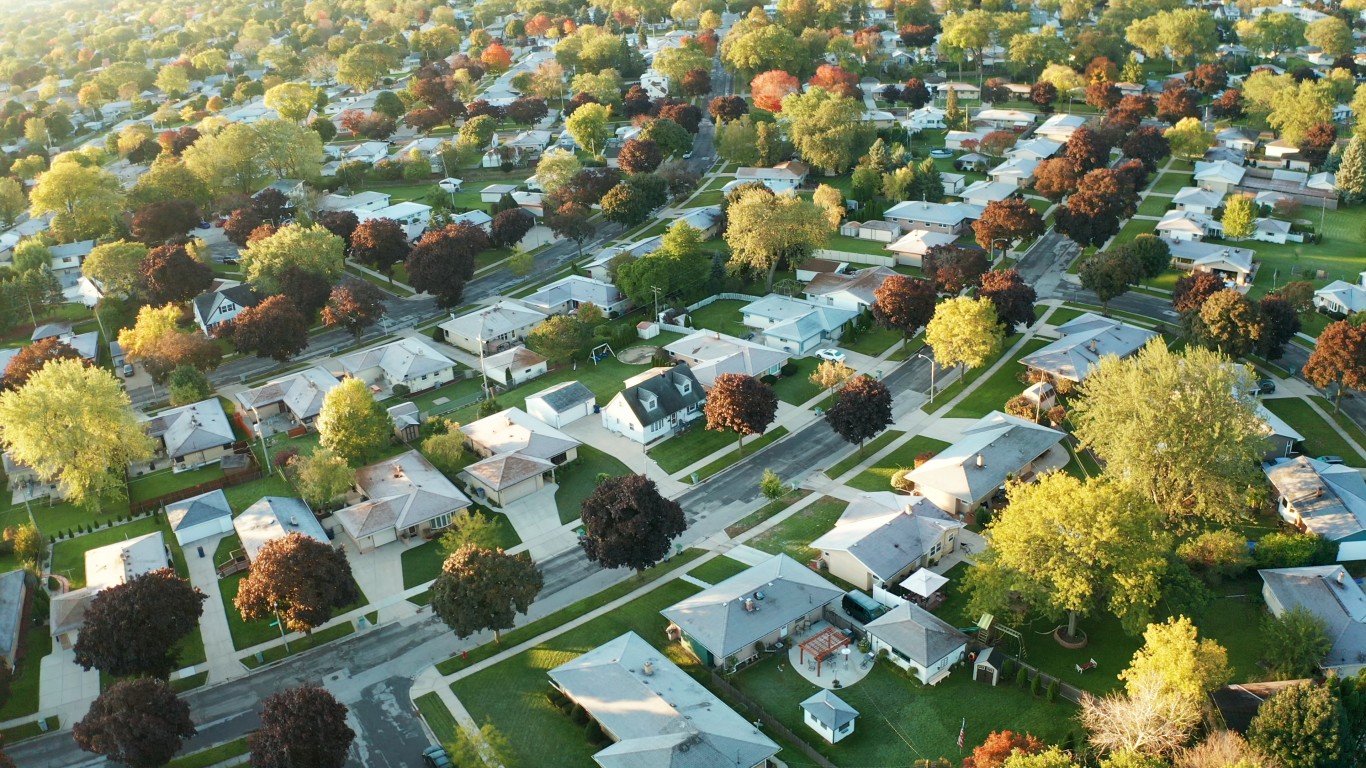
With travel significantly curtailed over the last two years, people have been spending more time at home. This means living in a desirable area has never been more important for Americans. People want to live in an area that is affordable, safe, and convenient — factors that are essential to providing a high quality of life.
While there are desirable places to live all across the country, many people choose to live in the South — a region known for its cuisine and warm weather. The South is growing rapidly, attracting Americans from other regions with its low cost of living and mild winters. The region has much to offer, and many of its cities stand out as especially good places to live.
To identify the best cities to live in the South, 24/7 Wall St. used data from the Census Bureau, FBI, and Centers for Disease Control and Prevention to create a weighted index of 25 measures across four categories: affordability, economy, quality of life, and community. Only communities in the 16 states in the South region, as designated by the U.S. Census Bureau, were considered.
Of the South’s 50 best cities to live, 16 are located in Texas — the region’s largest and most populous state. Texas is home to major population centers and economic hubs like Houston, Dallas, and Austin. Eight cities in Florida feature on the list, as do seven from Virginia. Of the 16 Southern states, just nine have at least one city to feature on the list.
Of course, living in one of the region’s most desirable communities is not attainable for everyone. Residents of the South’s best cities to live tend to have relatively high incomes compared to other places in the region, which is reflected in the area’s home values. Many of these areas have median home values well above the median nationwide. These are the most expensive towns to buy a home in the nation.
Click here to see the best cities to live in the South
Click here to read our detailed methodology

50. Missouri City, Texas
> Population: 74,557
> 5-yr. population change: +7.8%
> Median household income: $87,915
> 5-yr. unemployment rate: 6.7%
[in-text-ad]

49. Temple Terrace, Florida
> Population: 26,539
> 5-yr. population change: +5.7%
> Median household income: $63,018
> 5-yr. unemployment rate: 1.7%
[recirclink id=964562]
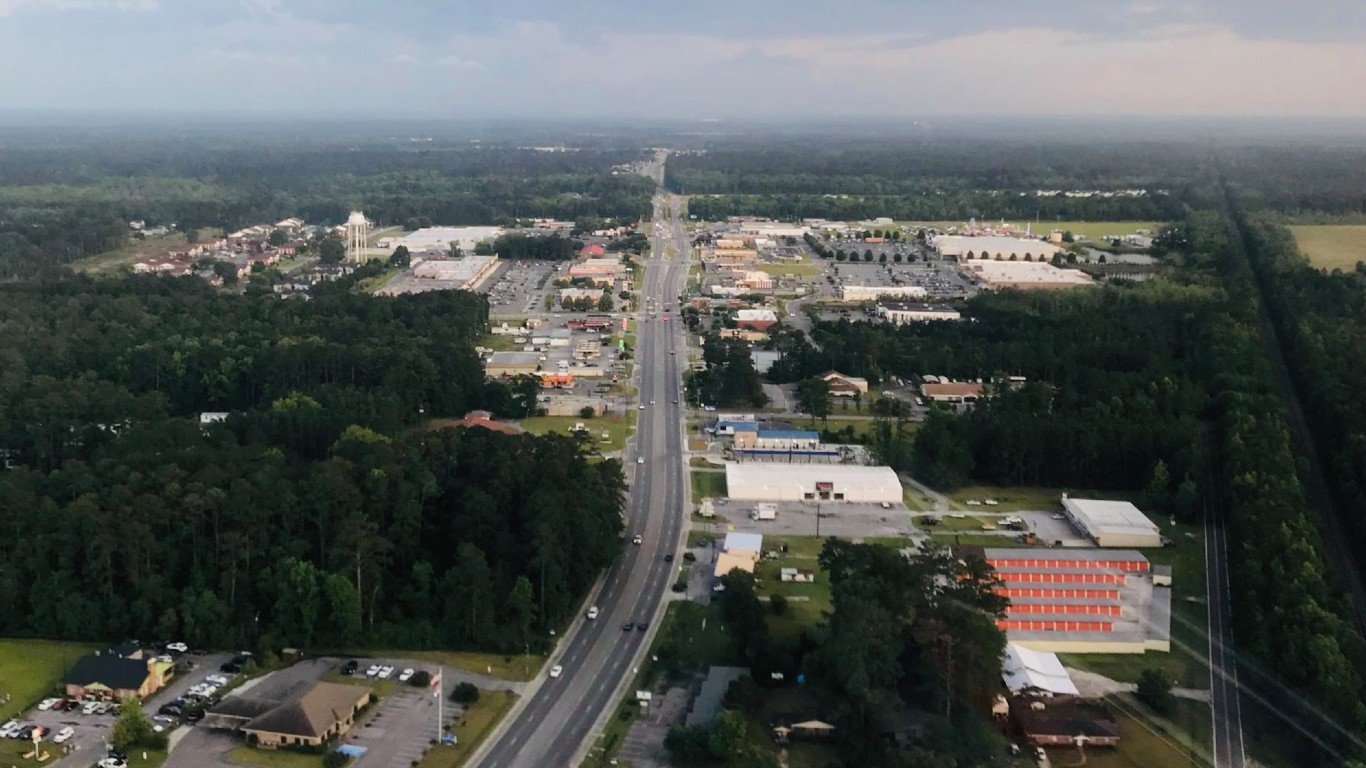
48. Rincon, Georgia
> Population: 10,027
> 5-yr. population change: +8.1%
> Median household income: $64,625
> 5-yr. unemployment rate: 3.7%

47. Panama City Beach, Florida
> Population: 12,751
> 5-yr. population change: +7.3%
> Median household income: $63,912
> 5-yr. unemployment rate: 2.8%
[in-text-ad-2]

46. Forest Acres, South Carolina
> Population: 10,412
> 5-yr. population change: -1.1%
> Median household income: $69,212
> 5-yr. unemployment rate: 4.5%

45. Collierville, Tennessee
> Population: 50,086
> 5-yr. population change: +7.1%
> Median household income: $113,996
> 5-yr. unemployment rate: 2.1%
[in-text-ad]

44. Royse City, Texas
> Population: 12,982
> 5-yr. population change: +33.1%
> Median household income: $82,860
> 5-yr. unemployment rate: 4.7%
[recirclink id=956476]

43. Germantown, Tennessee
> Population: 39,193
> 5-yr. population change: +0.0%
> Median household income: $118,163
> 5-yr. unemployment rate: 2.9%

42. Waxhaw, North Carolina
> Population: 15,237
> 5-yr. population change: +40.1%
> Median household income: $111,642
> 5-yr. unemployment rate: 3.2%
[in-text-ad-2]

41. Friendswood, Texas
> Population: 39,688
> 5-yr. population change: +7.3%
> Median household income: $111,478
> 5-yr. unemployment rate: 5.6%

40. Christiansburg, Virginia
> Population: 22,163
> 5-yr. population change: +3.4%
> Median household income: $60,856
> 5-yr. unemployment rate: 3.4%
[in-text-ad]

39. Burleson, Texas
> Population: 45,862
> 5-yr. population change: +16.6%
> Median household income: $79,784
> 5-yr. unemployment rate: 3.6%
[recirclink id=946029]

38. Bluffton, South Carolina
> Population: 20,799
> 5-yr. population change: +48.8%
> Median household income: $82,481
> 5-yr. unemployment rate: 1.4%

37. Bixby, Oklahoma
> Population: 26,541
> 5-yr. population change: +18.1%
> Median household income: $83,119
> 5-yr. unemployment rate: 2.9%
[in-text-ad-2]

36. Round Rock, Texas
> Population: 124,434
> 5-yr. population change: +16.3%
> Median household income: $82,676
> 5-yr. unemployment rate: 5.2%

35. Braselton, Georgia
> Population: 11,452
> 5-yr. population change: +39.5%
> Median household income: $105,096
> 5-yr. unemployment rate: 1.3%
[in-text-ad]

34. Virginia Beach, Virginia
> Population: 450,201
> 5-yr. population change: +1.0%
> Median household income: $76,610
> 5-yr. unemployment rate: 4.6%
[recirclink id=940603]

33. Leander, Texas
> Population: 53,716
> 5-yr. population change: +78.8%
> Median household income: $101,872
> 5-yr. unemployment rate: 3.1%

32. Suwanee, Georgia
> Population: 19,743
> 5-yr. population change: +18.6%
> Median household income: $90,436
> 5-yr. unemployment rate: 3.4%
[in-text-ad-2]

31. Bedford, Texas
> Population: 49,323
> 5-yr. population change: +2.5%
> Median household income: $70,362
> 5-yr. unemployment rate: 3.6%

30. Manassas, Virginia
> Population: 41,174
> 5-yr. population change: +1.8%
> Median household income: $81,493
> 5-yr. unemployment rate: 5.0%
[in-text-ad]

29. Lake Mary, Florida
> Population: 16,698
> 5-yr. population change: +14.3%
> Median household income: $96,983
> 5-yr. unemployment rate: 3.1%
[recirclink id=964562]
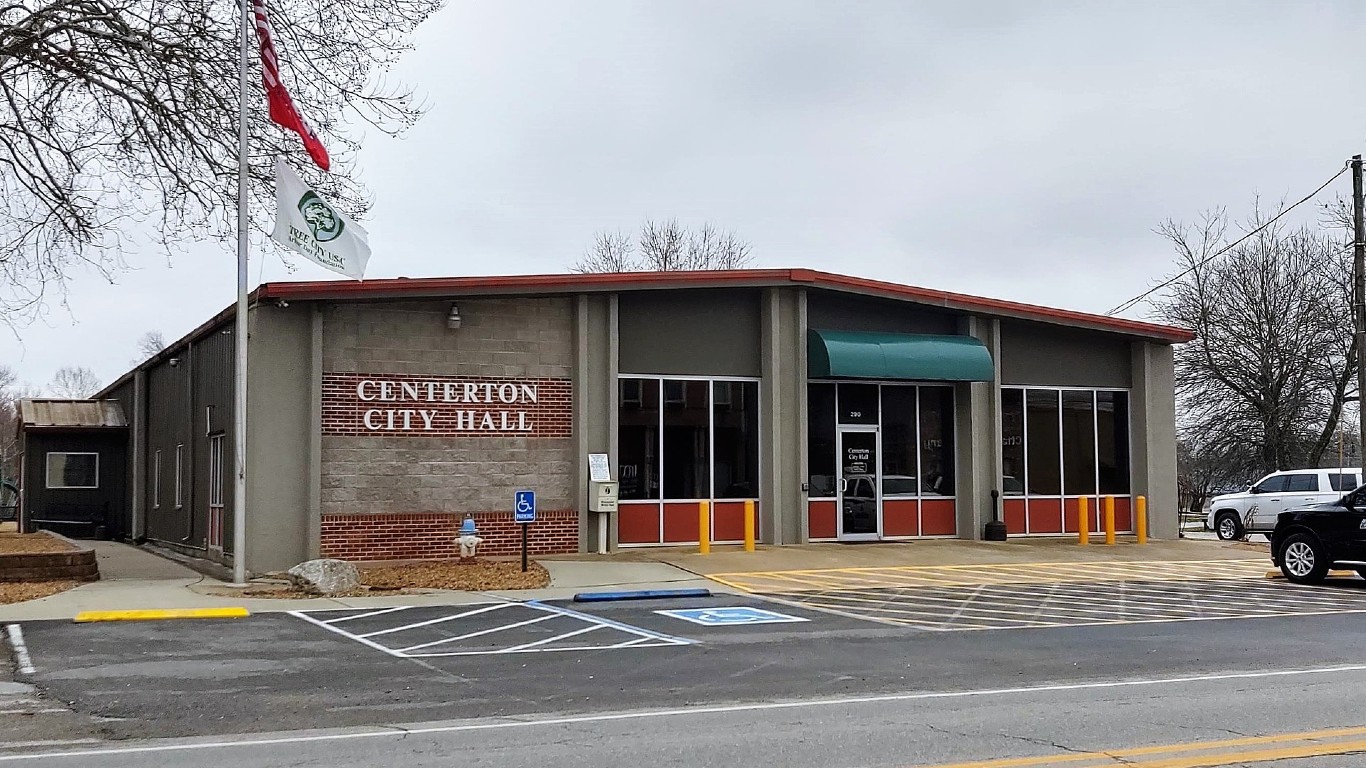
28. Centerton, Arkansas
> Population: 14,203
> 5-yr. population change: +38.2%
> Median household income: $75,631
> 5-yr. unemployment rate: 2.0%

27. Matthews, North Carolina
> Population: 32,044
> 5-yr. population change: +11.7%
> Median household income: $84,594
> 5-yr. unemployment rate: 3.3%
[in-text-ad-2]

26. Atlantic Beach, Florida
> Population: 13,575
> 5-yr. population change: +5.7%
> Median household income: $78,059
> 5-yr. unemployment rate: 2.8%

25. Pinehurst, North Carolina
> Population: 16,050
> 5-yr. population change: +6.6%
> Median household income: $82,081
> 5-yr. unemployment rate: 3.0%
[in-text-ad]

24. Jacksonville Beach, Florida
> Population: 23,399
> 5-yr. population change: +7.2%
> Median household income: $91,037
> 5-yr. unemployment rate: 2.4%
[recirclink id=956476]

23. Alexandria, Virginia
> Population: 157,613
> 5-yr. population change: +7.6%
> Median household income: $100,939
> 5-yr. unemployment rate: 3.0%

22. Fate, Texas
> Population: 12,787
> 5-yr. population change: +67.3%
> Median household income: $110,373
> 5-yr. unemployment rate: 3.8%
[in-text-ad-2]

21. Fulshear, Texas
> Population: 9,906
> 5-yr. population change: +333.7%
> Median household income: $166,863
> 5-yr. unemployment rate: 4.9%

20. Apex, North Carolina
> Population: 51,370
> 5-yr. population change: +26.4%
> Median household income: $111,435
> 5-yr. unemployment rate: 3.0%
[in-text-ad]

19. Buda, Texas
> Population: 15,565
> 5-yr. population change: +64.8%
> Median household income: $89,688
> 5-yr. unemployment rate: 2.0%
[recirclink id=946029]

18. Alpharetta, Georgia
> Population: 65,590
> 5-yr. population change: +7.7%
> Median household income: $113,802
> 5-yr. unemployment rate: 4.4%

17. Mount Pleasant, South Carolina
> Population: 86,982
> 5-yr. population change: +20.2%
> Median household income: $103,232
> 5-yr. unemployment rate: 2.1%
[in-text-ad-2]

16. Heath, Texas
> Population: 8,709
> 5-yr. population change: +14.3%
> Median household income: $155,781
> 5-yr. unemployment rate: 4.6%

15. Brentwood, Tennessee
> Population: 42,407
> 5-yr. population change: +8.6%
> Median household income: $168,688
> 5-yr. unemployment rate: 2.6%
[in-text-ad]

14. Prosper, Texas
> Population: 22,517
> 5-yr. population change: +80.1%
> Median household income: $146,733
> 5-yr. unemployment rate: 2.1%
[recirclink id=940603]

13. Marco Island, Florida
> Population: 17,834
> 5-yr. population change: +5.4%
> Median household income: $86,215
> 5-yr. unemployment rate: 3.1%

12. Milton, Georgia
> Population: 38,759
> 5-yr. population change: +11.1%
> Median household income: $128,559
> 5-yr. unemployment rate: 3.4%
[in-text-ad-2]

11. Sandy Springs, Georgia
> Population: 107,072
> 5-yr. population change: +8.7%
> Median household income: $78,613
> 5-yr. unemployment rate: 3.0%

10. Davidson, North Carolina
> Population: 12,735
> 5-yr. population change: +10.8%
> Median household income: $124,853
> 5-yr. unemployment rate: 2.8%
[in-text-ad]

9. Southlake, Texas
> Population: 31,292
> 5-yr. population change: +12.7%
> Median household income: $240,248
> 5-yr. unemployment rate: 2.2%
[recirclink id=964562]

8. Naples, Florida
> Population: 21,812
> 5-yr. population change: +7.9%
> Median household income: $107,013
> 5-yr. unemployment rate: 3.2%

7. Leesburg, Virginia
> Population: 52,994
> 5-yr. population change: +14.7%
> Median household income: $114,444
> 5-yr. unemployment rate: 3.4%
[in-text-ad-2]

6. Herndon, Virginia
> Population: 24,532
> 5-yr. population change: +1.6%
> Median household income: $111,371
> 5-yr. unemployment rate: 4.1%
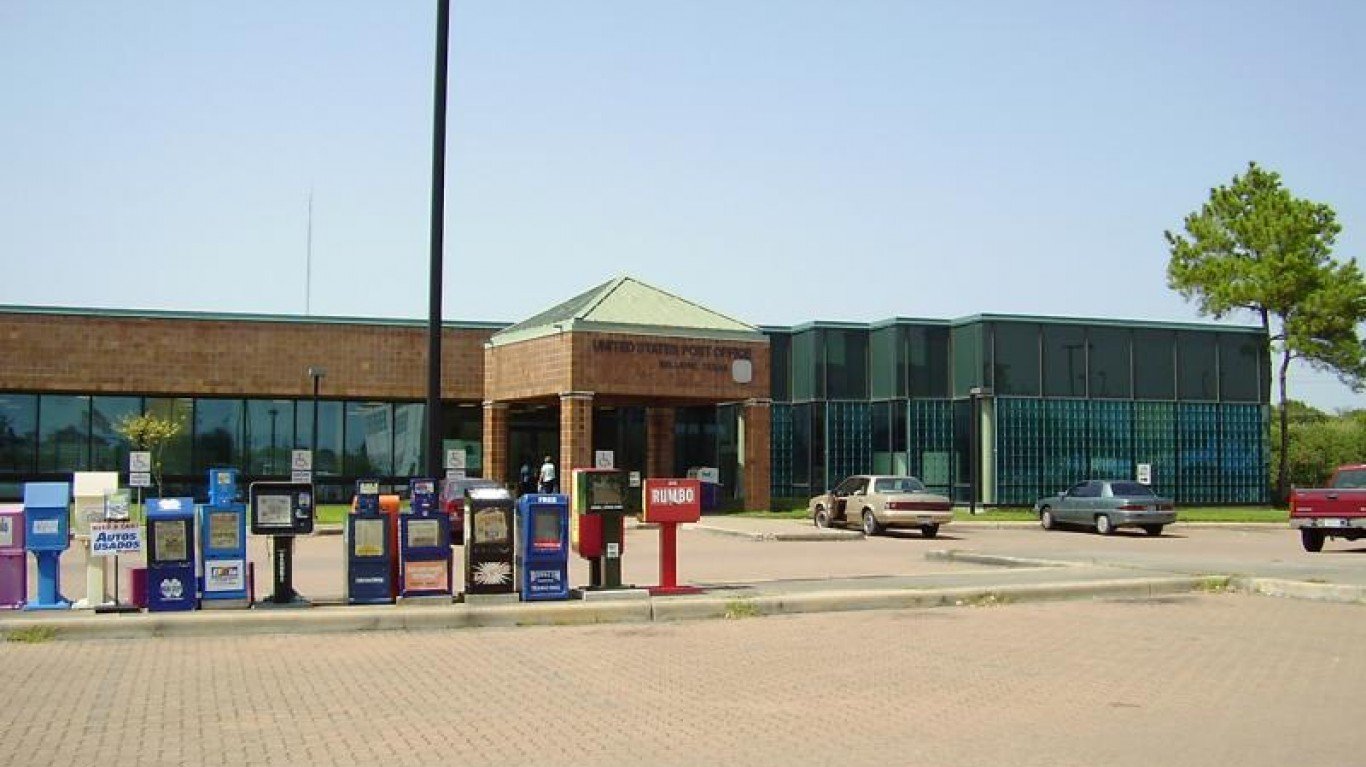
5. Bellaire, Texas
> Population: 18,815
> 5-yr. population change: +7.3%
> Median household income: $206,734
> 5-yr. unemployment rate: 2.0%
[in-text-ad]

4. Palm Beach, Florida
> Population: 8,723
> 5-yr. population change: +4.5%
> Median household income: $141,348
> 5-yr. unemployment rate: 2.3%
[recirclink id=956476]

3. Vienna, Virginia
> Population: 16,489
> 5-yr. population change: +2.0%
> Median household income: $161,196
> 5-yr. unemployment rate: 2.4%

2. West University Place, Texas
> Population: 15,603
> 5-yr. population change: +2.5%
> Median household income: $250,000+
> 5-yr. unemployment rate: 2.6%
[in-text-ad-2]

1. Highland Park, Texas
> Population: 9,168
> 5-yr. population change: +4.2%
> Median household income: $211,136
> 5-yr. unemployment rate: 1.4%
Methodology
To identify the best cities to live in, 24/7 Wall St. created a weighted index of 25 measures across four categories: affordability, economy, quality of life, and community.
1.) The affordability category consists of three measures:
- The ratio of median home value to median household income was included at full weight.
- Median property taxes paid as a percentage of median home value was included at one-fourth weight.
- Regional price parity, a measure of cost of living, was included at full weight.
2.) The economy category consists of four measures:
- Median home value was included at full weight.
- Employment growth from 2015 to 2019 was included at one-half weight.
- The ratio of the number of employed workers to the total population was included at one-half weight.
- The unemployment rate was included at full weight.
3.) The quality of life category consists of six measures:
- The poverty rate was included at full weight.
- The share of the population in urban census tracts at least 1 mile from a grocery store and in rural census tracts at least 10 miles from a grocery store, a measure of poor food access, was included at full weight.
- The distance from the city center to the nearest hospital was included at full weight.
- The percentage of patients discharged from acute care hospitals who were readmitted to the hospital within 30 days was included at full weight.
- The percentage of heart attack, coronary artery bypass grafting (CABG) surgery, chronic obstructive pulmonary disease (COPD), heart failure, pneumonia, and stroke patients who passed away within 30 days of treatment was included at full weight.
- The number of drug-related fatalities per 100,000 residents was included at one-fourth weight.
4.) The community category consists of 12 measures:
- The percentage of workers 16 and over commuting by public transit, walking, or other non-car means was included at one-half weight.
- The average travel time to work was included at full weight.
- The number of hospital admissions for conditions that could be treated in an outpatient setting per 1,000 Medicare enrollees — an indication of poor outpatient care and overuse of hospitals — was included at one-half weight.
- The number of violent crimes — homicide, rаpe, robbery, and aggravated assault — reported per 100,000 residents was included at full weight.
- The number of property crimes — burglary, larceny, motor vehicle theft, and arson — reported per 100,000 residents was included at full weight.
- The number of movie theaters per 100,000 residents was included at one-fourth weight.
- The number of libraries and archives per 100,000 residents was included at one-fourth weight.
- The number of theater companies and dinner theaters per 100,000 residents was included at one-fourth weight.
- The number of museums per 100,000 residents was included at one-fourth weight.
- The number of nature parks and similar institutions per 100,000 residents was included at one-fourth weight.
- The number of alcoholic drinking places per 100,000 residents was included at one-fourth weight.
- The number of restaurants and other eating places per 100,000 residents was included at one-fourth weight.
Data on population, employment, unemployment, median home value, median household income, median property taxes paid, commuter characteristics, average travel time to work, and poverty came from the U.S. Census Bureau’s American Community Survey and are five-year estimates for the period 2015 to 2019. Employment data used to calculate five-year employment growth are five-year estimates for the years 2011 to 2015. Data on cost of living came from real estate analysis company ATTOM Data Solutions and is for the year 2014.
Data on the share of the population in urban census tracts or areas at least 1 mile from a grocery store and in rural census tracts at least 10 miles from a grocery store, a measure of poor food access, came from the U.S. Department of Agriculture’s 2020 update to the Food Access Research Atlas and is at the county level.
Data on hospital locations came from the Centers for Medicare & Medicaid Services. Data on 30-day readmission rates and 30-day mortality rates also came from the CMS and are for the period July 2016 to June 2019. Data was aggregated to the city level for cities with at least one hospital, and was aggregated to the county level for cities with no hospitals. Data on the number of drug-related deaths per 100,000 residents per year from the period 2017 to 2019 is from the Centers for Disease Control and Prevention and is at the county level. Data on preventable hospitalizations per 1,000 Medicare enrollees came from the 2021 County Health Rankings and Roadmaps program, a collaboration between the Robert Wood Johnson Foundation and University of Wisconsin Population Health Institute, and is at the county level.
Data on the number of violent crimes and property crimes reported per 100,000 residents came from the FBI’s Uniform Crime Reporting Program and are for the year 2019.
Data on the number of movie theaters, libraries and archives, theater companies and dinner theaters, museums, nature parks and other similar institutions, alcoholic beverage drinking places, and restaurants and other eating places came from the Census Bureau’s 2019 County Business Patterns series and is at the county level.
To avoid geographic clustering, we only took the top-ranking city in a given county. Our list includes cities, towns, villages, boroughs, and census-designated places. We did not include places with fewer than 8,000 residents in our analysis.
Contact [email protected] for any questions or corrections.