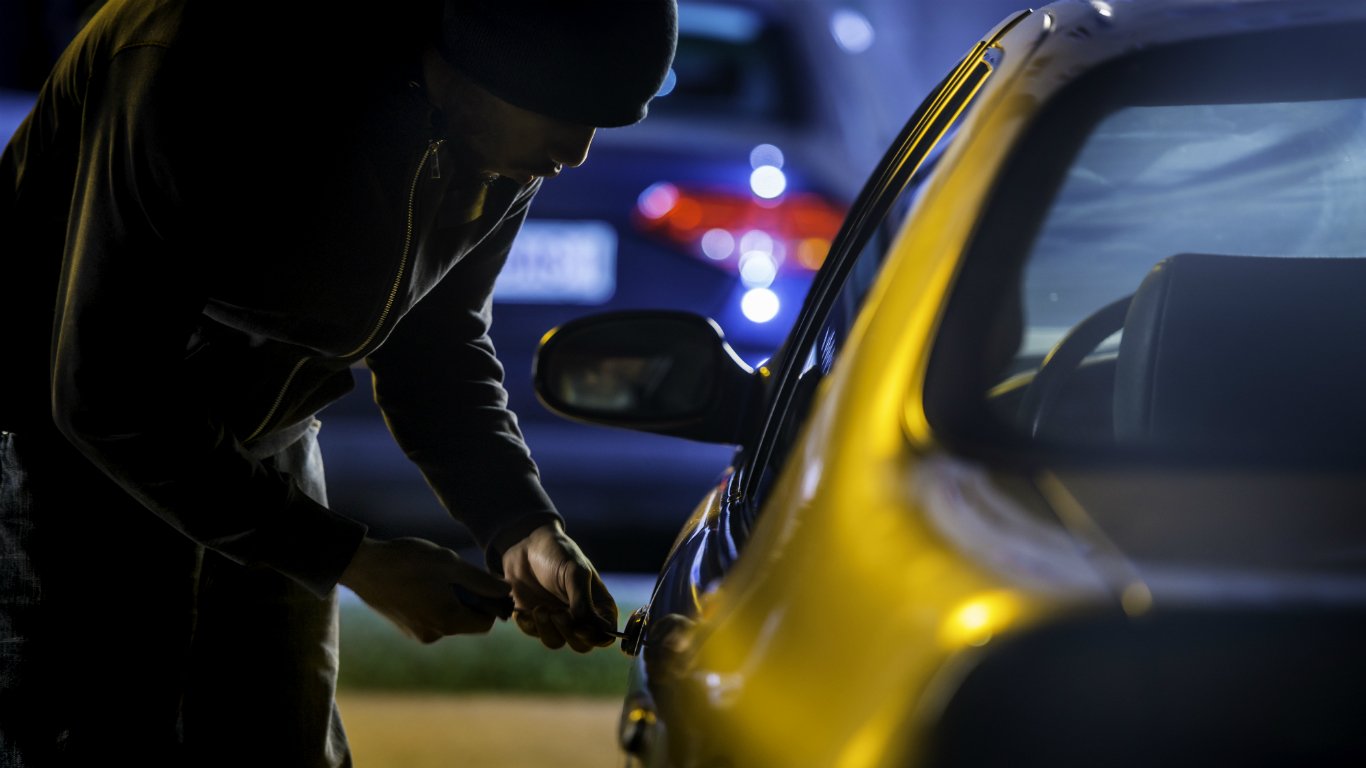
Motor vehicle theft, one of the most serious offenses tracked by the FBI, is on the rise in the United States. There were a total of 810,400 motor vehicle thefts nationwide in 2020, the most in over a decade.
Motor vehicle theft can be either the theft or attempted theft of a vehicle, such as a car, truck, ATV, or motorcycle. Some experts attribute the rising rates of vehicle theft to the COVID-19 pandemic, which led to vehicles sitting unattended and unused for longer than usual. Additionally, vehicle theft is often committed for monetary gain, and the pandemic sent unemployment soaring and left many Americans struggling financially.
While motorists nationwide now face a greater risk of vehicle theft than they have in many years, in some parts of the country, car owners are far more likely to be victims of car theft than in others.
Using data from the FBI’s 2020 Uniform Crime Report, 24/7 Wall St. identified the 50 metro areas where your car is most likely to be stolen. Metropolitan areas are ranked by the number of motor vehicle thefts reported for every 100,000 people.
In every metro area on this list, vehicle theft rates are far higher than — and in some cases more than double — the national rate of 246 incidents per 100,000 people. Most of the metro areas on this list are in the West, including 15 in California alone.
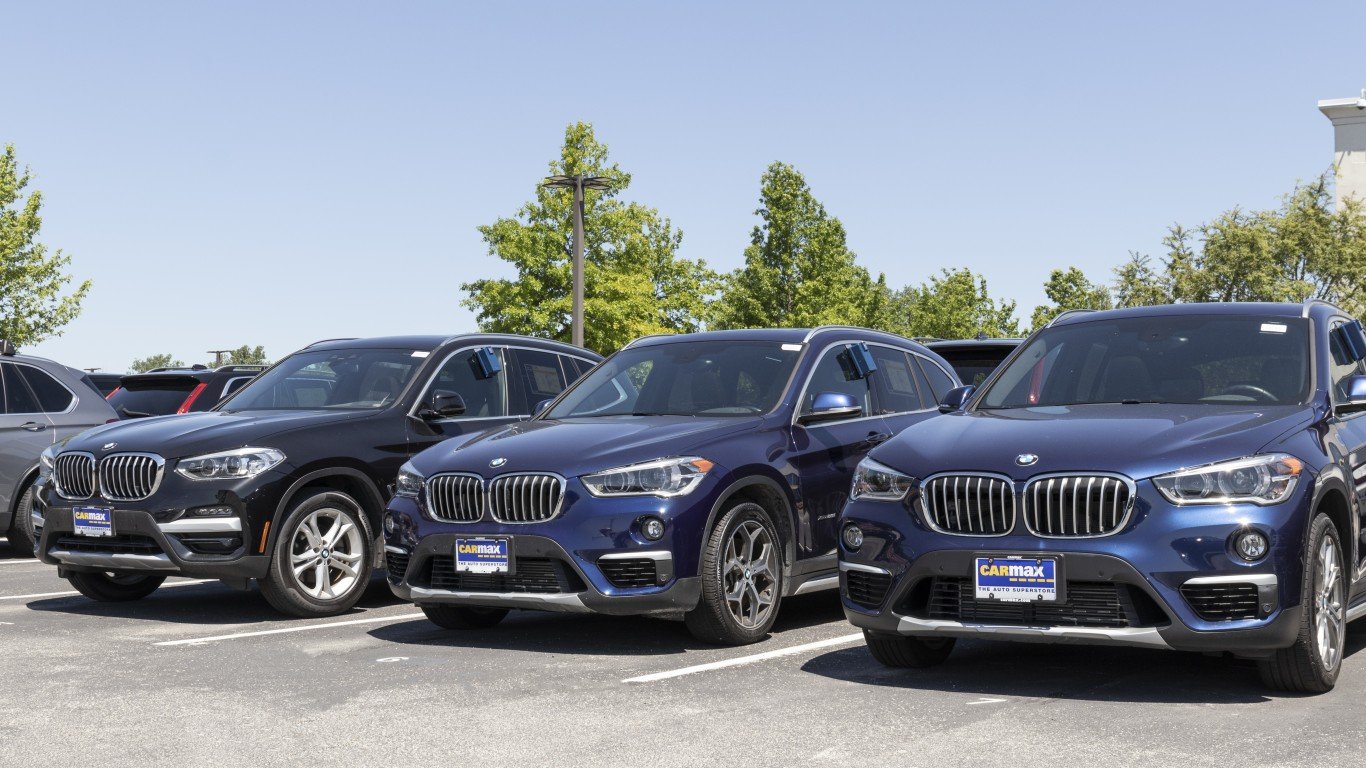
Motor vehicle theft — along with larceny and burglary — is one of three criminal offenses that comprise the property crime category. Due in large part to higher than average vehicle theft rates, in nearly every metro area on this list, the overall property crime rate exceeds the national rate of 1,958 incidents per 100,000 people. Here is a look at the 10 most stolen cars in America.
Click here to see metros where your car is most likely to be stolen
Click here to see our detailed methodology

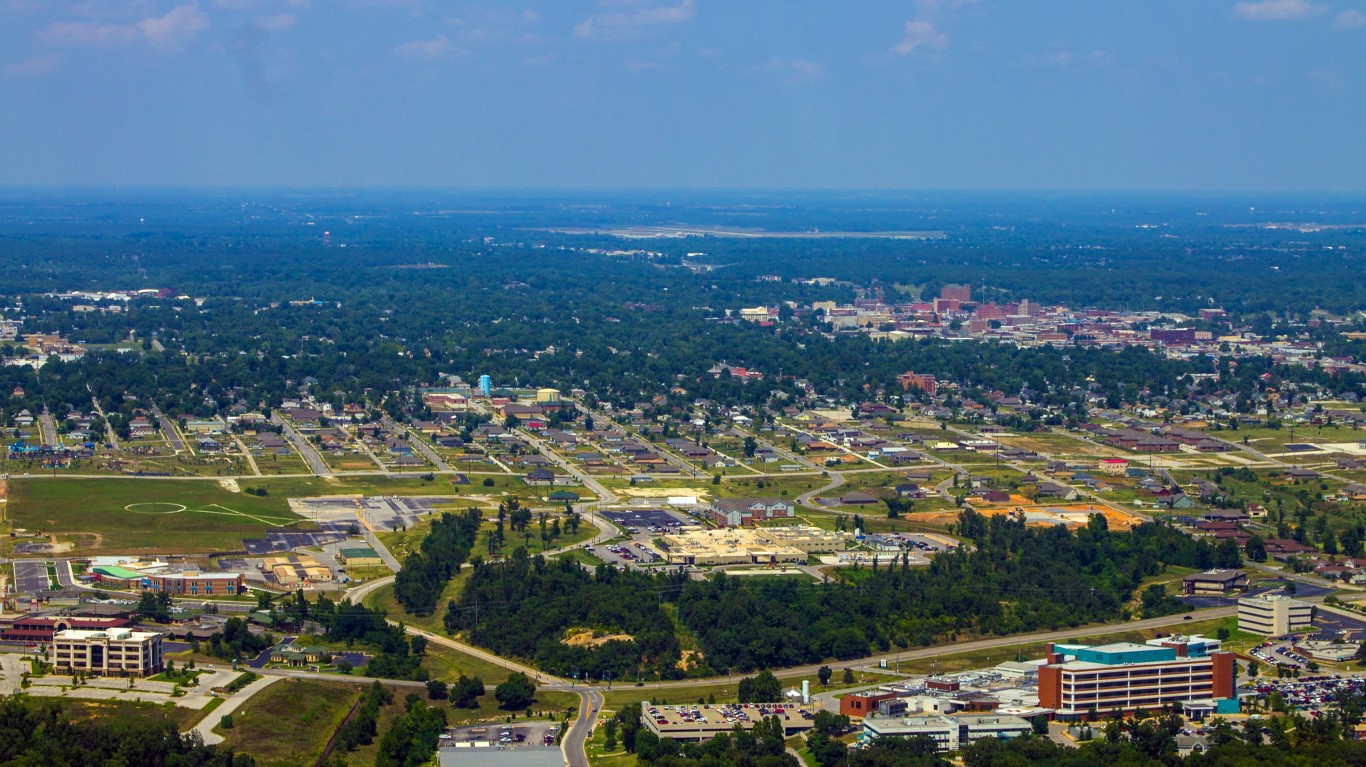
50. Macon-Bibb County, GA
> 2020 vehicle thefts per 100K people: 367.1
> Total vehicle thefts: 842 — 108th highest of 292 metros (tied)
> Property crimes per 100K people: 2,745.9 — 48th highest of 276 metros
> Total property crimes: 6,299 — 120th highest of 276 metros
> Population: 231,130
[in-text-ad]

49. Santa Cruz-Watsonville, CA
> 2020 vehicle thefts per 100K people: 367.4
> Total vehicle thefts: 998 — 91st highest of 292 metros (tied)
> Property crimes per 100K people: 2,266.1 — 91st highest of 276 metros
> Total property crimes: 6,155 — 122nd highest of 276 metros
> Population: 273,213
[recirclink id=997124]

48. New Orleans-Metairie, LA
> 2020 vehicle thefts per 100K people: 367.5
> Total vehicle thefts: 4,686 — 27th highest of 292 metros
> Property crimes per 100K people: 2,754.6 — 47th highest of 276 metros
> Total property crimes: 35,121 — 26th highest of 276 metros
> Population: 1,270,530

47. Midland, TX
> 2020 vehicle thefts per 100K people: 367.5
> Total vehicle thefts: 688 — 123rd highest of 292 metros
> Property crimes per 100K people: 2,167.9 — 107th highest of 276 metros
> Total property crimes: 4,058 — 115th lowest of 276 metros
> Population: 182,782
[in-text-ad-2]

46. Hanford-Corcoran, CA
> 2020 vehicle thefts per 100K people: 367.7
> Total vehicle thefts: 557 — 141st highest of 292 metros
> Property crimes per 100K people: 1,654.4 — 86th lowest of 276 metros
> Total property crimes: 2,506 — 61st lowest of 276 metros
> Population: 152,940

45. St. Louis, MO-IL
> 2020 vehicle thefts per 100K people: 368.6
> Total vehicle thefts: 10,327 — 10th highest of 292 metros
> Property crimes per 100K people: N/A
> Total property crimes: N/A
> Population: 2,801,423
[in-text-ad]

44. Las Vegas-Henderson-Paradise, NV
> 2020 vehicle thefts per 100K people: 370.1
> Total vehicle thefts: 8,564 — 15th highest of 292 metros
> Property crimes per 100K people: 2,046.5 — 133rd highest of 276 metros
> Total property crimes: 47,356 — 20th highest of 276 metros
> Population: 2,266,715
[recirclink id=1000581]

43. Houston-The Woodlands-Sugar Land, TX
> 2020 vehicle thefts per 100K people: 374.3
> Total vehicle thefts: 26,877 — 3rd highest of 292 metros
> Property crimes per 100K people: 2,617.4 — 58th highest of 276 metros
> Total property crimes: 187,935 — 2nd highest of 276 metros
> Population: 7,066,140

42. Greeley, CO
> 2020 vehicle thefts per 100K people: 377.6
> Total vehicle thefts: 1,251 — 72nd highest of 292 metros
> Property crimes per 100K people: 2,162.8 — 109th highest of 276 metros
> Total property crimes: 7,165 — 106th highest of 276 metros
> Population: 324,492
[in-text-ad-2]

41. Stockton, CA
> 2020 vehicle thefts per 100K people: 379.6
> Total vehicle thefts: 2,897 — 39th highest of 292 metros
> Property crimes per 100K people: 2,332.8 — 84th highest of 276 metros
> Total property crimes: 17,805 — 49th highest of 276 metros
> Population: 762,148
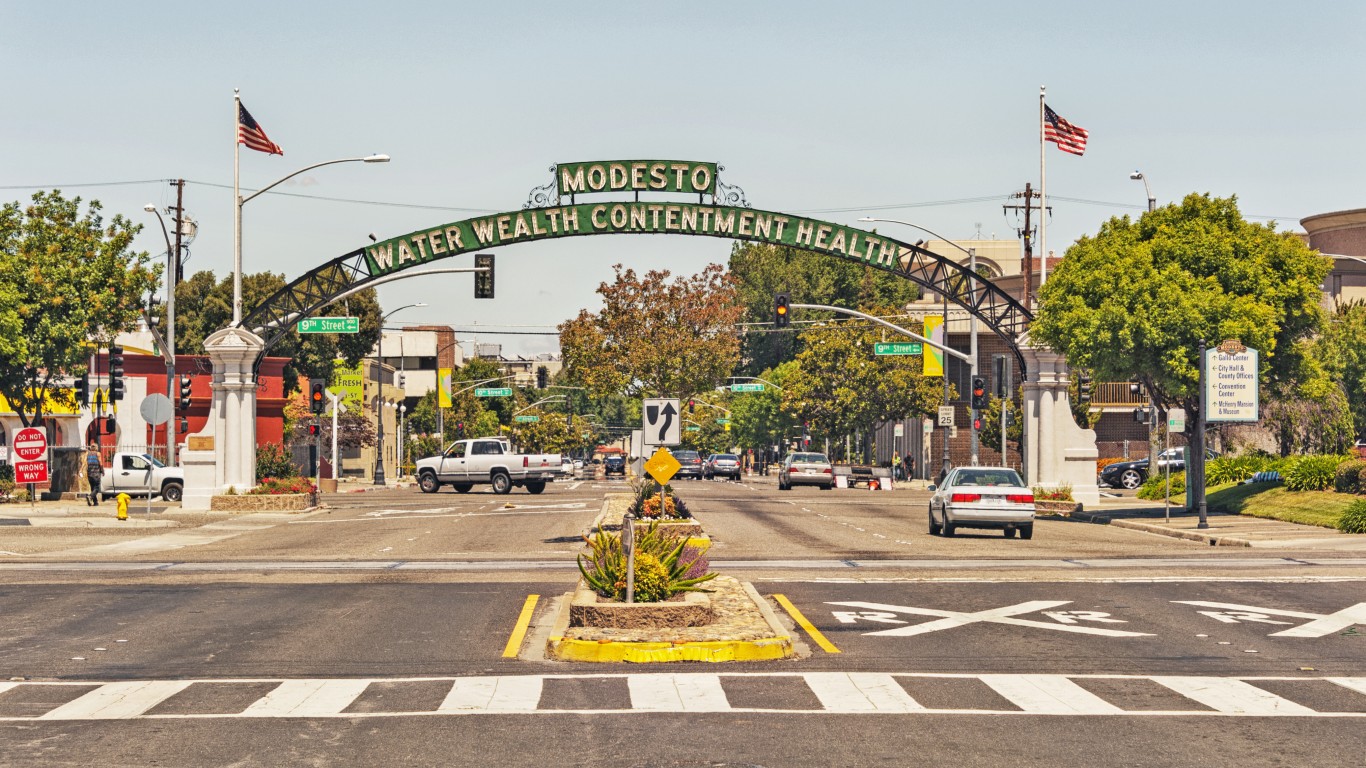
40. Modesto, CA
> 2020 vehicle thefts per 100K people: 380.7
> Total vehicle thefts: 2,091 — 51st highest of 292 metros
> Property crimes per 100K people: 1,974.3 — 131st lowest of 276 metros
> Total property crimes: 10,843 — 75th highest of 276 metros
> Population: 550,660
[in-text-ad]

39. Sioux Falls, SD
> 2020 vehicle thefts per 100K people: 381.0
> Total vehicle thefts: 1,040 — 86th highest of 292 metros
> Property crimes per 100K people: 2,524.2 — 65th highest of 276 metros
> Total property crimes: 6,891 — 111th highest of 276 metros
> Population: 268,833
[recirclink id=1007332]

38. Columbia, SC
> 2020 vehicle thefts per 100K people: 381.6
> Total vehicle thefts: 3,234 — 37th highest of 292 metros
> Property crimes per 100K people: 3,272.0 — 21st highest of 276 metros
> Total property crimes: 27,730 — 35th highest of 276 metros
> Population: 839,039

37. Colorado Springs, CO
> 2020 vehicle thefts per 100K people: 384.9
> Total vehicle thefts: 2,896 — 40th highest of 292 metros
> Property crimes per 100K people: 2,653.0 — 55th highest of 276 metros
> Total property crimes: 19,960 — 46th highest of 276 metros
> Population: 745,791
[in-text-ad-2]

36. Visalia, CA
> 2020 vehicle thefts per 100K people: 388.2
> Total vehicle thefts: 1,802 — 59th highest of 292 metros
> Property crimes per 100K people: 2,025.2 — 135th highest of 276 metros
> Total property crimes: 9,400 — 84th highest of 276 metros
> Population: 466,195

35. Oklahoma City, OK
> 2020 vehicle thefts per 100K people: 393.3
> Total vehicle thefts: 5,613 — 22nd highest of 292 metros
> Property crimes per 100K people: 2,916.2 — 37th highest of 276 metros
> Total property crimes: 41,616 — 24th highest of 276 metros
> Population: 1,408,950
[in-text-ad]

34. Anchorage, AK
> 2020 vehicle thefts per 100K people: 393.8
> Total vehicle thefts: 1,202 — 75th highest of 292 metros
> Property crimes per 100K people: 3,404.7 — 17th highest of 276 metros
> Total property crimes: 10,393 — 79th highest of 276 metros
> Population: 396,317
[recirclink id=1011842]

33. Lubbock, TX
> 2020 vehicle thefts per 100K people: 399.5
> Total vehicle thefts: 1,297 — 70th highest of 292 metros
> Property crimes per 100K people: 3,682.4 — 7th highest of 276 metros
> Total property crimes: 11,956 — 72nd highest of 276 metros
> Population: 321,982
32. Joplin, MO
> 2020 vehicle thefts per 100K people: 403.0
> Total vehicle thefts: 725 — 118th highest of 292 metros
> Property crimes per 100K people: 3,531.9 — 14th highest of 276 metros
> Total property crimes: 6,354 — 119th highest of 276 metros
> Population: 179,564
[in-text-ad-2]
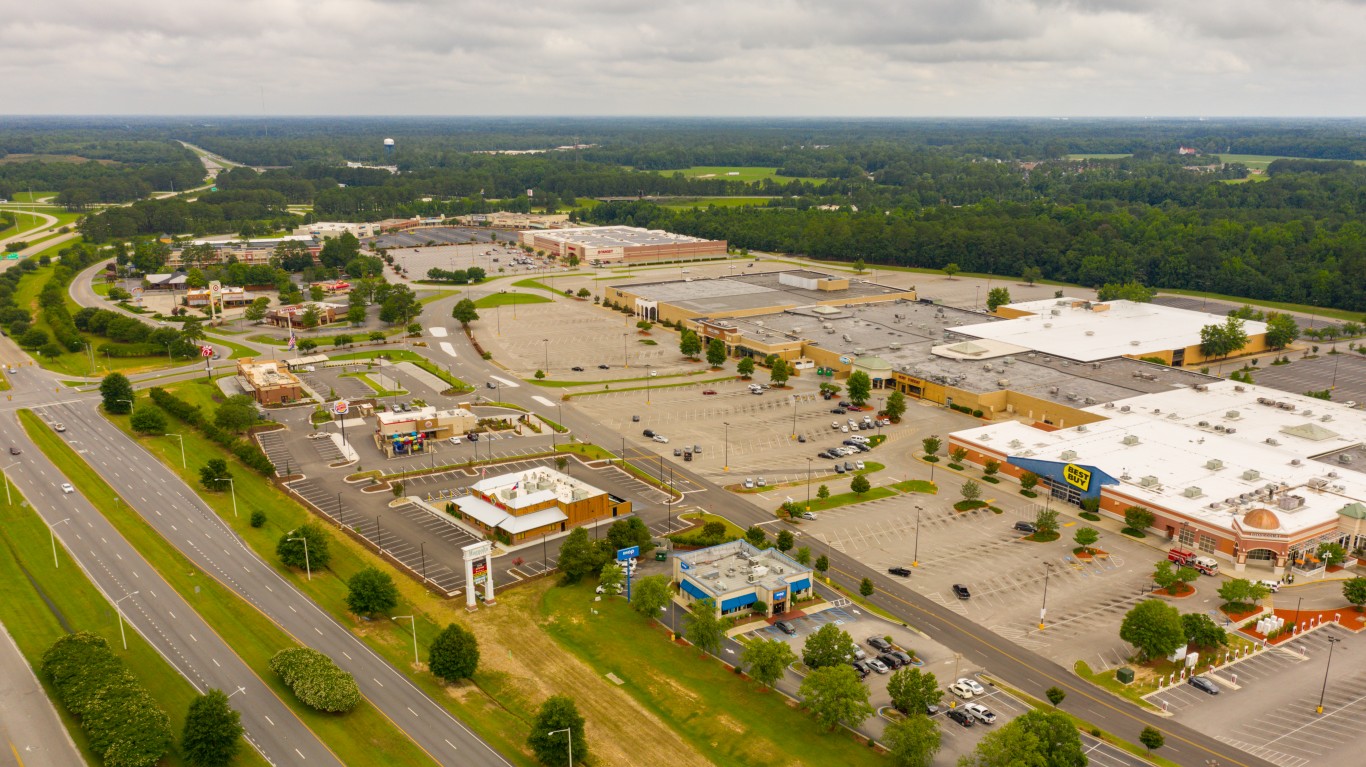
31. Florence, SC
> 2020 vehicle thefts per 100K people: 403.8
> Total vehicle thefts: 828 — 112th highest of 292 metros
> Property crimes per 100K people: 3,600.8 — 10th highest of 276 metros
> Total property crimes: 7,384 — 102nd highest of 276 metros
> Population: 204,911

30. Kalamazoo-Portage, MI
> 2020 vehicle thefts per 100K people: 404.1
> Total vehicle thefts: 1,074 — 81st highest of 292 metros
> Property crimes per 100K people: 3,306.6 — 18th highest of 276 metros
> Total property crimes: 8,789 — 90th highest of 276 metros
> Population: 265,066
[in-text-ad]
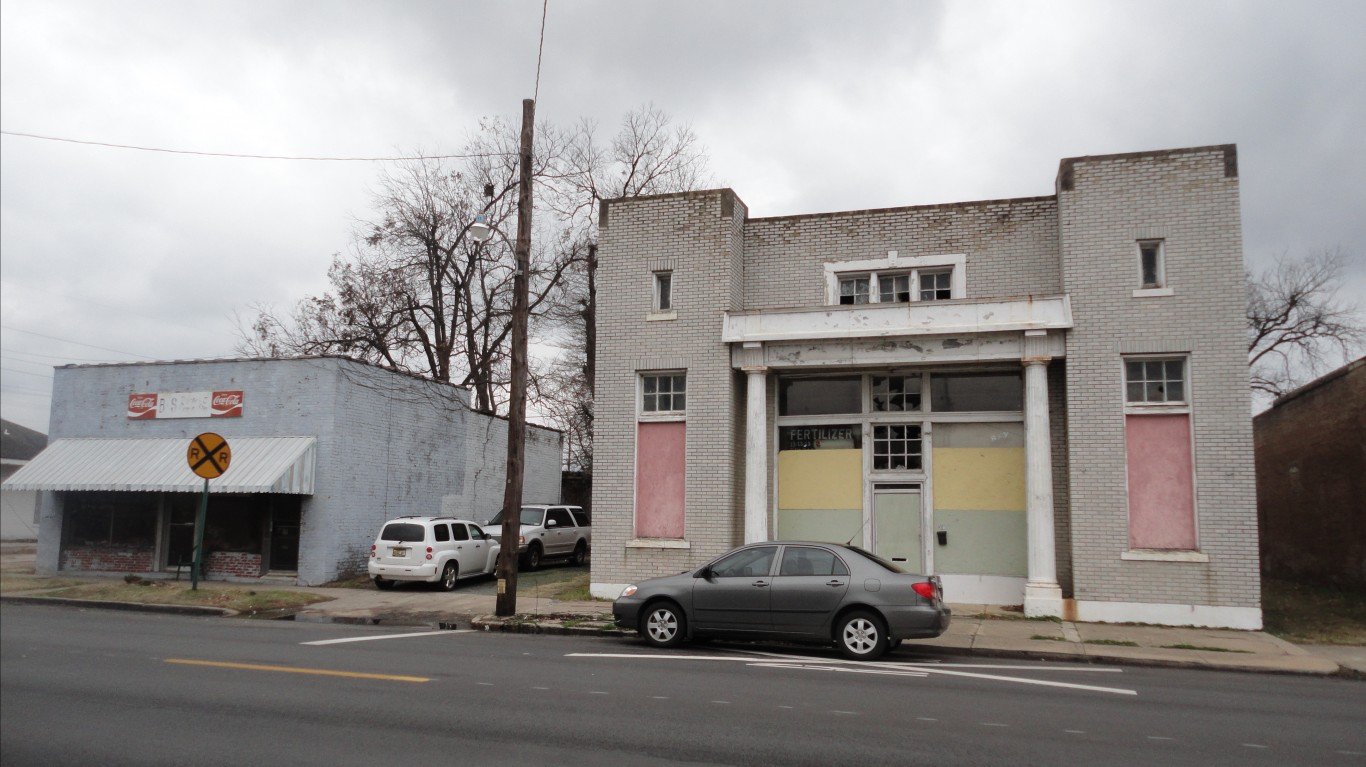
29. Pine Bluff, AR
> 2020 vehicle thefts per 100K people: 404.4
> Total vehicle thefts: 350 — 114th lowest of 292 metros
> Property crimes per 100K people: 3,048.3 — 28th highest of 276 metros
> Total property crimes: 2,638 — 66th lowest of 276 metros
> Population: 89,437
[recirclink id=1011738]

28. Rapid City, SD
> 2020 vehicle thefts per 100K people: 405.9
> Total vehicle thefts: 584 — 136th highest of 292 metros
> Property crimes per 100K people: 2,971.1 — 32nd highest of 276 metros
> Total property crimes: 4,275 — 120th lowest of 276 metros
> Population: 142,191

27. Fresno, CA
> 2020 vehicle thefts per 100K people: 408.5
> Total vehicle thefts: 4,072 — 31st highest of 292 metros
> Property crimes per 100K people: 2,480.5 — 71st highest of 276 metros
> Total property crimes: 24,724 — 37th highest of 276 metros
> Population: 999,101
[in-text-ad-2]
26. Santa Maria-Santa Barbara, CA
> 2020 vehicle thefts per 100K people: 413.2
> Total vehicle thefts: 1,837 — 57th highest of 292 metros
> Property crimes per 100K people: 1,985.6 — 134th lowest of 276 metros
> Total property crimes: 8,827 — 89th highest of 276 metros
> Population: 446,499

25. Omaha-Council Bluffs, NE-IA
> 2020 vehicle thefts per 100K people: 420.2
> Total vehicle thefts: 4,012 — 32nd highest of 292 metros
> Property crimes per 100K people: 2,280.9 — 90th highest of 276 metros
> Total property crimes: 21,780 — 40th highest of 276 metros
> Population: 949,726
[in-text-ad]

24. Yakima, WA
> 2020 vehicle thefts per 100K people: 425.5
> Total vehicle thefts: 1,067 — 83rd highest of 292 metros
> Property crimes per 100K people: 2,725.4 — 50th highest of 276 metros
> Total property crimes: 6,835 — 113th highest of 276 metros
> Population: 250,873
[recirclink id=997124]
23. Riverside-San Bernardino-Ontario, CA
> 2020 vehicle thefts per 100K people: 434.7
> Total vehicle thefts: 20,222 — 5th highest of 292 metros
> Property crimes per 100K people: 1,984.5 — 133rd lowest of 276 metros
> Total property crimes: 92,307 — 8th highest of 276 metros
> Population: 4,650,631

22. Amarillo, TX
> 2020 vehicle thefts per 100K people: 439.6
> Total vehicle thefts: 1,168 — 78th highest of 292 metros
> Property crimes per 100K people: 3,042.5 — 29th highest of 276 metros
> Total property crimes: 8,083 — 96th highest of 276 metros
> Population: 269,447
[in-text-ad-2]

21. Memphis, TN-MS-AR
> 2020 vehicle thefts per 100K people: 445.0
> Total vehicle thefts: 6,001 — 20th highest of 292 metros
> Property crimes per 100K people: 3,718.5 — 6th highest of 276 metros
> Total property crimes: 50,144 — 13th highest of 276 metros
> Population: 1,344,910

20. Los Angeles-Long Beach-Anaheim, CA
> 2020 vehicle thefts per 100K people: 448.2
> Total vehicle thefts: 58,823 — the highest of 292 metros
> Property crimes per 100K people: 2,095.1 — 123rd highest of 276 metros
> Total property crimes: 274,976 — the highest of 276 metros
> Population: 13,214,799
[in-text-ad]

19. Seattle-Tacoma-Bellevue, WA
> 2020 vehicle thefts per 100K people: 457.2
> Total vehicle thefts: 18,428 — 6th highest of 292 metros
> Property crimes per 100K people: 3,156.9 — 23rd highest of 276 metros
> Total property crimes: 127,233 — 5th highest of 276 metros
> Population: 3,979,845
[recirclink id=1000581]

18. Portland-Vancouver-Hillsboro, OR-WA
> 2020 vehicle thefts per 100K people: 471.6
> Total vehicle thefts: 11,845 — 9th highest of 292 metros
> Property crimes per 100K people: 2,678.4 — 52nd highest of 276 metros
> Total property crimes: 67,267 — 10th highest of 276 metros
> Population: 2,493,221

17. Salem, OR
> 2020 vehicle thefts per 100K people: 480.4
> Total vehicle thefts: 2,098 — 50th highest of 292 metros
> Property crimes per 100K people: 2,853.6 — 40th highest of 276 metros
> Total property crimes: 12,462 — 67th highest of 276 metros
> Population: 433,903
[in-text-ad-2]

16. Merced, CA
> 2020 vehicle thefts per 100K people: 485.4
> Total vehicle thefts: 1,346 — 69th highest of 292 metros
> Property crimes per 100K people: 2,146.0 — 116th highest of 276 metros
> Total property crimes: 5,951 — 126th highest of 276 metros
> Population: 277,680

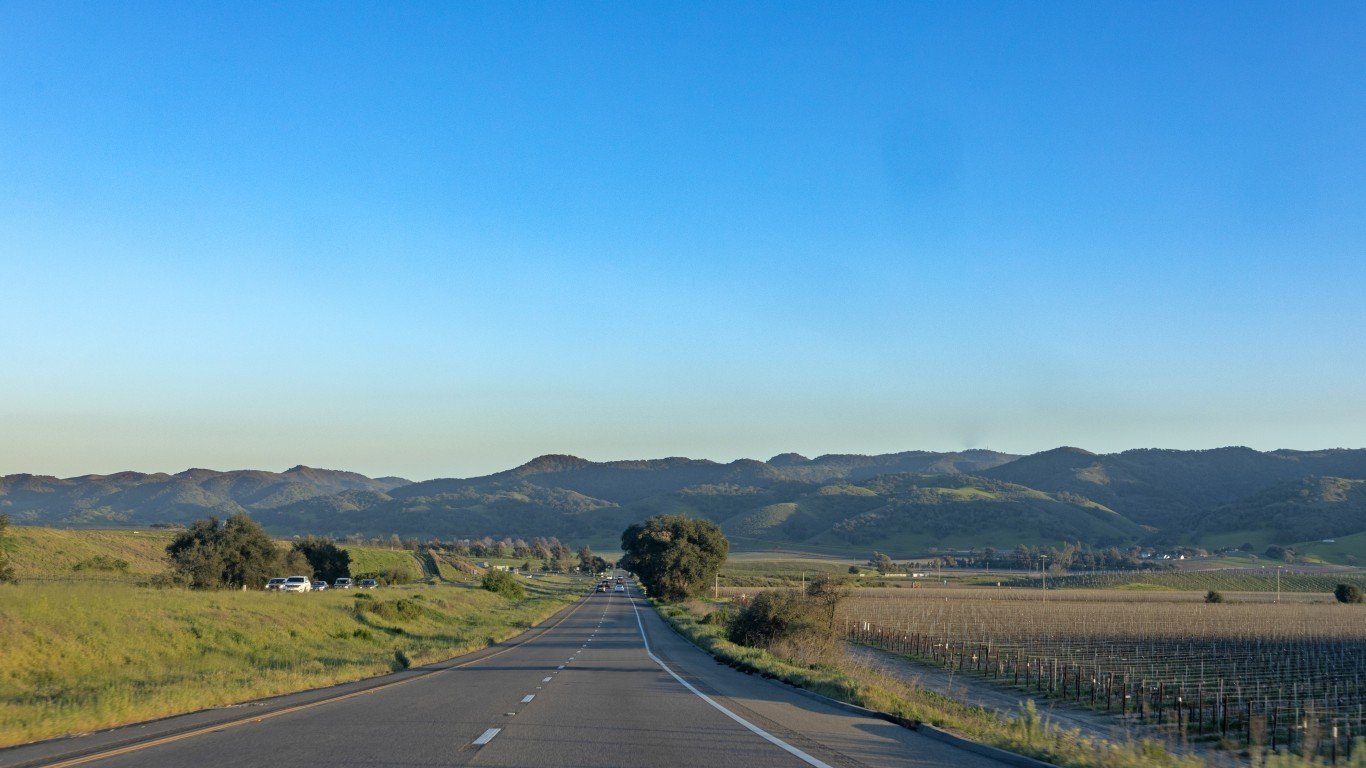
15. Vallejo, CA
> 2020 vehicle thefts per 100K people: 501.8
> Total vehicle thefts: 2,243 — 47th highest of 292 metros
> Property crimes per 100K people: 2,391.1 — 77th highest of 276 metros
> Total property crimes: 10,689 — 77th highest of 276 metros
> Population: 447,643
[in-text-ad]

14. San Jose-Sunnyvale-Santa Clara, CA
> 2020 vehicle thefts per 100K people: 506.0
> Total vehicle thefts: 10,058 — 12th highest of 292 metros
> Property crimes per 100K people: 2,226.6 — 96th highest of 276 metros
> Total property crimes: 44,263 — 22nd highest of 276 metros
> Population: 1,990,660
[recirclink id=1007332]

13. Chattanooga, TN-GA
> 2020 vehicle thefts per 100K people: 513.6
> Total vehicle thefts: 2,923 — 38th highest of 292 metros
> Property crimes per 100K people: 3,070.2 — 27th highest of 276 metros
> Total property crimes: 17,474 — 50th highest of 276 metros
> Population: 566,153

12. Odessa, TX
> 2020 vehicle thefts per 100K people: 517.5
> Total vehicle thefts: 876 — 103rd highest of 292 metros
> Property crimes per 100K people: 2,956.8 — 33rd highest of 276 metros
> Total property crimes: 5,005 — 138th lowest of 276 metros
> Population: 166,223
[in-text-ad-2]

11. St. Joseph, MO-KS
> 2020 vehicle thefts per 100K people: 530.7
> Total vehicle thefts: 663 — 125th highest of 292 metros (tied)
> Property crimes per 100K people: 3,541.3 — 13th highest of 276 metros
> Total property crimes: 4,424 — 124th lowest of 276 metros
> Population: 125,411

10. Tulsa, OK
> 2020 vehicle thefts per 100K people: 534.9
> Total vehicle thefts: 5,378 — 24th highest of 292 metros
> Property crimes per 100K people: 3,109.7 — 24th highest of 276 metros
> Total property crimes: 31,267 — 31st highest of 276 metros
> Population: 998,655
[in-text-ad]
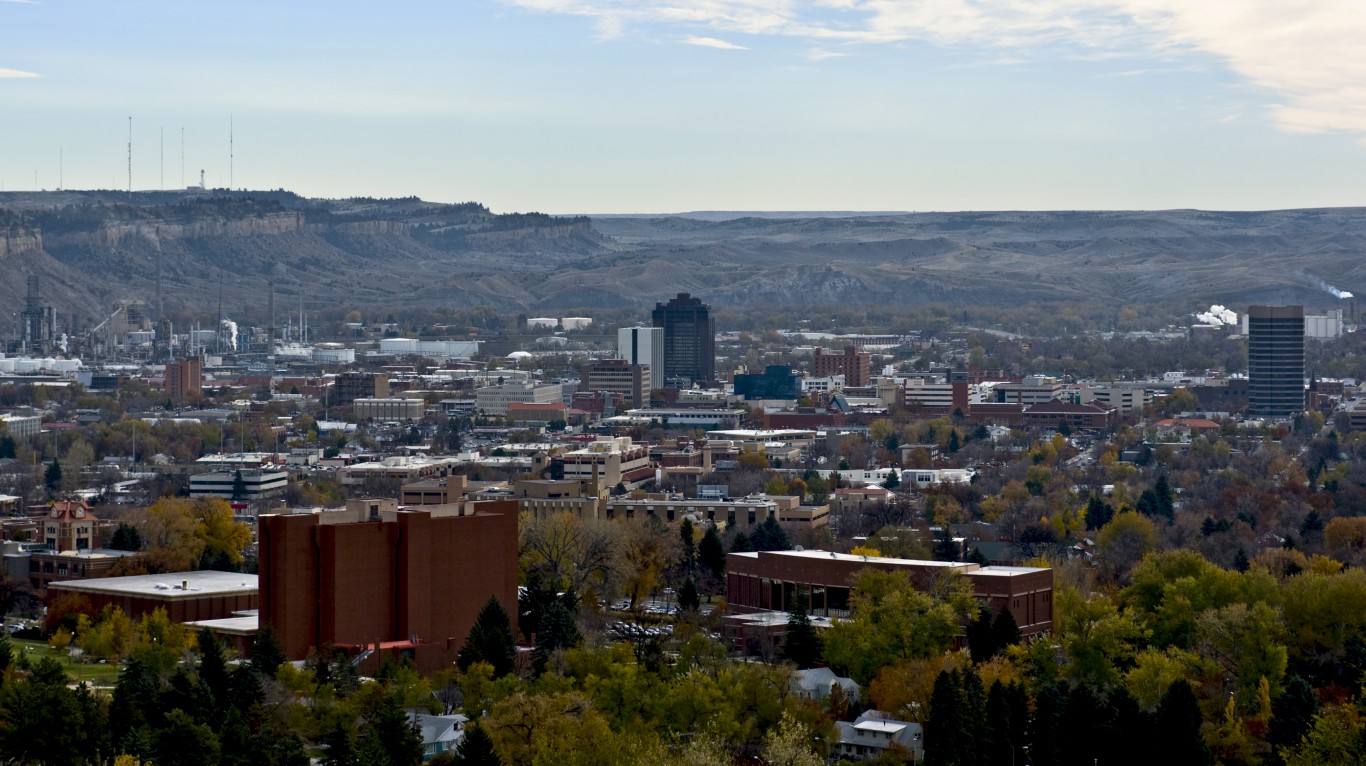
9. Billings, MT
> 2020 vehicle thefts per 100K people: 543.3
> Total vehicle thefts: 998 — 91st highest of 292 metros (tied)
> Property crimes per 100K people: 3,471.9 — 16th highest of 276 metros
> Total property crimes: 6,378 — 118th highest of 276 metros
> Population: 181,667
[recirclink id=1011842]

8. Salt Lake City, UT
> 2020 vehicle thefts per 100K people: 544.4
> Total vehicle thefts: 6,785 — 17th highest of 292 metros
> Property crimes per 100K people: 3,816.8 — 4th highest of 276 metros
> Total property crimes: 47,566 — 18th highest of 276 metros
> Population: 1,232,696
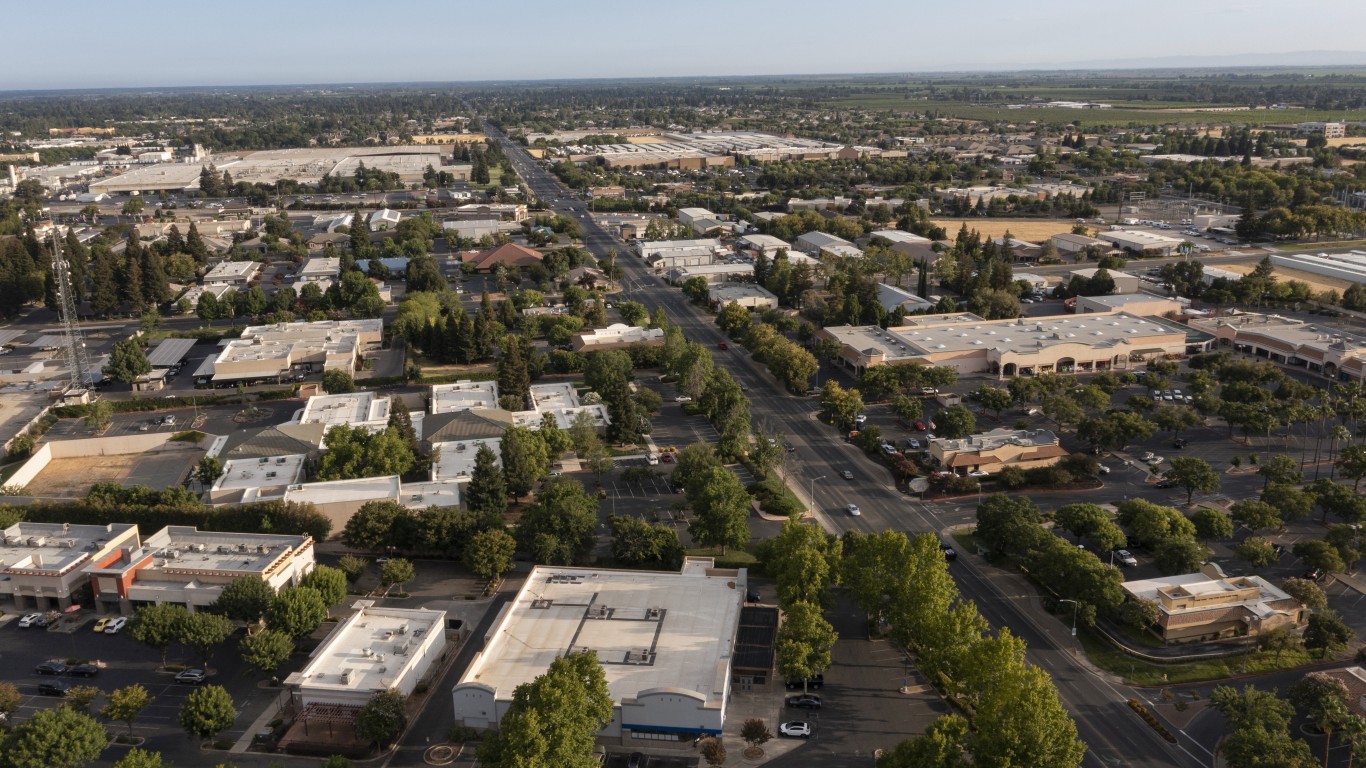
7. Yuba City, CA
> 2020 vehicle thefts per 100K people: 594.2
> Total vehicle thefts: 1,039 — 87th highest of 292 metros
> Property crimes per 100K people: 2,439.7 — 73rd highest of 276 metros
> Total property crimes: 4,266 — 119th lowest of 276 metros
> Population: 175,639
[in-text-ad-2]

6. San Francisco-Oakland-Berkeley, CA
> 2020 vehicle thefts per 100K people: 604.2
> Total vehicle thefts: 28,575 — 2nd highest of 292 metros
> Property crimes per 100K people: 3,008.2 — 30th highest of 276 metros
> Total property crimes: 142,267 — 3rd highest of 276 metros
> Population: 4,731,803
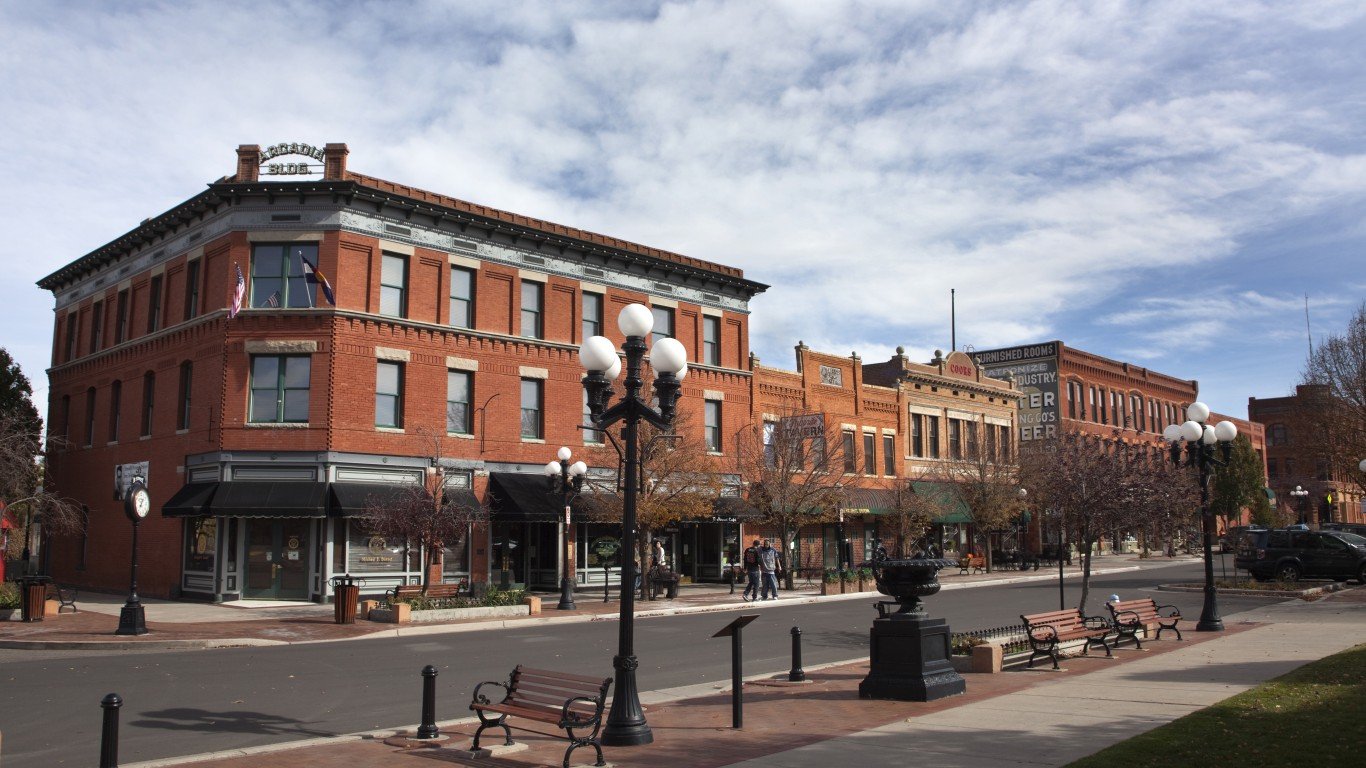
5. Pueblo, CO
> 2020 vehicle thefts per 100K people: 640.2
> Total vehicle thefts: 1,078 — 80th highest of 292 metros
> Property crimes per 100K people: N/A
> Total property crimes: N/A
> Population: 168,424
[in-text-ad]

4. Fairbanks, AK
> 2020 vehicle thefts per 100K people: 643.9
> Total vehicle thefts: 212 — 69th lowest of 292 metros
> Property crimes per 100K people: 4,152.2 — the highest of 276 metros
> Total property crimes: 1,367 — 16th lowest of 276 metros
> Population: 96,849
[recirclink id=1011738]

3. Albuquerque, NM
> 2020 vehicle thefts per 100K people: 662.5
> Total vehicle thefts: 6,120 — 19th highest of 292 metros
> Property crimes per 100K people: 3,654.1 — 9th highest of 276 metros
> Total property crimes: 33,754 — 30th highest of 276 metros
> Population: 914,480

2. Denver-Aurora-Lakewood, CO
> 2020 vehicle thefts per 100K people: 734.2
> Total vehicle thefts: 22,011 — 4th highest of 292 metros
> Property crimes per 100K people: 3,302.7 — 19th highest of 276 metros
> Total property crimes: 99,017 — 7th highest of 276 metros
> Population: 2,967,239
[in-text-ad-2]
1. Bakersfield, CA
> 2020 vehicle thefts per 100K people: 839.4
> Total vehicle thefts: 7,537 — 16th highest of 292 metros
> Property crimes per 100K people: 3,106.0 — 25th highest of 276 metros
> Total property crimes: 27,890 — 34th highest of 276 metros
> Population: 900,202
Methodology
To determine the metro area where your car is most likely to be stolen, 24/7 Wall St. reviewed motor vehicle theft figures from the FBI’s 2020 Uniform Crime Report.
Limited data was available in the 2020 UCR for areas in Alabama, Maryland, Pennsylvania, and Illinois, though these states were not excluded from analysis. Only metro areas for which the boundaries defined by the FBI match the boundaries as defined by the U.S. Census Bureau were considered.
Data for property crime — a category that includes larceny-theft, burglary, and motor vehicle theft — also came from the 2020 FBI UCR. Population figures are one-year estimates from the U.S. Census Bureau’s 2019 American Community Survey. However, these estimates were not used to calculate crime rates. Crime rates per 100,000 people were calculated using population figures provided by the FBI in the 2020 UCR.
Contact [email protected] for any questions or corrections.