The terms wealth and income inequality have been used frequently to describe the widening gulf separating rich and poor across the globe and within individual countries. To find the extent of wealth inequality, one measure used is the ratio between the share of wealth held by the top 10% of earners and the share of wealth held by the bottom 50% of earners, both worldwide and in a country.
Worldwide, the top 10% of earners currently take home 52% of global income, while the poorest half of the population earn 8.5% of global income, according to WID.world’s 2022 World Inequity Report. On average, an individual adult in the poorest half makes $3,920 a year, compared to $122,100 per year an adult in the top 10% makes. (These are the countries with the biggest income gaps.)
Global wealth inequalities are even more pronounced. The richest 10% of the global population own 76% of all wealth, while the poorest half of the global population barely owns any wealth at all, at just 2%. On average, an individual adult in the poorest half of the population owns $4,100, while an individual at the top 10% owns $771,300 – or 188 times the wealth of an average individual in the bottom half.
While wealth inequality was significantly reduced in Western countries throughout much of the 20th century, inequalities have been on the rise nearly everywhere since the 1980s. The top 1% captured 38% of all additional wealth accumulated since the mid-1990s, compared to 2% captured by the bottom half.
To find the 30 countries with the worst wealth inequality, 24/7 Wall St. used iwealth inequality data from WID.world’s (World Inequality Database) 2022 World Inequality Report. In some countries, the bottom 50% have zero or even negative net wealth. For this reason, in consultation with wealth aggregates coordinator at WID, Luis Bauluz, we ranked countries by the wealth gap as measured by the ratio of the top 10% share of wealth to the bottom 90% share of wealth. We provided the top 10% to bottom 50% when applicable.
For example, the U.S., which ranks 29th, has a top 10% to bottom 90% ratio of 22.17. This means that, on average, an individual adult in the top 10% holds 22 times more wealth than an individual adult in the bottom 90%.
The wealth gap as measured by the top 10% to bottom 50% in the U.S. is significantly wider, with the ratio standing at 240.27. This means that, on average, an individual in the top 10% holds 240 times more wealth than an individual in the bottom 50%. The share of household wealth among the top 10% is over 71%, while the share of wealth of the bottom 50% is not even 1.5%.
In Lebanon, the wealth gap between the top 10% and bottom 50% stands at more than 2,800 times. The top 10% hold 79% of the wealth, while the bottom 50% hold a scant 0.14%. Lebanon’s GNI per capita is $11,840.
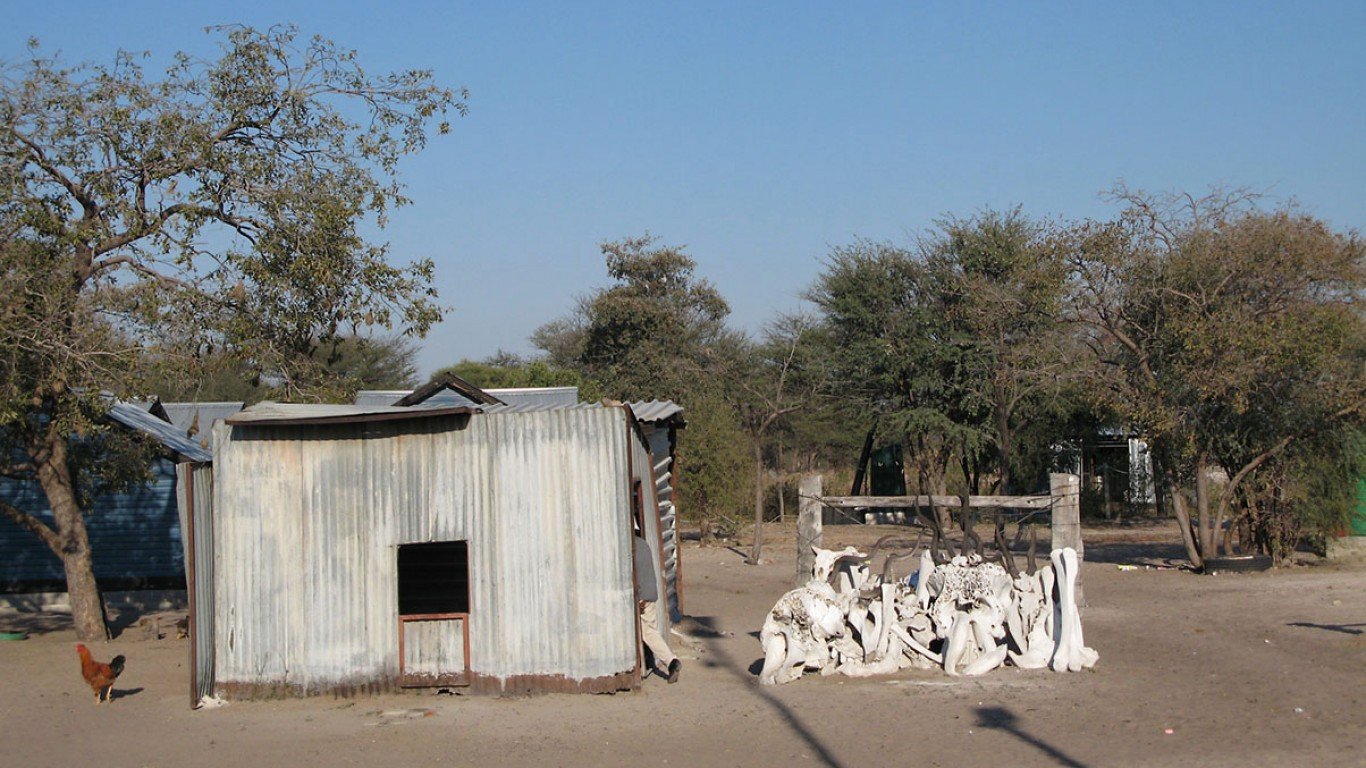
South Africa has the worst wealth gap between the top 10% and the bottom 90%, at nearly 54. While the share of household wealth the top 10% capture stands at nearly 86%, the highest of countries considered, the share of household wealth the bottom 50% capture is negative, at -2.44%, the second lowest of countries considered.
Many of the countries on this list are poor, though not all, with the U.S. a notable exception, along with several countries in Asia and the Middle East. The U.S. GNI per capita is ninth highest of countries considered, at $64,610. (Despite being among the richest countries in the world, poverty exists in the U.S. This is the poorest town in every state.)
Click here to see the countries with the worst wealth inequality
Click here to read our detailed methodology

30. Seychelles
> Wealth gap, top 10% / bottom 90%: 19.27
> Wealth gap, top 10% / bottom 50%: 113.24 — 19 highest of 158 countries
> Share of household wealth top 10%: 68.17% — #30 highest of 174 countries
> Share of household wealth mid 40%: 28.83% — #31 lowest of 174 countries
> Share of household wealth bottom 50%: 3.01% — #34 lowest of 174 countries
> GNI per capita, 2020: $24,140 — #51 highest of 156 countries
[in-text-ad]

29. United States
> Wealth gap, top 10% / bottom 90%: 22.17
> Wealth gap, top 10% / bottom 50%: 240.27 — 9 highest of 158 countries
> Share of household wealth top 10%: 71.12% — #29 highest of 174 countries
> Share of household wealth mid 40%: 27.39% — #30 lowest of 174 countries
> Share of household wealth bottom 50%: 1.48% — #25 lowest of 174 countries
> GNI per capita, 2020: $64,610 — #9 highest of 156 countries
[recirclink id=1033345]
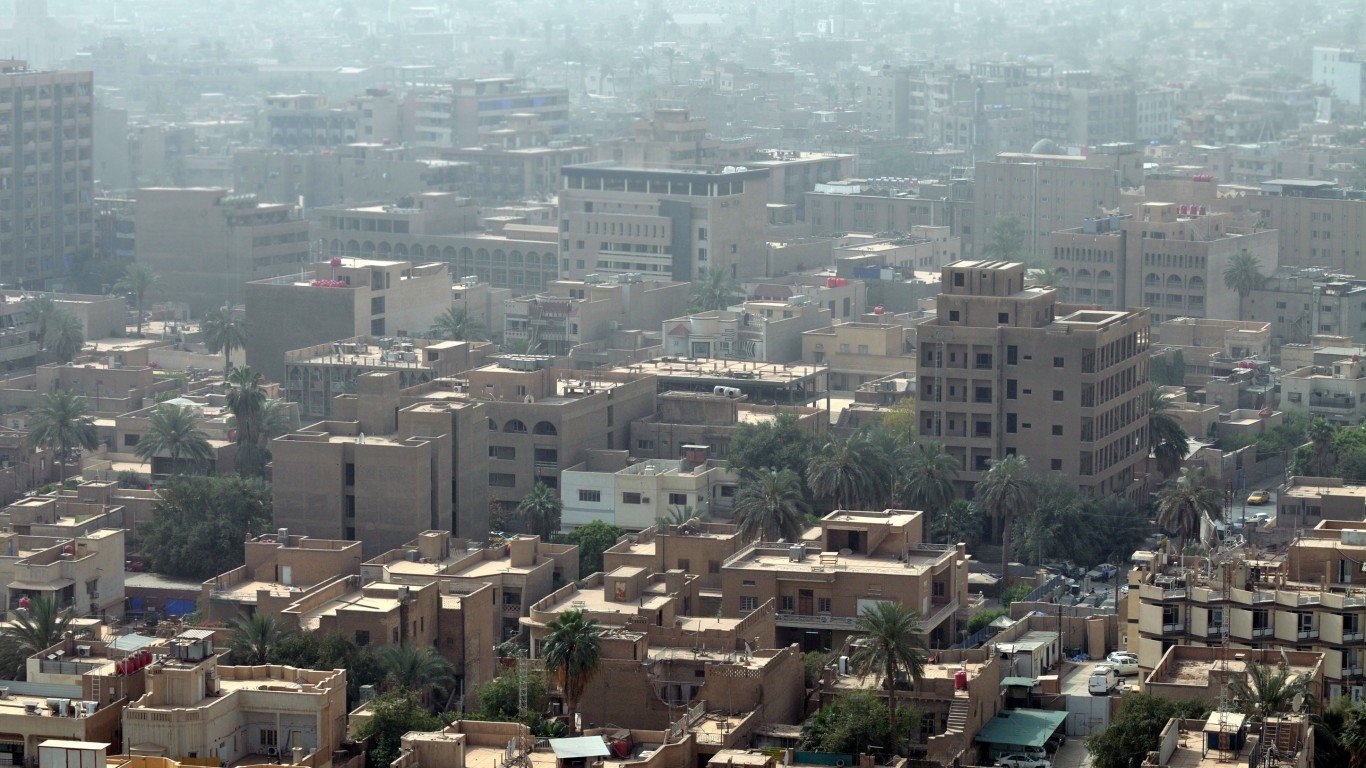
28. Iraq
> Wealth gap, top 10% / bottom 90%: 22.96
> Wealth gap, top 10% / bottom 50%: 193.12 — 14 highest of 158 countries
> Share of household wealth top 10%: 71.84% — #28 highest of 174 countries
> Share of household wealth mid 40%: 26.30% — #29 lowest of 174 countries
> Share of household wealth bottom 50%: 1.86% — #30 lowest of 174 countries
> GNI per capita, 2020: $9,400 — #63 lowest of 156 countries

27. Zimbabwe
> Wealth gap, top 10% / bottom 90%: 23.20
> Wealth gap, top 10% / bottom 50%: 155.95 — 16 highest of 158 countries
> Share of household wealth top 10%: 72.05% — #27 highest of 174 countries
> Share of household wealth mid 40%: 25.64% — #24 lowest of 174 countries
> Share of household wealth bottom 50%: 2.31% — #33 lowest of 174 countries
> GNI per capita, 2020: $3,420 — #29 lowest of 156 countries
[in-text-ad-2]
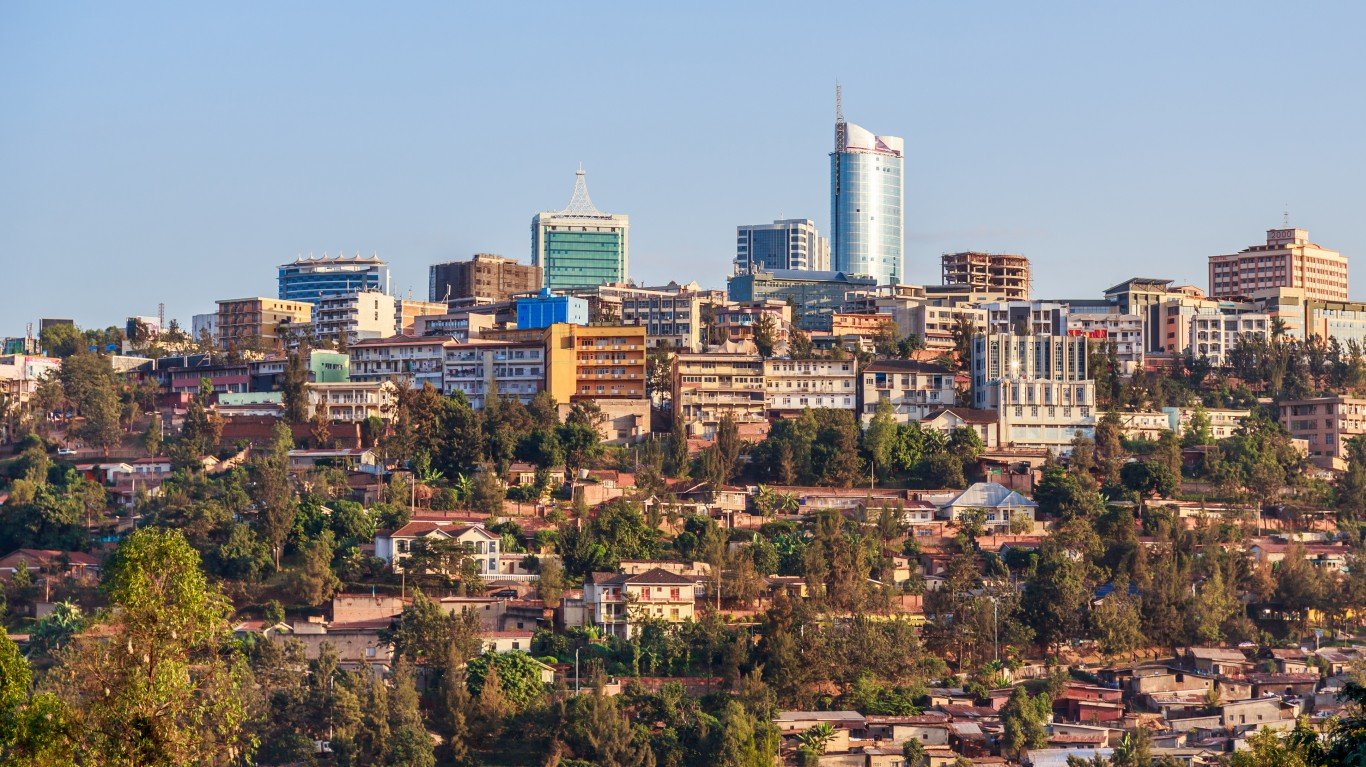
26. Rwanda
> Wealth gap, top 10% / bottom 90%: 23.43
> Wealth gap, top 10% / bottom 50%: 208.82 — 13 highest of 158 countries
> Share of household wealth top 10%: 72.25% — #26 highest of 174 countries
> Share of household wealth mid 40%: 26.02% — #28 lowest of 174 countries
> Share of household wealth bottom 50%: 1.73% — #29 lowest of 174 countries
> GNI per capita, 2020: $2,160 — #16 lowest of 156 countries

25. Saudi Arabia
> Wealth gap, top 10% / bottom 90%: 23.55
> Wealth gap, top 10% / bottom 50%: 212.82 — 12 highest of 158 countries
> Share of household wealth top 10%: 72.36% — #25 highest of 174 countries
> Share of household wealth mid 40%: 25.95% — #27 lowest of 174 countries
> Share of household wealth bottom 50%: 1.70% — #28 lowest of 174 countries
> GNI per capita, 2020: $47,770 — #20 highest of 156 countries
[in-text-ad]

24. Kuwait
> Wealth gap, top 10% / bottom 90%: 23.98
> Wealth gap, top 10% / bottom 50%: 230.09 — 10 highest of 158 countries
> Share of household wealth top 10%: 72.71% — #24 highest of 174 countries
> Share of household wealth mid 40%: 25.71% — #25 lowest of 174 countries
> Share of household wealth bottom 50%: 1.58% — #26 lowest of 174 countries
> GNI per capita, 2019: $58,930 — #11 highest of 156 countries
[recirclink id=1029026]

23. Qatar
> Wealth gap, top 10% / bottom 90%: 24.64
> Wealth gap, top 10% / bottom 50%: 188.79 — 15 highest of 158 countries
> Share of household wealth top 10%: 73.25% — #23 highest of 174 countries
> Share of household wealth mid 40%: 24.82% — #22 lowest of 174 countries
> Share of household wealth bottom 50%: 1.94% — #31 lowest of 174 countries
> GNI per capita, 2020: $88,030 — #1 highest of 156 countries

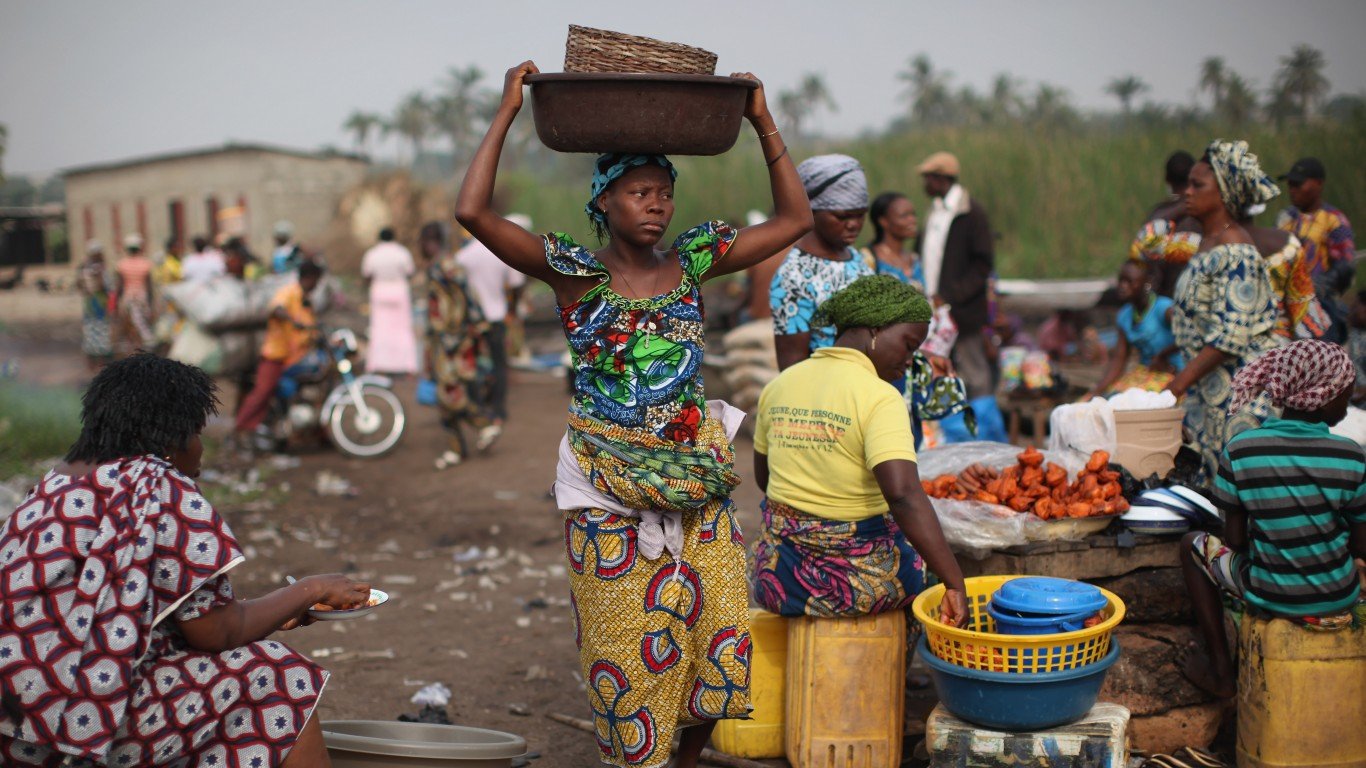
22. Benin
> Wealth gap, top 10% / bottom 90%: 25.13
> Wealth gap, top 10% / bottom 50%: 287.62 — 6 highest of 158 countries
> Share of household wealth top 10%: 73.63% — #22 highest of 174 countries
> Share of household wealth mid 40%: 25.09% — #23 lowest of 174 countries
> Share of household wealth bottom 50%: 1.28% — #23 lowest of 174 countries
> GNI per capita, 2020: $3,470 — #30 lowest of 156 countries
[in-text-ad-2]

21. Thailand
> Wealth gap, top 10% / bottom 90%: 25.60
> Wealth gap, top 10% / bottom 50%: 217.62 — 11 highest of 158 countries
> Share of household wealth top 10%: 73.99% — #21 highest of 174 countries
> Share of household wealth mid 40%: 24.31% — #21 lowest of 174 countries
> Share of household wealth bottom 50%: 1.70% — #28 lowest of 174 countries
> GNI per capita, 2020: $17,710 — #61 highest of 156 countries

20. Russia
> Wealth gap, top 10% / bottom 90%: 25.78
> Wealth gap, top 10% / bottom 50%: 119.94 — 18 highest of 158 countries
> Share of household wealth top 10%: 74.12% — #20 highest of 174 countries
> Share of household wealth mid 40%: 22.79% — #15 lowest of 174 countries
> Share of household wealth bottom 50%: 3.09% — #38 lowest of 174 countries
> GNI per capita, 2020: $27,550 — #44 highest of 156 countries
[in-text-ad]

19. Oman
> Wealth gap, top 10% / bottom 90%: 26.02
> Wealth gap, top 10% / bottom 50%: 265.36 — 7 highest of 158 countries
> Share of household wealth top 10%: 74.30% — #19 highest of 174 countries
> Share of household wealth mid 40%: 24.30% — #20 lowest of 174 countries
> Share of household wealth bottom 50%: 1.40% — #24 lowest of 174 countries
> GNI per capita, 2019: $26,240 — #46 highest of 156 countries
[recirclink id=1025484]

18. Congo
> Wealth gap, top 10% / bottom 90%: 27.33
> Wealth gap, top 10% / bottom 50%: 501.53 — 5 highest of 158 countries
> Share of household wealth top 10%: 75.23% — #18 highest of 174 countries
> Share of household wealth mid 40%: 24.02% — #19 lowest of 174 countries
> Share of household wealth bottom 50%: 0.75% — #21 lowest of 174 countries
> GNI per capita, 2020: $3,060 — #24 lowest of 156 countries

17. Malawi
> Wealth gap, top 10% / bottom 90%: 28.42
> Wealth gap, top 10% / bottom 50%: 759.50 — 4 highest of 158 countries
> Share of household wealth top 10%: 75.95% — #17 highest of 174 countries
> Share of household wealth mid 40%: 23.55% — #18 lowest of 174 countries
> Share of household wealth bottom 50%: 0.50% — #20 lowest of 174 countries
> GNI per capita, 2020: $1,550 — #10 lowest of 156 countries
[in-text-ad-2]

16. United Arab Emirates
> Wealth gap, top 10% / bottom 90%: 28.96
> Wealth gap, top 10% / bottom 50%: 978.08 — 2 highest of 158 countries
> Share of household wealth top 10%: 76.29% — #16 highest of 174 countries
> Share of household wealth mid 40%: 23.32% — #17 lowest of 174 countries
> Share of household wealth bottom 50%: 0.39% — #18 lowest of 174 countries
> GNI per capita, 2020: $66,660 — #7 highest of 156 countries

15. Peru
> Wealth gap, top 10% / bottom 90%: 29.76
> Wealth gap, top 10% / bottom 50%: 959.75 — 3 highest of 158 countries
> Share of household wealth top 10%: 76.78% — #15 highest of 174 countries
> Share of household wealth mid 40%: 22.82% — #16 lowest of 174 countries
> Share of household wealth bottom 50%: 0.40% — #19 lowest of 174 countries
> GNI per capita, 2020: $11,510 — #71 lowest of 156 countries
[in-text-ad]
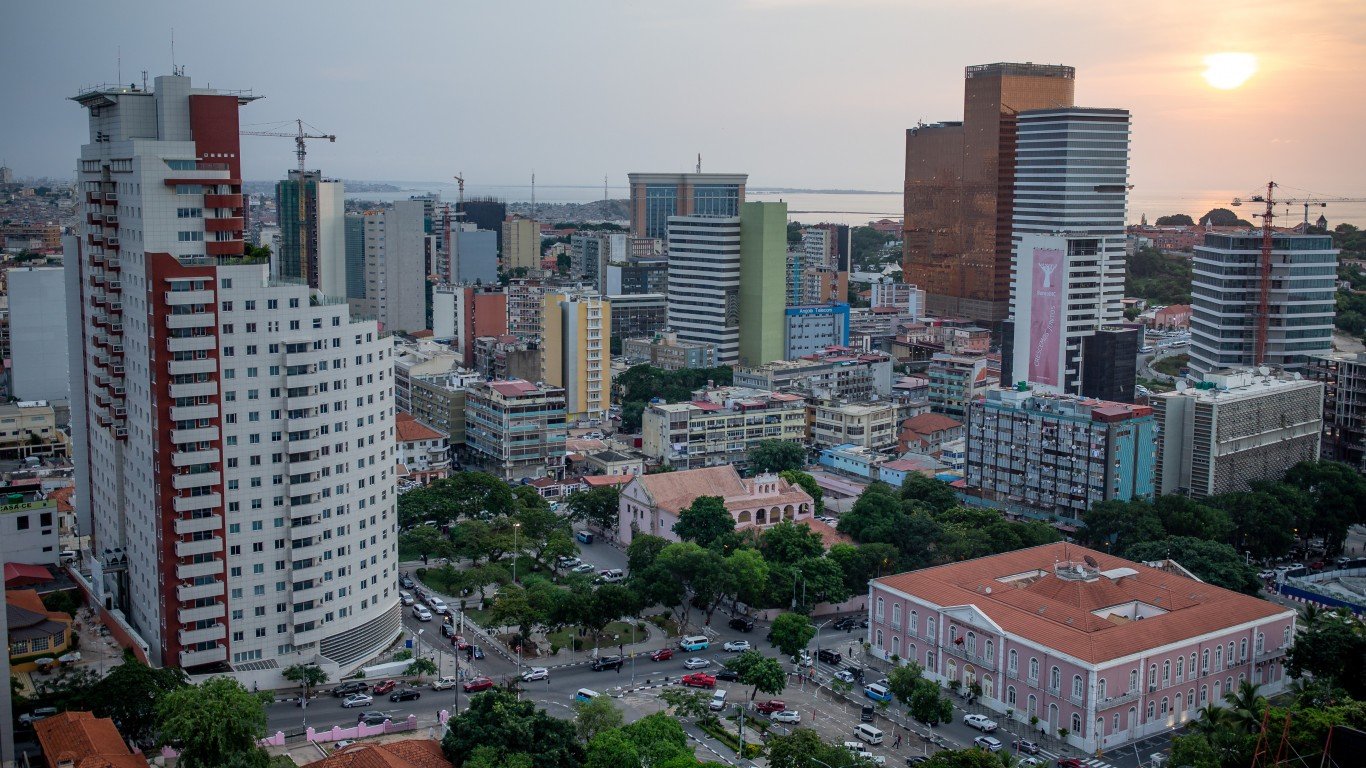
14. Angola
> Wealth gap, top 10% / bottom 90%: 31.05
> Wealth gap, top 10% / bottom 50%: N/A
> Share of household wealth top 10%: 77.53% — #14 highest of 174 countries
> Share of household wealth mid 40%: 22.51% — #14 lowest of 174 countries
> Share of household wealth bottom 50%: -0.04% — #16 lowest of 174 countries
> GNI per capita, 2020: $5,900 — #49 lowest of 156 countries
[recirclink id=1024476]
13. Botswana
> Wealth gap, top 10% / bottom 90%: 32.80
> Wealth gap, top 10% / bottom 50%: N/A
> Share of household wealth top 10%: 78.47% — #13 highest of 174 countries
> Share of household wealth mid 40%: 21.90% — #13 lowest of 174 countries
> Share of household wealth bottom 50%: -0.37% — #13 lowest of 174 countries
> GNI per capita, 2020: $15,490 — #68 highest of 156 countries

12. Lebanon
> Wealth gap, top 10% / bottom 90%: 33.17
> Wealth gap, top 10% / bottom 50%: 2,808.93 — 1 highest of 158 countries
> Share of household wealth top 10%: 78.65% — #12 highest of 174 countries
> Share of household wealth mid 40%: 21.20% — #10 lowest of 174 countries
> Share of household wealth bottom 50%: 0.14% — #17 lowest of 174 countries
> GNI per capita, 2020: $11,840 — #73 lowest of 156 countries
[in-text-ad-2]

11. Mexico
> Wealth gap, top 10% / bottom 90%: 33.27
> Wealth gap, top 10% / bottom 50%: N/A
> Share of household wealth top 10%: 78.71% — #11 highest of 174 countries
> Share of household wealth mid 40%: 21.49% — #11 lowest of 174 countries
> Share of household wealth bottom 50%: -0.20% — #15 lowest of 174 countries
> GNI per capita, 2020: $18,150 — #60 highest of 156 countries

10. Guinea-Bissau
> Wealth gap, top 10% / bottom 90%: 33.78
> Wealth gap, top 10% / bottom 50%: N/A
> Share of household wealth top 10%: 78.96% — #10 highest of 174 countries
> Share of household wealth mid 40%: 21.59% — #12 lowest of 174 countries
> Share of household wealth bottom 50%: -0.55% — #11 lowest of 174 countries
> GNI per capita, 2020: $1,980 — #13 lowest of 156 countries
[in-text-ad]

9. Zambia
> Wealth gap, top 10% / bottom 90%: 35.47
> Wealth gap, top 10% / bottom 50%: N/A
> Share of household wealth top 10%: 79.76% — #9 highest of 174 countries
> Share of household wealth mid 40%: 21.07% — #9 lowest of 174 countries
> Share of household wealth bottom 50%: -0.83% — #8 lowest of 174 countries
> GNI per capita, 2020: $3,360 — #27 lowest of 156 countries
[recirclink id=1023708]

8. Brazil
> Wealth gap, top 10% / bottom 90%: 35.58
> Wealth gap, top 10% / bottom 50%: N/A
> Share of household wealth top 10%: 79.81% — #8 highest of 174 countries
> Share of household wealth mid 40%: 20.55% — #5 lowest of 174 countries
> Share of household wealth bottom 50%: -0.36% — #14 lowest of 174 countries
> GNI per capita, 2020: $14,550 — #69 highest of 156 countries

7. Swaziland
> Wealth gap, top 10% / bottom 90%: 36.78
> Wealth gap, top 10% / bottom 50%: N/A
> Share of household wealth top 10%: 80.34% — #7 highest of 174 countries
> Share of household wealth mid 40%: 20.11% — #2 lowest of 174 countries
> Share of household wealth bottom 50%: -0.45% — #12 lowest of 174 countries
> GNI per capita, : No data
[in-text-ad-2]

6. Namibia
> Wealth gap, top 10% / bottom 90%: 36.87
> Wealth gap, top 10% / bottom 50%: N/A
> Share of household wealth top 10%: 80.38% — #6 highest of 174 countries
> Share of household wealth mid 40%: 20.68% — #8 lowest of 174 countries
> Share of household wealth bottom 50%: -1.06% — #7 lowest of 174 countries
> GNI per capita, 2020: $9,180 — #62 lowest of 156 countries

5. Chile
> Wealth gap, top 10% / bottom 90%: 36.99
> Wealth gap, top 10% / bottom 50%: N/A
> Share of household wealth top 10%: 80.43% — #5 highest of 174 countries
> Share of household wealth mid 40%: 20.14% — #3 lowest of 174 countries
> Share of household wealth bottom 50%: -0.57% — #10 lowest of 174 countries
> GNI per capita, 2020: $23,980 — #52 highest of 156 countries
[in-text-ad]
4. Mozambique
> Wealth gap, top 10% / bottom 90%: 37.01
> Wealth gap, top 10% / bottom 50%: N/A
> Share of household wealth top 10%: 80.44% — #4 highest of 174 countries
> Share of household wealth mid 40%: 20.64% — #7 lowest of 174 countries
> Share of household wealth bottom 50%: -1.08% — #6 lowest of 174 countries
> GNI per capita, 2020: $1,250 — #6 lowest of 156 countries
[recirclink id=1033345]
3. Central African Republic
> Wealth gap, top 10% / bottom 90%: 37.18
> Wealth gap, top 10% / bottom 50%: N/A
> Share of household wealth top 10%: 80.51% — #3 highest of 174 countries
> Share of household wealth mid 40%: 20.60% — #6 lowest of 174 countries
> Share of household wealth bottom 50%: -1.11% — #5 lowest of 174 countries
> GNI per capita, 2020: $1,020 — #3 lowest of 156 countries

2. Sao Tome and Principe
> Wealth gap, top 10% / bottom 90%: 38.12
> Wealth gap, top 10% / bottom 50%: N/A
> Share of household wealth top 10%: 80.90% — #2 highest of 174 countries
> Share of household wealth mid 40%: 20.35% — #4 lowest of 174 countries
> Share of household wealth bottom 50%: -1.25% — #4 lowest of 174 countries
> GNI per capita, 2020: $4,250 — #36 lowest of 156 countries
[in-text-ad-2]

1. South Africa
> Wealth gap, top 10% / bottom 90%: 53.77
> Wealth gap, top 10% / bottom 50%: N/A
> Share of household wealth top 10%: 85.67% — #1 highest of 174 countries
> Share of household wealth mid 40%: 16.78% — #1 lowest of 174 countries
> Share of household wealth bottom 50%: -2.44% — #2 lowest of 174 countries
> GNI per capita, 2020: $13,130 — #78 lowest of 156 countries
Methodology
To find the 30 countries with the worst wealth inequality, 24/7 Wall St. used income, wealth, and inequality data from WID.world’s (World Inequality Database) 2022 World Inequality Report. Because in some countries, the bottom 50% have zero or even negative net wealth, we ranked countries by the wealth gap as measured by the ratio of the top 10% share of wealth to the bottom 90% share of wealth. We provided the top 10% to bottom 50% when applicable. All 174 countries in the report are included. Data is as of 2021.
The report measures wealth inequality using the distribution of net household wealth among adults, whereas net household wealth is the sum of financial assets and non-financial assets owned by individuals, net of their debts. The report uses purchasing power parity estimates correct for inflation using the national income deflator (base 2021). The population is of individuals over age 20.
Data on how much wealth the top 10%, mid 40%, and bottom 50% capture also came from the report. Data on gross national income per capita in current international dollars using purchasing power parity method came from the World Bank.
Contact [email protected] for any questions or corrections.