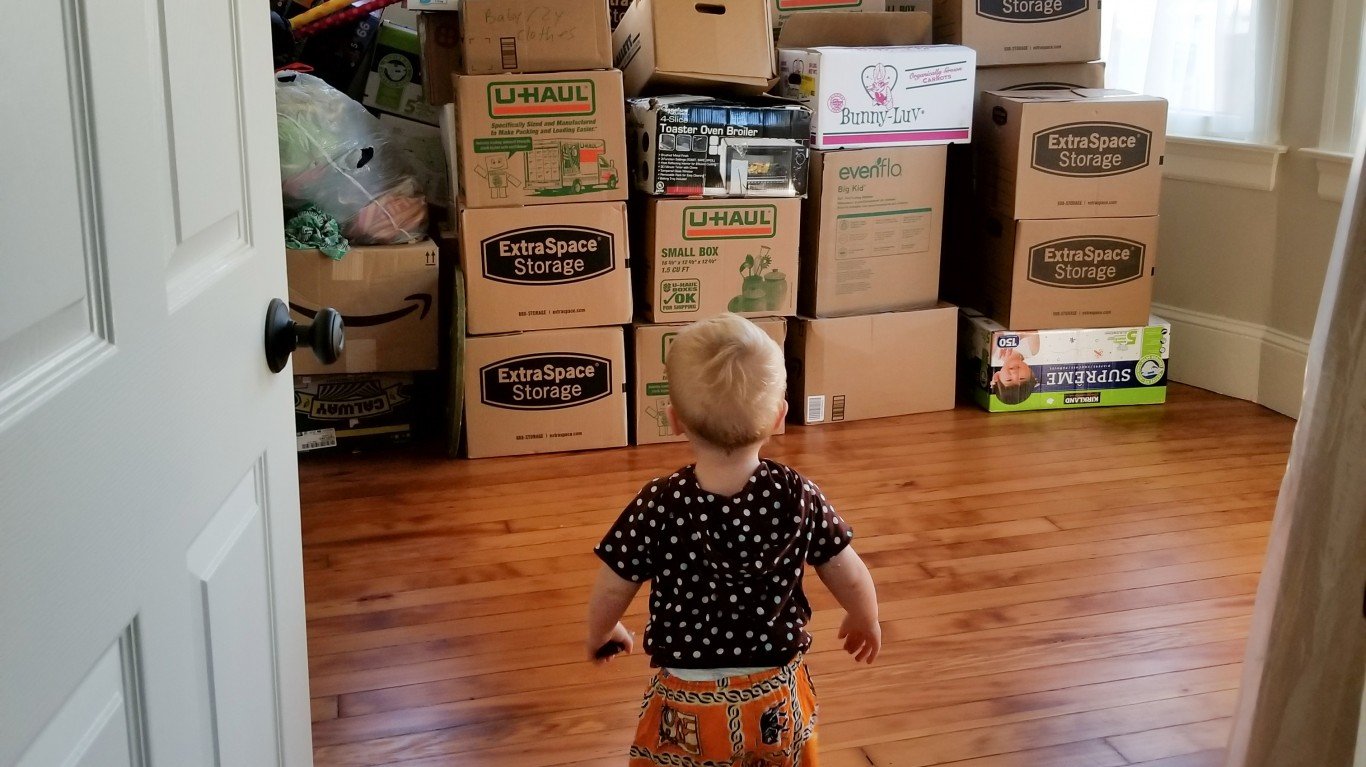
Americans are among the most itinerant people on Earth. According to the U.S. Census Bureau data from 2007, the average person in the United States changes residences more than 11 times in their lifetime. Europeans only move four times in their lifetime, according to a RE/MAX Europe survey.
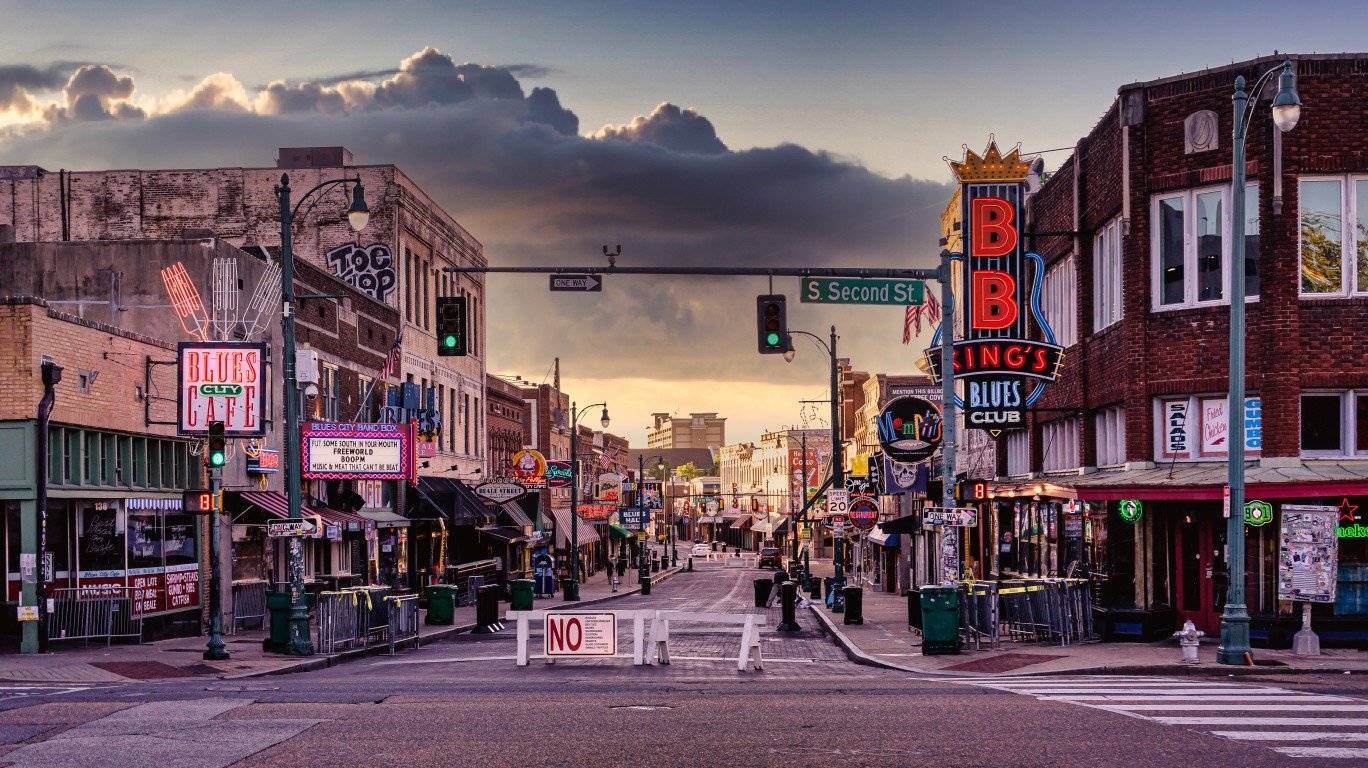
We’ve been on the move since the first Europeans arrived here 400 years ago. The belief in Manifest Destiny that the nation was destined to reach from the Atlantic to the Pacific has fired Americans’ imagination and raised expectations for a better life. (This is the top city Americans are moving to.)
To find the year most Americans moved since 2000, 24/7 Wall St. used U.S. Census Bureau’s Historical Geographic Mobility/Migration data. All data is from the Annual Social and Economic Supplement of the Current Population Survey, which is mostly conducted in March. We excluded people who migrated to the U.S. from abroad. The population universe is one year and older. (Asterixis note years survey methodologies have changed.)
Americans move for several reasons, according to United Van Lines’ 45th Annual National Movers Study: job transfers, to be closer to family, and retirement. The pandemic has added the desire for more space to the top reasons to move.
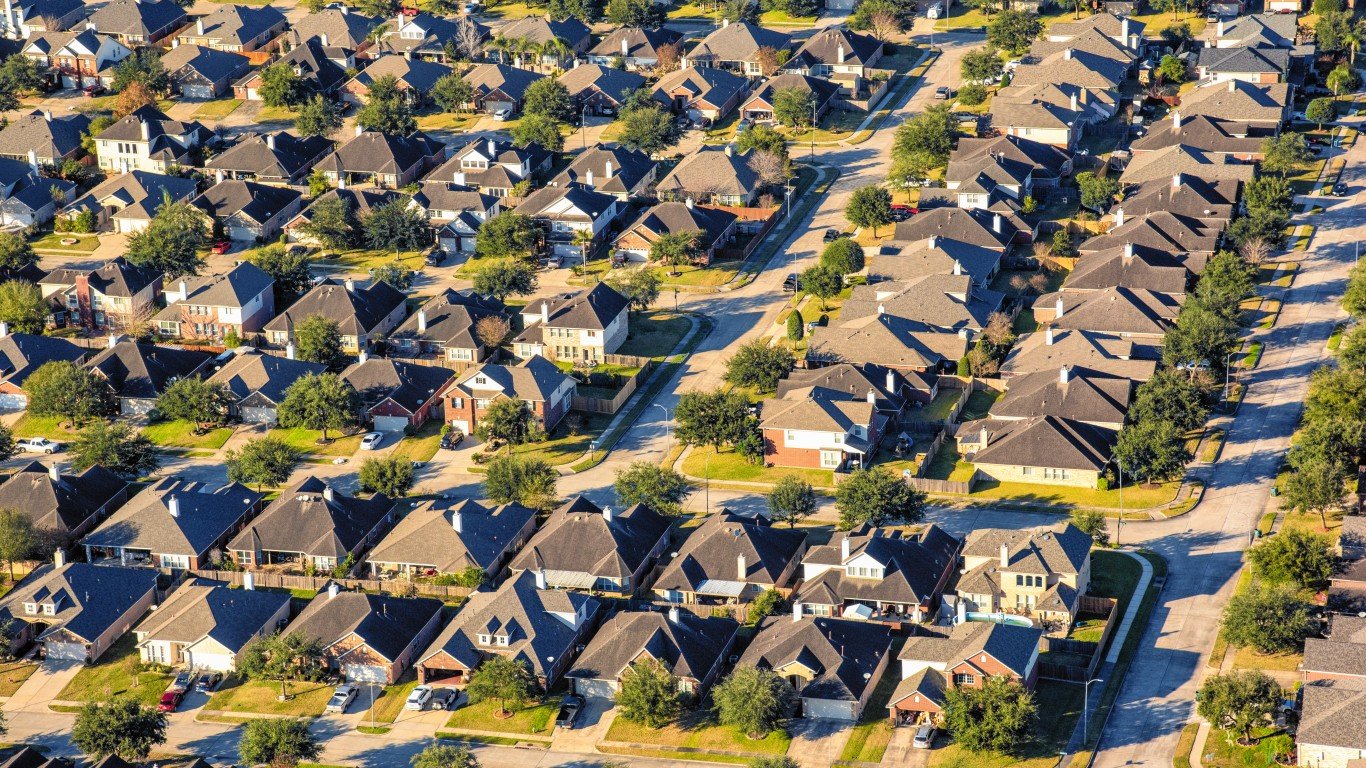
Because the U.S. is vast and speaks one language in most of the nation, conditions are favorable for people to move. The pandemic has not changed the longer-term moving patterns of Americans. Florida and South Carolina are drawing people because of warm weather and a lower cost of living, and more people have discovered the wide open spaces of Idaho. (This is the state the most people are moving to.)
Americans have been moving less often in recent years for a variety of reasons. The workforce is aging, and older workers are less inclined to move, according to a story in the Washington Post. Because there are more two-income households, that makes it more difficult to reconcile the logistics of moving. A changing work culture includes more telecommuting, allowing people to stay put.
The percentage of the population on the move has been declining since 2010-2011. Even though many stories have been written about Americans fleeing certain urban areas since the onset of COVID-19, fewer Americans have moved over the last few years, according to census data.
Other events in recent years have influenced Americans’ decision about moving. The number of Americans moving had risen each year until 2007-2008, when the Great Recession hit the U.S. That year, 34,022,000 Americans, or 11.5%, moved, the 11th lowest percentage since 2000. Americans got back on the road in higher numbers in the following two years, but the number of moves has been in decline since then.
Click here to see the years the most Americans moved since 2000

2020-2021
> Moved in US: 26,448,000 or 8.2% – the lowest percentage
> Moved in same county: 15,805,000 or 4.9% – the lowest percentage
> Moved to different county, same state: 6,270,000 or 1.9% – 2nd lowest percentage
> Moved to different state: 4,374,000 or 1.4% – 3rd lowest percentage
[in-text-ad]
2019-2020
> Moved in US: 28,814,000 or 9.0% – 2nd lowest percentage
> Moved in same county: 17,522,000 or 5.4% – 2nd lowest percentage
> Moved to different county, same state: 7,059,000 or 2.2% – 12th lowest percentage
> Moved to different state: 4,233,000 or 1.3% – the lowest percentage
[recirclink id=1045905]

2018-2019
> Moved in US: 30,234,000 or 9.4% – 3rd lowest percentage
> Moved in same county: 18,833,000 or 5.9% – 3rd lowest percentage
> Moved to different county, same state: 6,663,000 or 2.1% – 10th lowest percentage
> Moved to different state: 4,738,000 or 1.5% – 7th lowest percentage

2017-2018
> Moved in US: 31,186,000 or 9.8% – 4th lowest percentage
> Moved in same county: 19,852,000 or 6.2% – 4th lowest percentage
> Moved to different county, same state: 6,496,000 or 2.0% – 3rd lowest percentage
> Moved to different state: 4,838,000 or 1.5% – 7th lowest percentage
[in-text-ad-2]

2016-2017
> Moved in US: 33,647,000 or 10.6% – 5th lowest percentage
> Moved in same county: 21,614,000 or 6.8% – 5th lowest percentage
> Moved to different county, same state: 6,668,000 or 2.1% – 10th lowest percentage
> Moved to different state: 5,366,000 or 1.7% – 9th highest percentage

2015-2016
> Moved in US: 33,857,000 or 10.7% – 6th lowest percentage
> Moved in same county: 21,588,000 or 6.9% – 6th lowest percentage
> Moved to different county, same state: 7,501,000 or 2.4% – 10th highest percentage
> Moved to different state: 4,768,000 or 1.5% – 7th lowest percentage
[in-text-ad]

2014-2015
> Moved in US: 34,651,000 or 11.1% – 7th lowest percentage
> Moved in same county: 22,905,000 or 7.3% – 7th lowest percentage
> Moved to different county, same state: 6,653,000 or 2.1% – 10th lowest percentage
> Moved to different state: 5,093,000 or 1.6% – 12th lowest percentage
[recirclink id=986880]

2013-2014
> Moved in US: 34,548,000 or 11.2% – 9th lowest percentage
> Moved in same county: 23,436,000 or 7.6% – 9th lowest percentage
> Moved to different county, same state: 6,446,000 or 2.1% – 10th lowest percentage
> Moved to different state: 4,666,000 or 1.5% – 7th lowest percentage

2012-2013
> Moved in US: 34,882,000 or 11.4% – 10th lowest percentage
> Moved in same county: 23,150,000 or 7.5% – 8th lowest percentage
> Moved to different county, same state: 6,961,000 or 2.3% – 11th highest percentage
> Moved to different state: 4,770,000 or 1.6% – 12th lowest percentage
[in-text-ad-2]

2011-2012
> Moved in US: 35,334,000 or 11.6% – 12th lowest percentage
> Moved in same county: 23,493,000 or 7.7% – 11th lowest percentage
> Moved to different county, same state: 6,782,000 or 2.2% – 12th lowest percentage
> Moved to different state: 5,059,000 or 1.7% – 9th highest percentage

2010-2011
> Moved in US: 33,953,000 or 11.2% – 9th lowest percentage
> Moved in same county: 23,330,000 or 7.7% – 11th lowest percentage
> Moved to different county, same state: 5,868,000 or 1.9% – 2nd lowest percentage
> Moved to different state: 4,756,000 or 1.6% – 12th lowest percentage
[in-text-ad]
2009-2010
> Moved in US: 36,459,000 or 12.1% – 10th highest percentage
> Moved in same county: 25,910,000 or 8.6% – 2nd highest percentage
> Moved to different county, same state: 6,227,000 or 2.1% – 10th lowest percentage
> Moved to different state: 4,323,000 or 1.4% – 3rd lowest percentage
[recirclink id=942076]

2008-2009
> Moved in US: 36,017,000 or 12.1% – 10th highest percentage
> Moved in same county: 24,984,000 or 8.4% – 6th highest percentage
> Moved to different county, same state: 6,374,000 or 2.1% – 10th lowest percentage
> Moved to different state: 4,660,000 or 1.6% – 12th lowest percentage

2007-2008
> Moved in US: 34,022,000 or 11.5% – 11th lowest percentage
> Moved in same county: 23,013,000 or 7.8% – 12th lowest percentage
> Moved to different county, same state: 6,282,000 or 2.1% – 10th lowest percentage
> Moved to different state: 4,728,000 or 1.6% – 12th lowest percentage
[in-text-ad-2]

2006-2007
> Moved in US: 37,490,000 or 12.8% – 9th highest percentage
> Moved in same county: 25,192,000 or 8.6% – 2nd highest percentage
> Moved to different county, same state: 7,436,000 or 2.5% – 9th highest percentage
> Moved to different state: 4,862,000 or 1.7% – 9th highest percentage

2005-2006
> Moved in US: 38,541,000 or 13.3% – 6th highest percentage
> Moved in same county: 24,851,000 or 8.6% – 2nd highest percentage
> Moved to different county, same state: 8,010,000 or 2.8% – 3rd highest percentage
> Moved to different state: 5,679,000 or 2.0% – 8th highest percentage
[in-text-ad]

2004-2005
> Moved in US: 38,023,000 or 13.2% – 8th highest percentage
> Moved in same county: 22,736,000 or 7.9% – 10th highest percentage
> Moved to different county, same state: 7,847,000 or 2.7% – 6th highest percentage
> Moved to different state: 7,441,000 or 2.6% – 6th highest percentage
[recirclink id=1016848]
2003-2004
> Moved in US: 37,723,000 or 13.3% – 6th highest percentage
> Moved in same county: 22,551,000 or 7.9% – 10th highest percentage
> Moved to different county, same state: 7,842,000 or 2.8% – 3rd highest percentage
> Moved to different state: 7,330,000 or 2.6% – 6th highest percentage

2002-2003
> Moved in US: 38,824,000 or 13.7% – 3rd highest percentage
> Moved in same county: 23,468,000 or 8.3% – 7th highest percentage
> Moved to different county, same state: 7,728,000 or 2.7% – 6th highest percentage
> Moved to different state: 7,628,000 or 2.7% – 5th highest percentage
[in-text-ad-2]

2001-2002
> Moved in US: 39,548,000 or 14.2% – 2nd highest percentage
> Moved in same county: 23,712,000 or 8.5% – 5th highest percentage
> Moved to different county, same state: 8,066,000 or 2.9% – 2nd highest percentage
> Moved to different state: 7,770,000 or 2.8% – 2nd highest percentage

2000-2001
> Moved in US: 37,251,000 or 13.5% – 5th highest percentage
> Moved in same county: 21,918,000 or 8.0% – 8th highest percentage
> Moved to different county, same state: 7,550,000 or 2.7% – 6th highest percentage
> Moved to different state: 7,783,000 or 2.8% – 2nd highest percentage
[in-text-ad]

2000-2001
> Moved in US: 36,993,000 or 13.6% – 4th highest percentage
> Moved in same county: 21,783,000 or 8.0% – 8th highest percentage
> Moved to different county, same state: 7,531,000 or 2.8% – 3rd highest percentage
> Moved to different state: 7,679,000 or 2.8% – 2nd highest percentage
[recirclink id=989112]

1999-2000
> Moved in US: 41,642,000 or 15.4% – the highest percentage
> Moved in same county: 24,399,000 or 9.0% – the highest percentage
> Moved to different county, same state: 8,814,000 or 3.3% – the highest percentage
> Moved to different state: 8,428,000 or 3.1% – the highest percentage
Contact [email protected] for any questions or corrections.