
Though by many measures the economy is still recovering rapidly from the COVID-19 pandemic, U.S. job growth continues to be strong. Still, many companies and businesses are struggling to find and hire workers as the number of unfilled jobs has hit a multi-decade high in recent months. There were 11.3 million job openings nationwide at the end of January 2022, a 56% increase from a year earlier.
Causes of the historic labor shortage are varied. During the pandemic, early retirements surged, parents of school-age children left the workforce en masse, and immigration slowed considerably – resulting in millions of fewer workers than there otherwise would have been. Additionally, some argue that enhanced unemployment benefits and economic stimulus payments during the pandemic reduced the incentive for many Americans to work. This is what it costs to retire comfortably in each state.
Today, the labor force participation rate – the share of Americans 16 and older either working or looking for work – stands at 62.3%, a low not seen in the pre-pandemic United States since 1977. The national labor shortage is putting a strain on businesses across the country, forcing some to reduce hours and others to close completely.
Using data from the Bureau of Labor Statistics, 24/7 Wall St. identified the states with the most job openings. States are ranked by the share of all jobs that were unfilled as of the end of January 2022, the most recent month of available data. Depending on the state, the share of jobs that remain unfilled ranges from 5.8% up to 8.8% of all jobs. For context, 7.0% of jobs nationwide are unfilled.
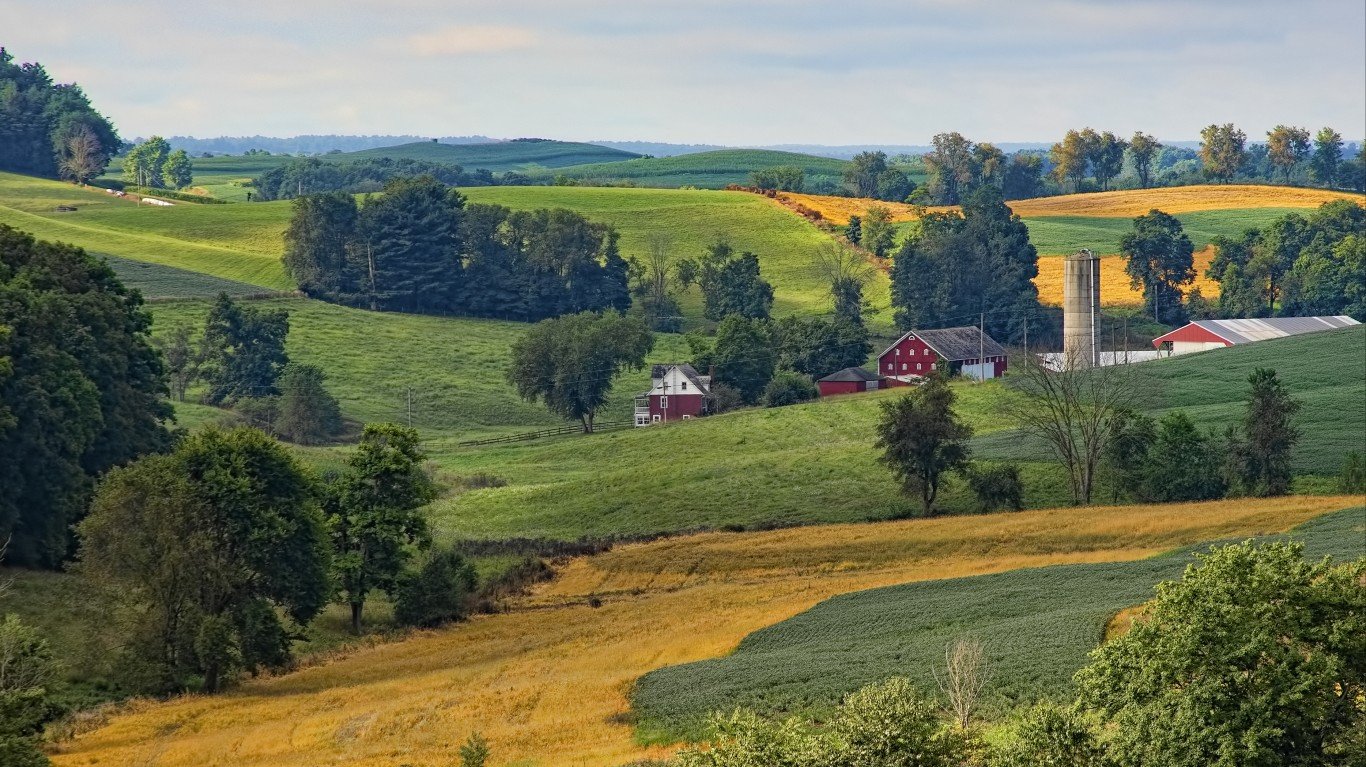
Despite the need for workers, a small percentage of the labor force remains unemployed, suggesting that among those who are unemployed there is a mismatch between either the skills employers are seeking and the labor pool or the kind of work or benefits job seekers desire and what is available. The national unemployment rate stood at 4.0% in January 2022. Depending on the state, unemployment ranges from 2.2% to 5.9%. Here is a look at the worst states to look for a job.
Click here to see states with the most job openings
Click here to see our detailed methodology
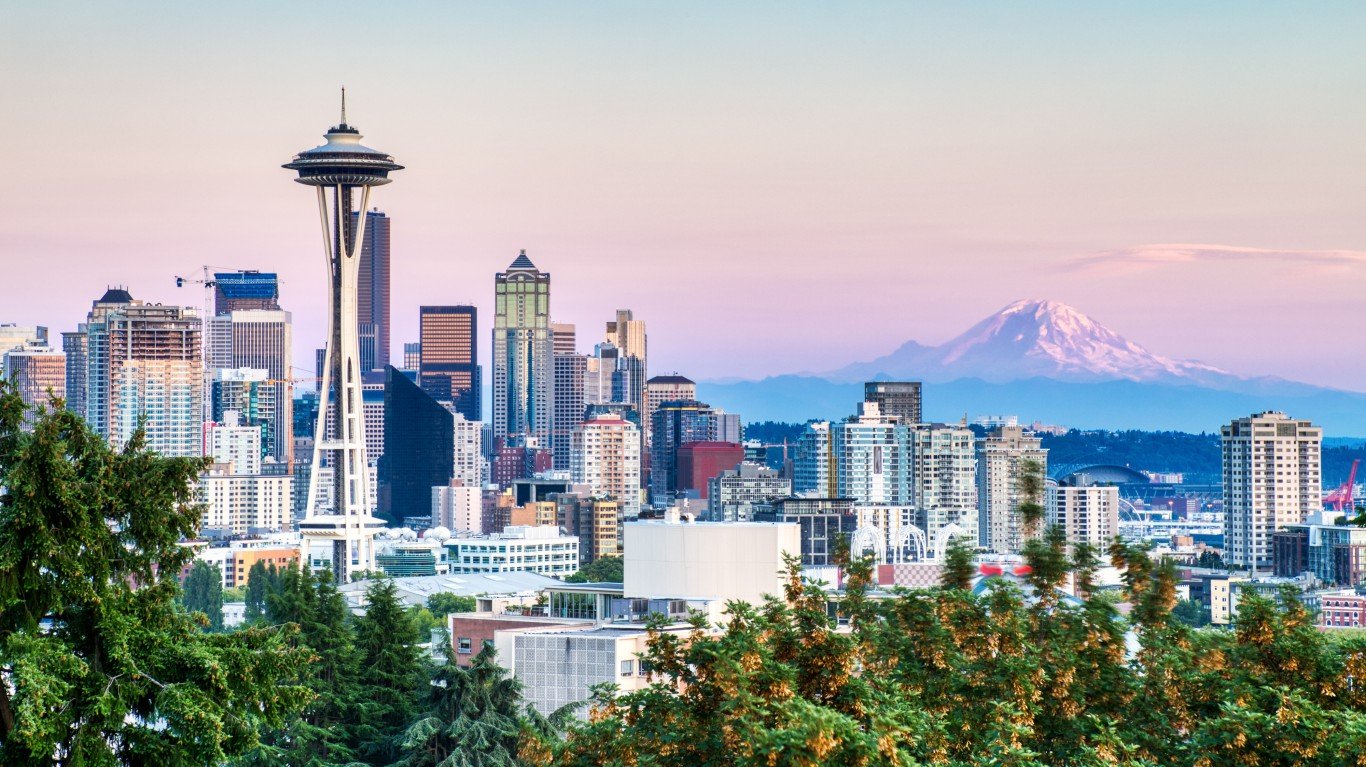
50. Washington
> Job openings at the end of Jan. 2022: 5.8% of all jobs (213,000 total openings)
> Jan. 2022 unemployment: 4.4%
> 1-year change in job openings: +31.5%
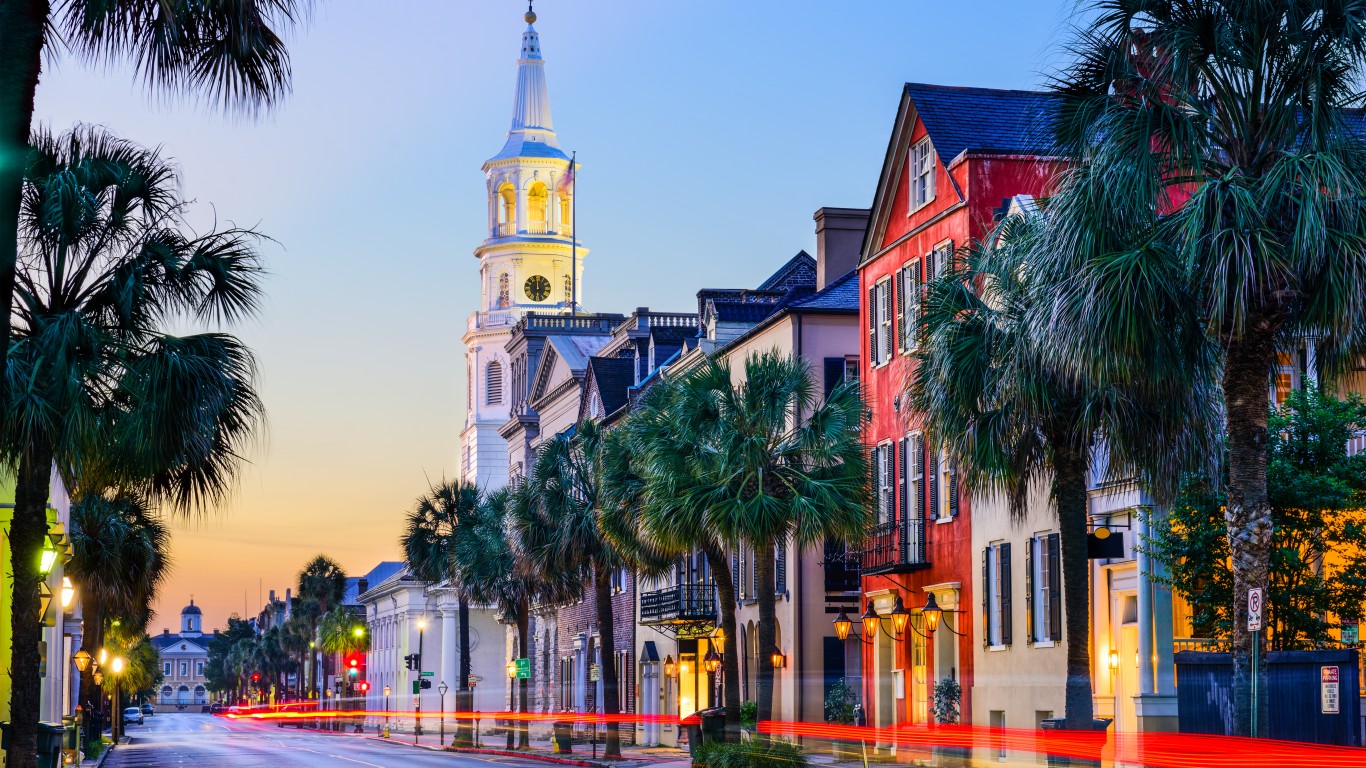
> Labor force size: 3,961,146 people
[in-text-ad]

49. New York
> Job openings at the end of Jan. 2022: 5.9% of all jobs (588,000 total openings)
> Jan. 2022 unemployment: 5.3%
> 1-year change in job openings: +64.7%
> Labor force size: 9,392,186 people
[recirclink id=1031536]

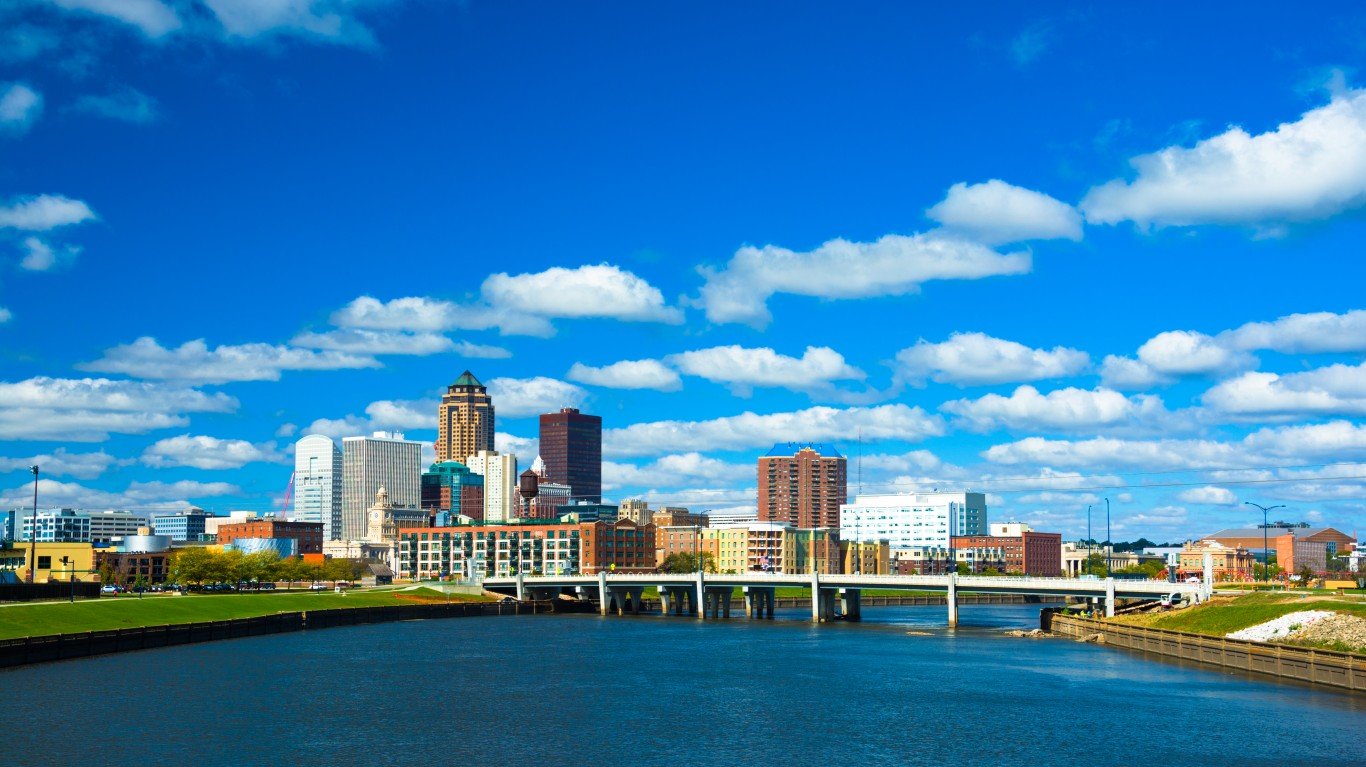
48. Texas
> Job openings at the end of Jan. 2022: 6.3% of all jobs (885,000 total openings)
> Jan. 2022 unemployment: 4.8%
> 1-year change in job openings: +60.3%
> Labor force size: 14,333,602 people

47. California
> Job openings at the end of Jan. 2022: 6.3% of all jobs (1,148,000 total openings)
> Jan. 2022 unemployment: 5.8%
> 1-year change in job openings: +65.2%
> Labor force size: 19,064,484 people
[in-text-ad-2]

46. Mississippi
> Job openings at the end of Jan. 2022: 6.4% of all jobs (79,000 total openings)
> Jan. 2022 unemployment: 4.6%
> 1-year change in job openings: +25.4%
> Labor force size: 1,252,236 people

45. Arkansas
> Job openings at the end of Jan. 2022: 6.4% of all jobs (89,000 total openings)
> Jan. 2022 unemployment: 3.2%
> 1-year change in job openings: +30.9%
> Labor force size: 1,334,885 people
[in-text-ad]

44. Kansas
> Job openings at the end of Jan. 2022: 6.4% of all jobs (94,000 total openings)
> Jan. 2022 unemployment: 2.6%
> 1-year change in job openings: +32.4%
> Labor force size: 1,495,643 people
[recirclink id=1030831]

43. Alabama
> Job openings at the end of Jan. 2022: 6.4% of all jobs (141,000 total openings)
> Jan. 2022 unemployment: 3.1%
> 1-year change in job openings: +28.2%
> Labor force size: 2,250,379 people

42. Oklahoma
> Job openings at the end of Jan. 2022: 6.6% of all jobs (118,000 total openings)
> Jan. 2022 unemployment: 2.7%
> 1-year change in job openings: +34.1%
> Labor force size: 1,850,630 people
[in-text-ad-2]
41. Nevada
> Job openings at the end of Jan. 2022: 6.7% of all jobs (102,000 total openings)
> Jan. 2022 unemployment: 5.2%
> 1-year change in job openings: +36.0%
> Labor force size: 1,493,864 people

40. Connecticut
> Job openings at the end of Jan. 2022: 6.7% of all jobs (117,000 total openings)
> Jan. 2022 unemployment: 5.3%
> 1-year change in job openings: +72.1%
> Labor force size: 1,867,354 people
[in-text-ad]

39. New Jersey
> Job openings at the end of Jan. 2022: 6.7% of all jobs (298,000 total openings)
> Jan. 2022 unemployment: 5.2%
> 1-year change in job openings: +43.3%
> Labor force size: 4,643,011 people
[recirclink id=1031074]
38. Louisiana
> Job openings at the end of Jan. 2022: 6.8% of all jobs (138,000 total openings)
> Jan. 2022 unemployment: 4.3%
> 1-year change in job openings: +34.0%
> Labor force size: 2,069,163 people
37. South Dakota
> Job openings at the end of Jan. 2022: 6.9% of all jobs (33,000 total openings)
> Jan. 2022 unemployment: 2.8%
> 1-year change in job openings: +37.5%
> Labor force size: 470,653 people
[in-text-ad-2]

36. Hawaii
> Job openings at the end of Jan. 2022: 6.9% of all jobs (44,000 total openings)
> Jan. 2022 unemployment: 4.4%
> 1-year change in job openings: +63.0%
> Labor force size: 673,681 people

35. Oregon
> Job openings at the end of Jan. 2022: 7.0% of all jobs (145,000 total openings)
> Jan. 2022 unemployment: 4.3%
> 1-year change in job openings: +39.4%
> Labor force size: 2,168,038 people
[in-text-ad]

34. Wisconsin
> Job openings at the end of Jan. 2022: 7.0% of all jobs (220,000 total openings)
> Jan. 2022 unemployment: 3.0%
> 1-year change in job openings: +76.0%
> Labor force size: 3,136,984 people
[recirclink id=1026493]
33. Ohio
> Job openings at the end of Jan. 2022: 7.0% of all jobs (410,000 total openings)
> Jan. 2022 unemployment: 4.3%
> 1-year change in job openings: +61.4%
> Labor force size: 5,743,557 people

32. West Virginia
> Job openings at the end of Jan. 2022: 7.1% of all jobs (53,000 total openings)
> Jan. 2022 unemployment: 4.1%
> 1-year change in job openings: +6.0%
> Labor force size: 793,302 people
[in-text-ad-2]
31. Massachusetts
> Job openings at the end of Jan. 2022: 7.1% of all jobs (277,000 total openings)
> Jan. 2022 unemployment: 4.8%
> 1-year change in job openings: +88.4%
> Labor force size: 3,767,170 people
30. Wyoming
> Job openings at the end of Jan. 2022: 7.2% of all jobs (22,000 total openings)
> Jan. 2022 unemployment: 3.8%
> 1-year change in job openings: +37.5%
> Labor force size: 290,122 people
[in-text-ad]
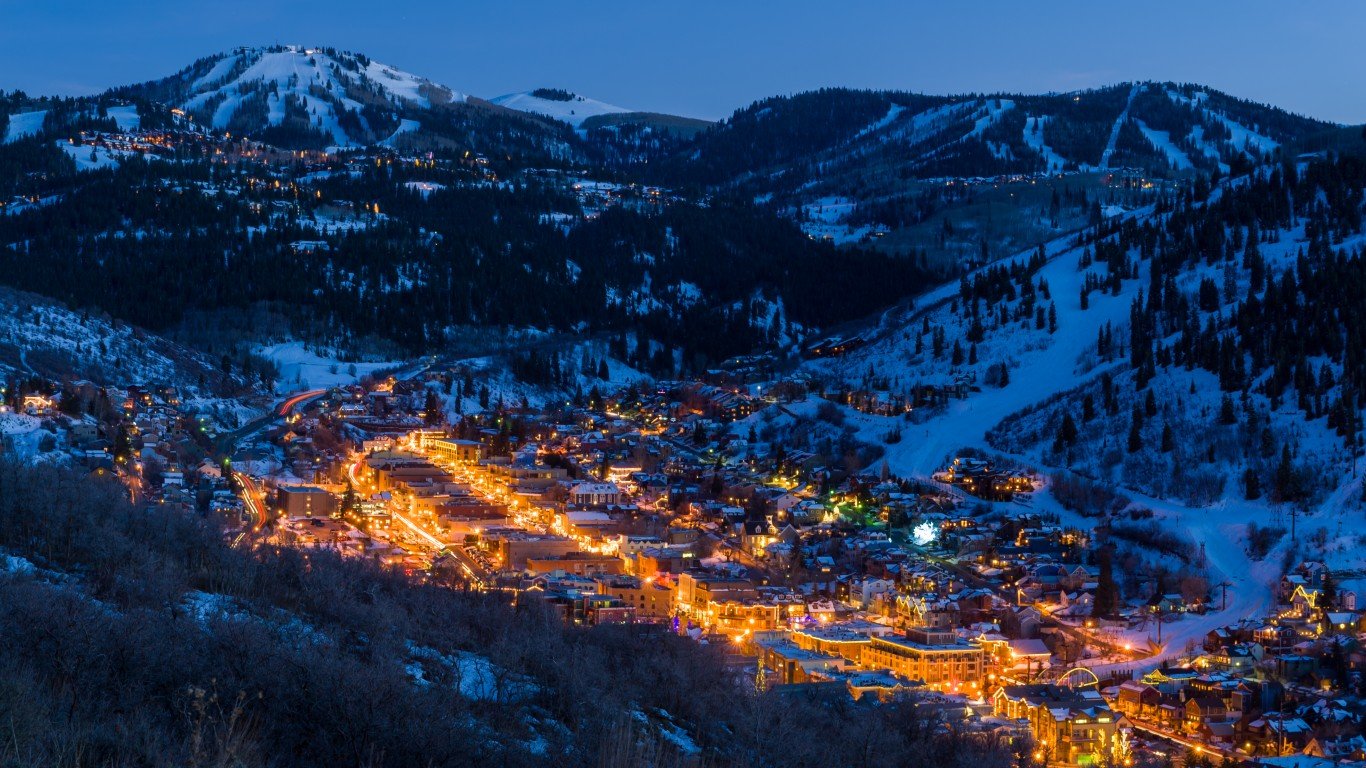
29. Idaho
> Job openings at the end of Jan. 2022: 7.2% of all jobs (63,000 total openings)
> Jan. 2022 unemployment: 3.0%
> 1-year change in job openings: +50.0%
> Labor force size: 924,469 people
[recirclink id=1066858]
28. Iowa
> Job openings at the end of Jan. 2022: 7.2% of all jobs (121,000 total openings)
> Jan. 2022 unemployment: 3.7%
> 1-year change in job openings: +65.8%
> Labor force size: 1,680,376 people

27. Virginia
> Job openings at the end of Jan. 2022: 7.2% of all jobs (310,000 total openings)
> Jan. 2022 unemployment: 3.3%
> 1-year change in job openings: +50.5%
> Labor force size: 4,277,757 people
[in-text-ad-2]

26. North Carolina
> Job openings at the end of Jan. 2022: 7.2% of all jobs (359,000 total openings)
> Jan. 2022 unemployment: 3.9%
> 1-year change in job openings: +23.4%
> Labor force size: 5,007,262 people
25. Utah
> Job openings at the end of Jan. 2022: 7.3% of all jobs (129,000 total openings)
> Jan. 2022 unemployment: 2.2%
> 1-year change in job openings: +74.3%
> Labor force size: 1,694,020 people
[in-text-ad]
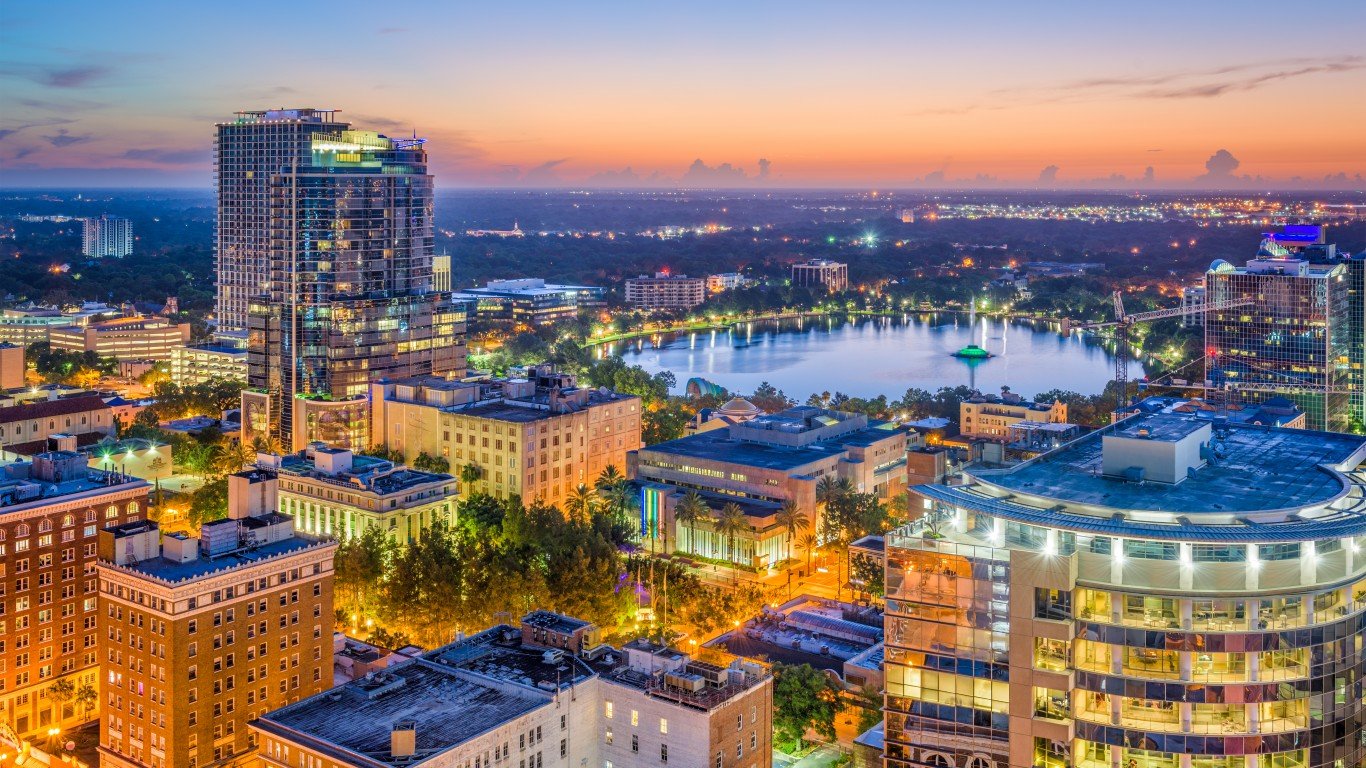
24. Florida
> Job openings at the end of Jan. 2022: 7.3% of all jobs (725,000 total openings)
> Jan. 2022 unemployment: 3.5%
> 1-year change in job openings: +77.7%
> Labor force size: 10,448,456 people
[recirclink id=1031536]

23. Arizona
> Job openings at the end of Jan. 2022: 7.4% of all jobs (241,000 total openings)
> Jan. 2022 unemployment: 3.7%
> 1-year change in job openings: +51.6%
> Labor force size: 3,536,384 people

22. Indiana
> Job openings at the end of Jan. 2022: 7.4% of all jobs (251,000 total openings)
> Jan. 2022 unemployment: 2.4%
> 1-year change in job openings: +67.3%
> Labor force size: 3,304,953 people
[in-text-ad-2]

21. Montana
> Job openings at the end of Jan. 2022: 7.5% of all jobs (41,000 total openings)
> Jan. 2022 unemployment: 2.7%
> 1-year change in job openings: +46.4%
> Labor force size: 554,986 people

20. Maryland
> Job openings at the end of Jan. 2022: 7.5% of all jobs (217,000 total openings)
> Jan. 2022 unemployment: 5.4%
> 1-year change in job openings: +55.0%
> Labor force size: 3,196,404 people
[in-text-ad]

19. Missouri
> Job openings at the end of Jan. 2022: 7.5% of all jobs (236,000 total openings)
> Jan. 2022 unemployment: 3.8%
> 1-year change in job openings: +74.8%
> Labor force size: 3,075,707 people
[recirclink id=1030831]

18. Georgia
> Job openings at the end of Jan. 2022: 7.5% of all jobs (380,000 total openings)
> Jan. 2022 unemployment: 3.2%
> 1-year change in job openings: +23.8%
> Labor force size: 5,215,701 people

17. North Dakota
> Job openings at the end of Jan. 2022: 7.6% of all jobs (35,000 total openings)
> Jan. 2022 unemployment: 3.1%
> 1-year change in job openings: +75.0%
> Labor force size: 408,079 people
[in-text-ad-2]

16. Rhode Island
> Job openings at the end of Jan. 2022: 7.6% of all jobs (40,000 total openings)
> Jan. 2022 unemployment: 4.2%
> 1-year change in job openings: +66.7%
> Labor force size: 568,798 people
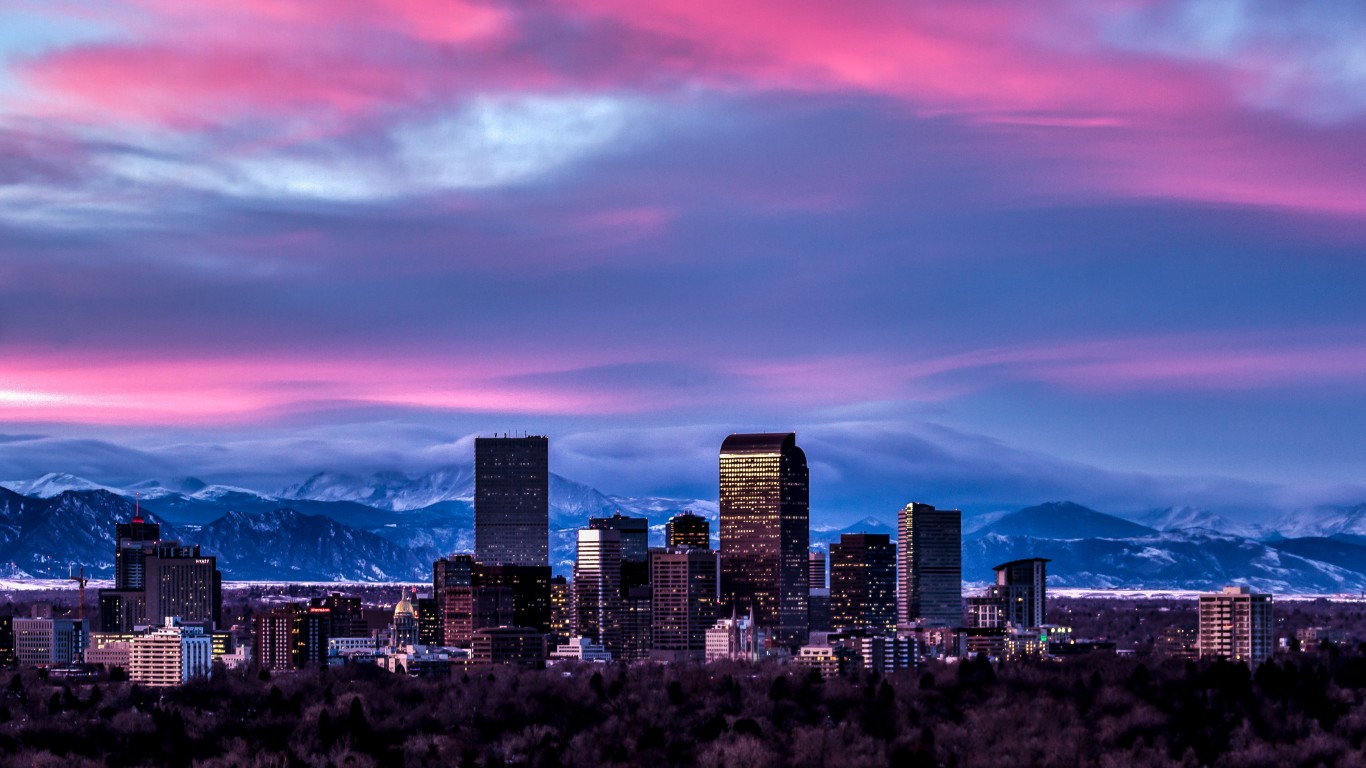
15. Colorado
> Job openings at the end of Jan. 2022: 7.6% of all jobs (231,000 total openings)
> Jan. 2022 unemployment: 4.1%
> 1-year change in job openings: +69.9%
> Labor force size: 3,187,417 people
[in-text-ad]

14. Tennessee
> Job openings at the end of Jan. 2022: 7.6% of all jobs (262,000 total openings)
> Jan. 2022 unemployment: 3.5%
> 1-year change in job openings: +70.1%
> Labor force size: 3,346,422 people
[recirclink id=1031074]

13. Illinois
> Job openings at the end of Jan. 2022: 7.6% of all jobs (488,000 total openings)
> Jan. 2022 unemployment: 5.0%
> 1-year change in job openings: +88.4%
> Labor force size: 6,378,180 people

12. New Mexico
> Job openings at the end of Jan. 2022: 7.7% of all jobs (69,000 total openings)
> Jan. 2022 unemployment: 5.9%
> 1-year change in job openings: +56.8%
> Labor force size: 944,607 people
[in-text-ad-2]
11. South Carolina
> Job openings at the end of Jan. 2022: 7.7% of all jobs (183,000 total openings)
> Jan. 2022 unemployment: 3.5%
> 1-year change in job openings: +38.6%
> Labor force size: 2,374,682 people
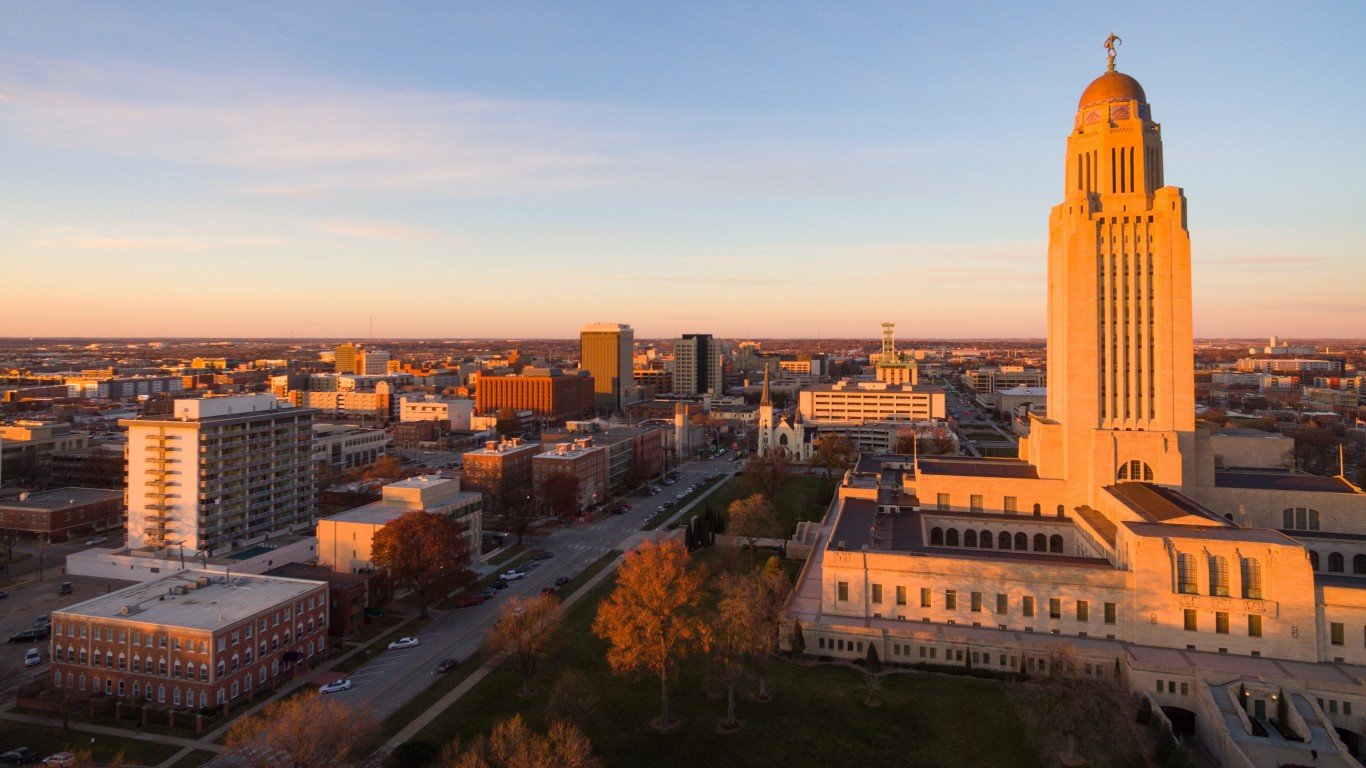
10. Nebraska
> Job openings at the end of Jan. 2022: 7.8% of all jobs (85,000 total openings)
> Jan. 2022 unemployment: 2.2%
> 1-year change in job openings: +70.0%
> Labor force size: 1,056,346 people
[in-text-ad]

9. Michigan
> Job openings at the end of Jan. 2022: 7.8% of all jobs (363,000 total openings)
> Jan. 2022 unemployment: 4.9%
> 1-year change in job openings: +47.0%
> Labor force size: 4,795,240 people
[recirclink id=1026493]

8. Delaware
> Job openings at the end of Jan. 2022: 7.9% of all jobs (39,000 total openings)
> Jan. 2022 unemployment: 4.8%
> 1-year change in job openings: +62.5%
> Labor force size: 498,193 people
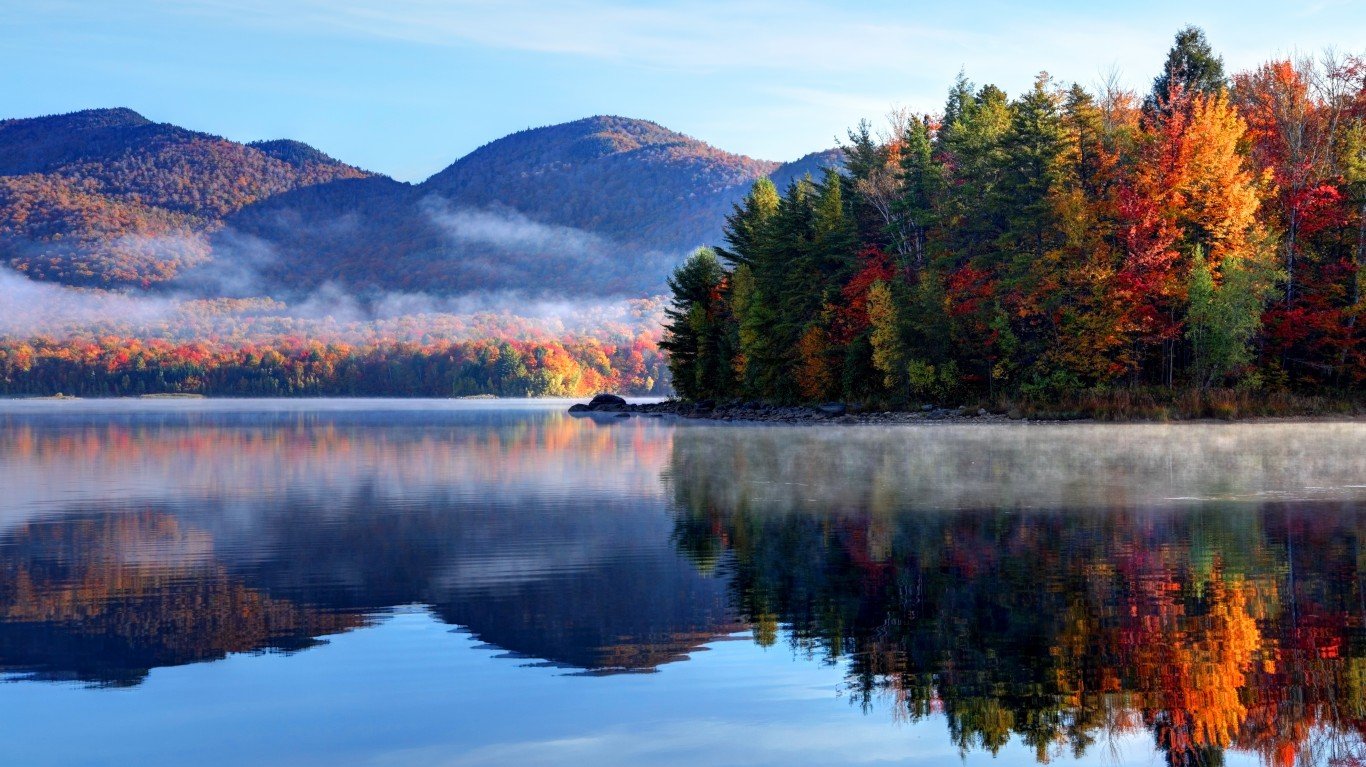
7. Vermont
> Job openings at the end of Jan. 2022: 8.0% of all jobs (26,000 total openings)
> Jan. 2022 unemployment: 3.0%
> 1-year change in job openings: +73.3%
> Labor force size: 329,312 people
[in-text-ad-2]
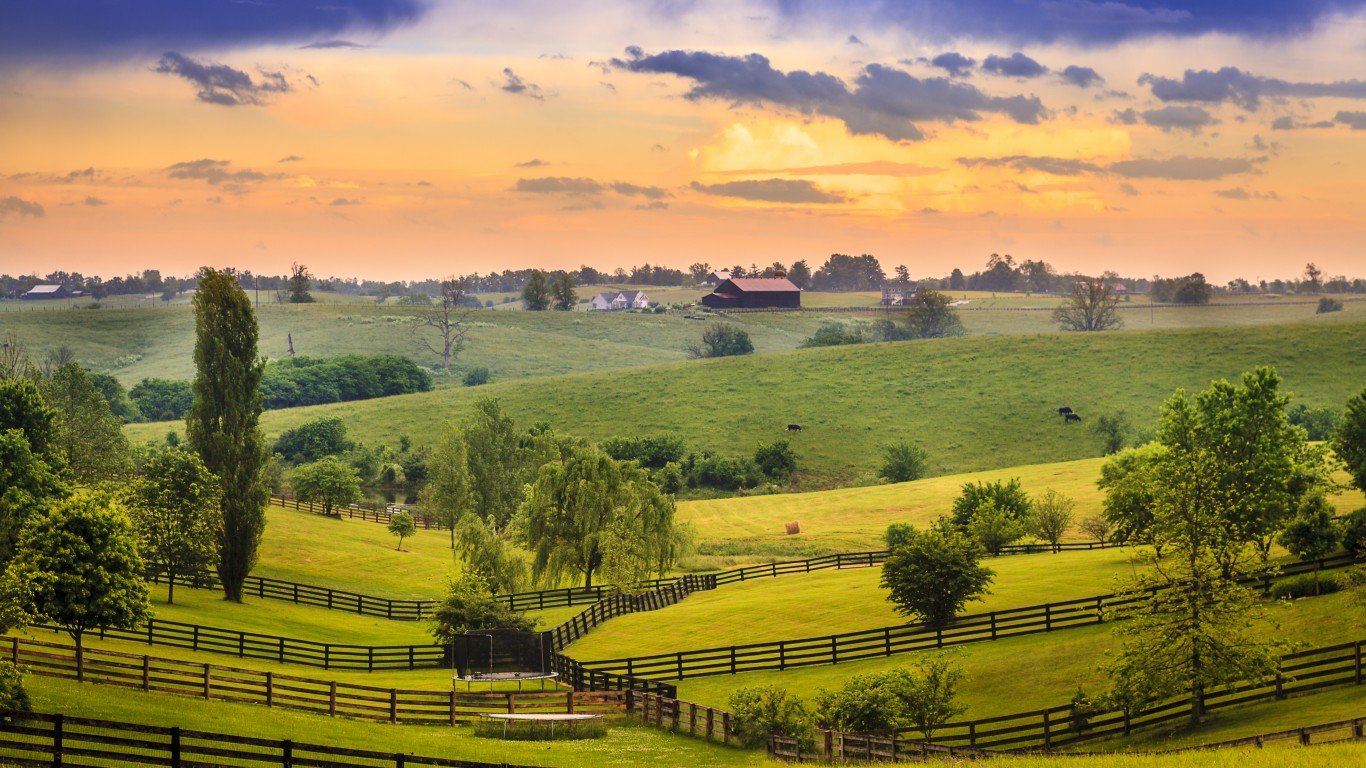
6. Kentucky
> Job openings at the end of Jan. 2022: 8.0% of all jobs (167,000 total openings)
> Jan. 2022 unemployment: 4.4%
> 1-year change in job openings: +59.0%
> Labor force size: 2,053,986 people
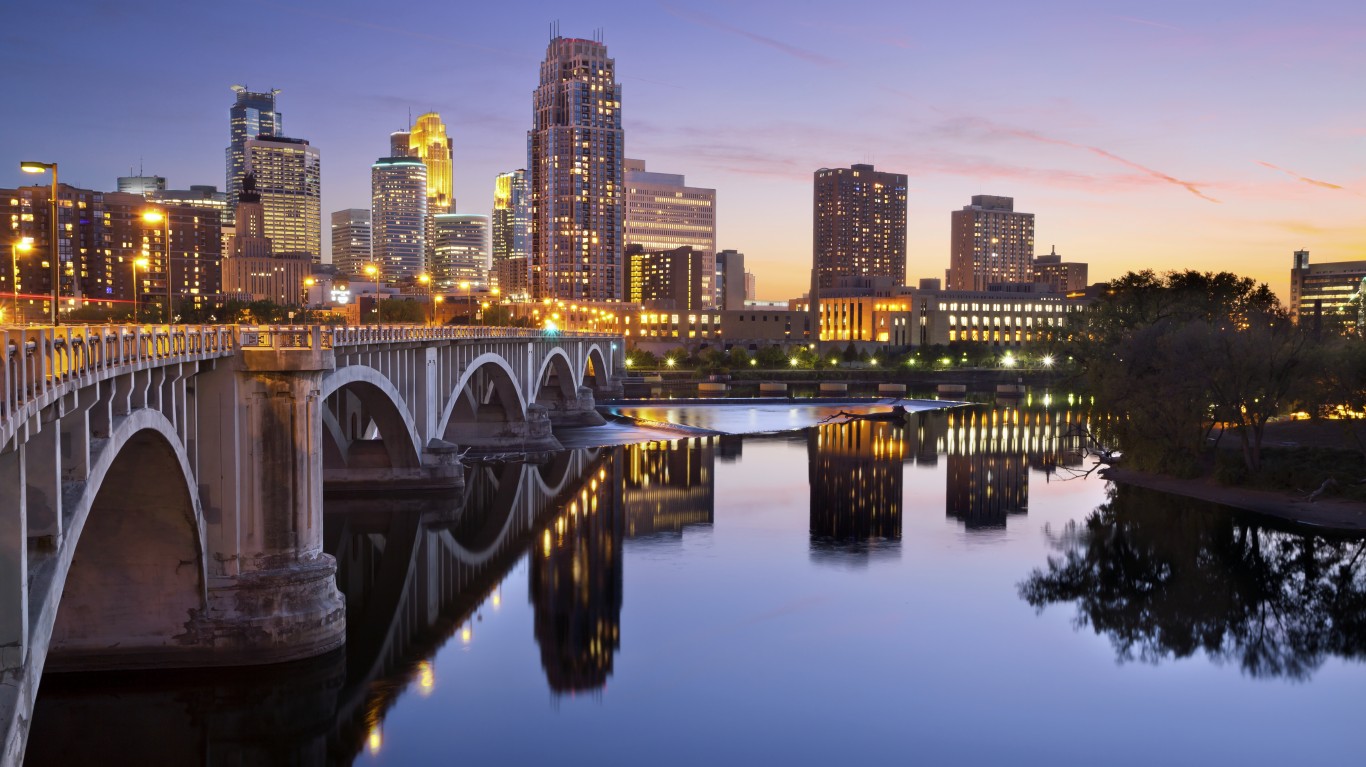
5. Minnesota
> Job openings at the end of Jan. 2022: 8.1% of all jobs (254,000 total openings)
> Jan. 2022 unemployment: 2.9%
> 1-year change in job openings: +124.8%
> Labor force size: 3,045,921 people
[in-text-ad]

4. Pennsylvania
> Job openings at the end of Jan. 2022: 8.3% of all jobs (532,000 total openings)
> Jan. 2022 unemployment: 5.4%
> 1-year change in job openings: +86.7%
> Labor force size: 6,371,387 people
[recirclink id=1066858]
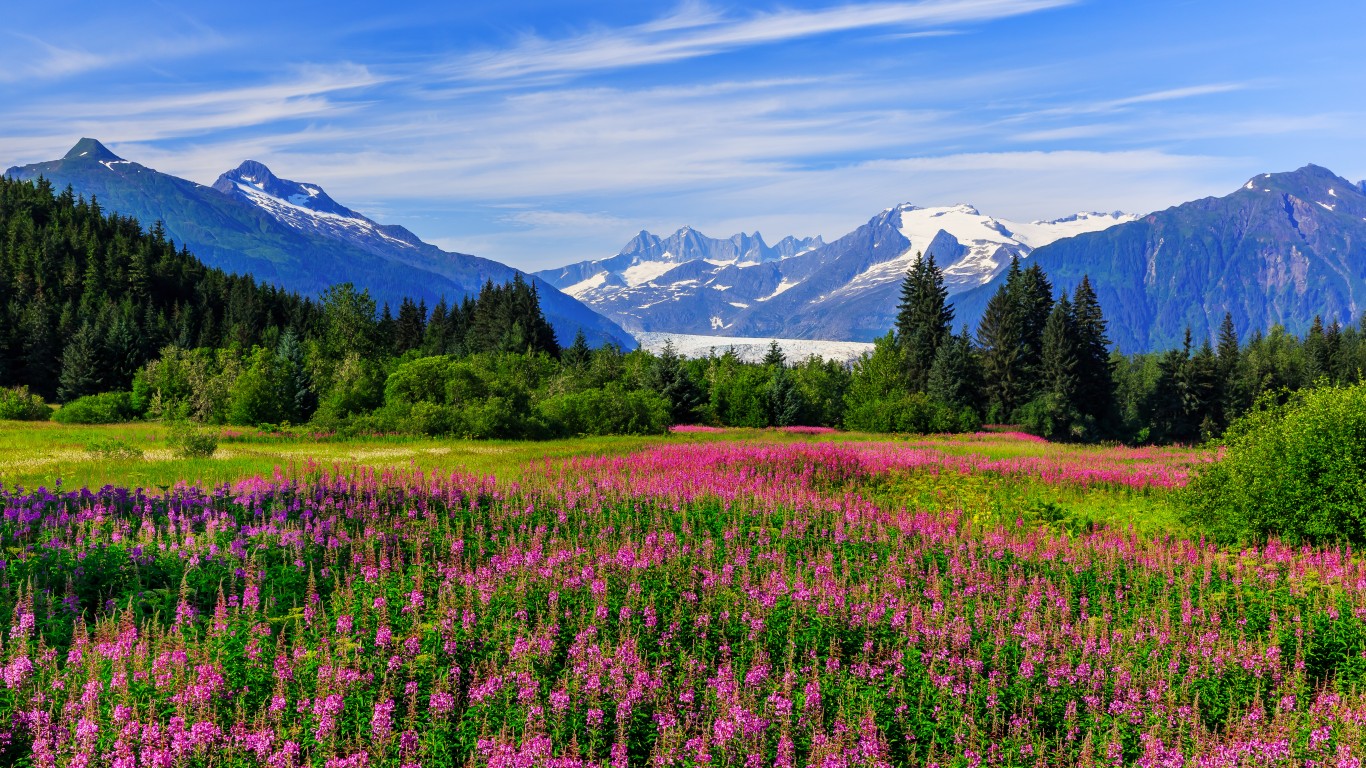
3. Alaska
> Job openings at the end of Jan. 2022: 8.7% of all jobs (30,000 total openings)
> Jan. 2022 unemployment: 5.6%
> 1-year change in job openings: +30.4%
> Labor force size: 361,290 people

2. Maine
> Job openings at the end of Jan. 2022: 8.8% of all jobs (61,000 total openings)
> Jan. 2022 unemployment: 4.1%
> 1-year change in job openings: +110.3%
> Labor force size: 679,523 people
[in-text-ad-2]

1. New Hampshire
> Job openings at the end of Jan. 2022: 8.8% of all jobs (65,000 total openings)
> Jan. 2022 unemployment: 2.9%
> 1-year change in job openings: +103.1%
> Labor force size: 755,554 people
Methodology
To determine the States with the most job openings, 24/7 Wall St. reviewed the Job Openings and Labor Turnover Survey report from the Bureau of Labor Statistics. States are ranked by the job openings rate, which is computed by dividing the number of job openings by the sum of employment and job openings and multiplying that quotient by 100. For multiple states with the same job openings rate, ties were broken by the actual number of job openings.
Job openings are the number of positions – full-time, part-time, seasonal, short-term, or permanent – open on the last business day of January 2022, the most recent month of available data. In order to be counted as open, a job has to start within 30 days of when the employer can find a suitable candidate.
Figures on unemployment and labor force size, which includes Americans either working or actively looking for work, are also from the BLS.
Contact [email protected] for any questions or corrections.