The share of Americans working from home skyrocketed during the pandemic. A recent Gallup study found that 45% of full-time workers in the United States – and two-thirds of white-collar workers – were doing their job remotely at least some of the time.
The shift is proving to be a positive development for millions of Americans. Gallup reports that over 90% of remote workers hope that the trend continues after the pandemic, citing the lack of commute time as the chief benefit. (Here is a look at the state where the most people are working from home.)
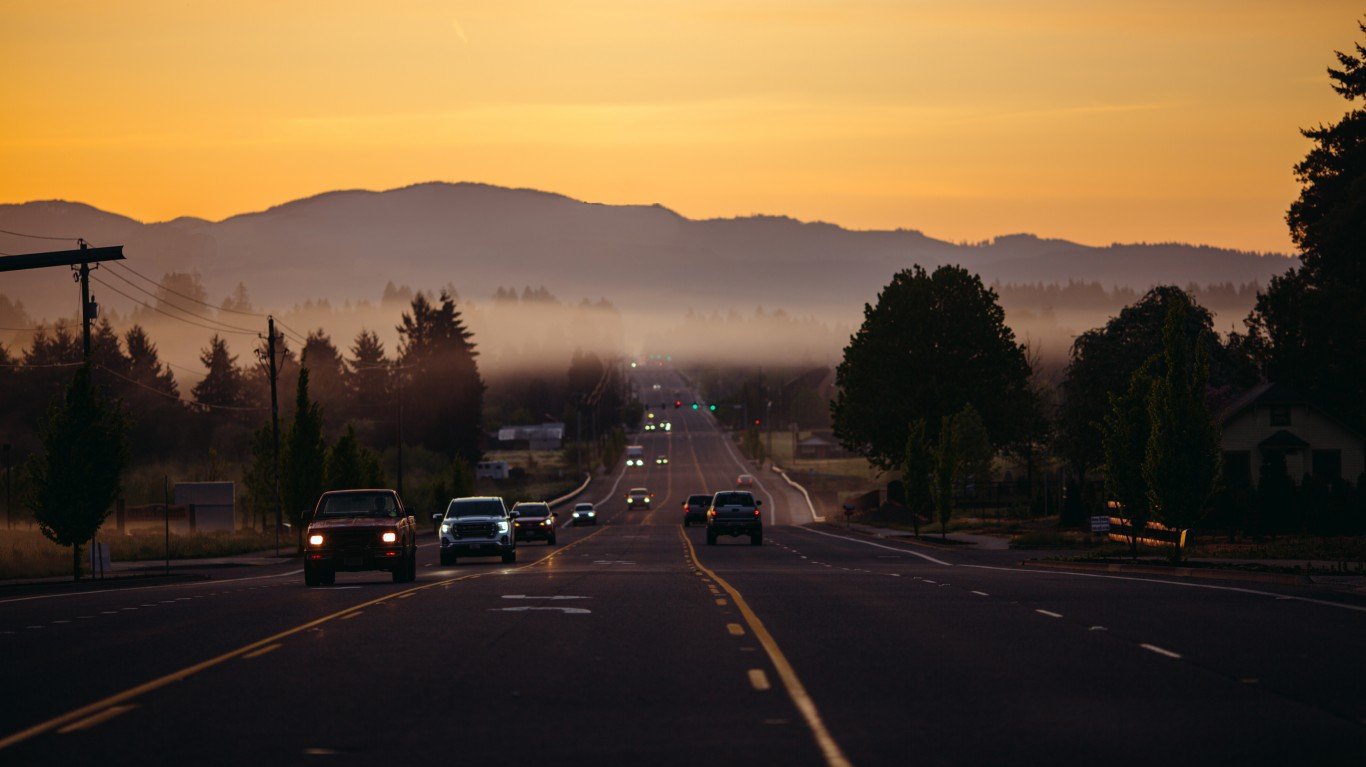
According to the U.S. Census Bureau, the average commute time in the United States is 26.9 minutes. For those who have shifted to full-time remote work, this translates to about 4.5 hours per week, or nearly 10 days a year, of time that they did not have before.
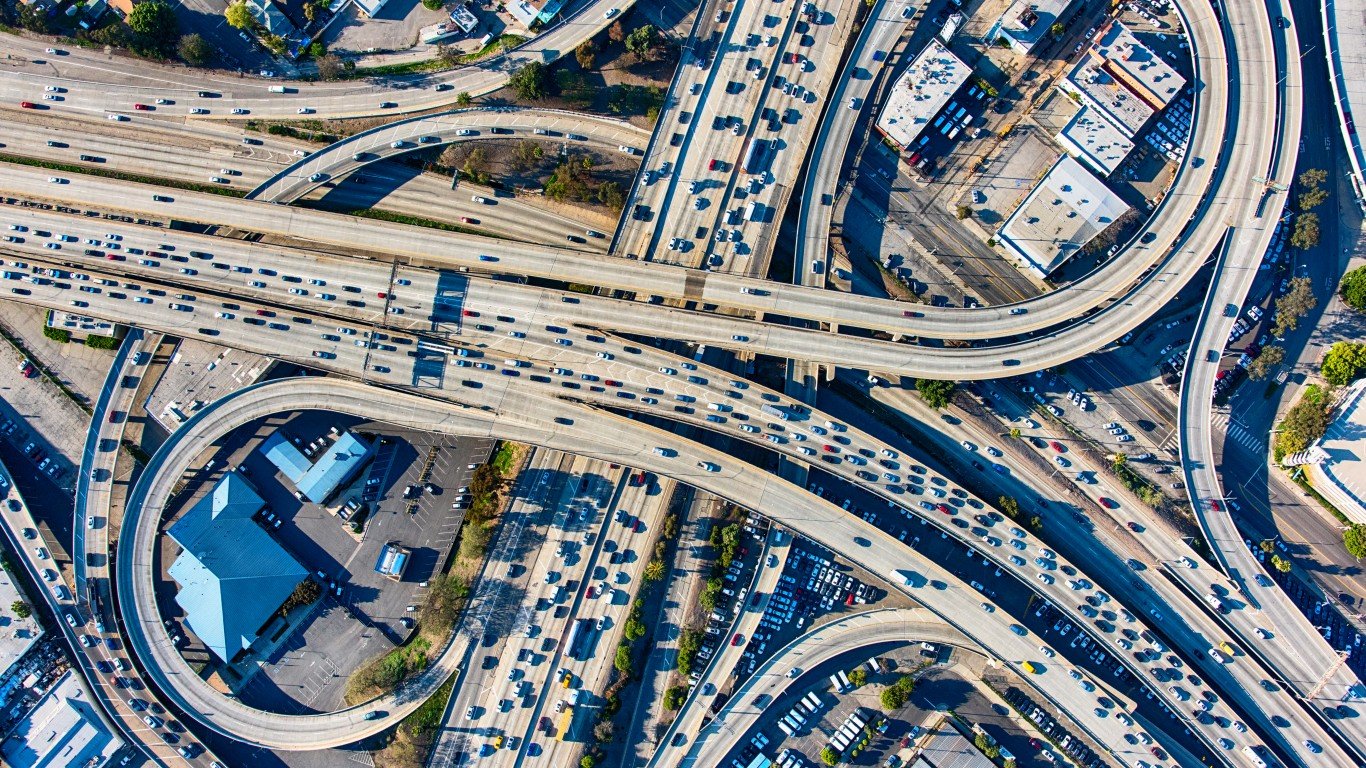
Of course, commute times vary from person to person, but in some parts of the country, workers are far more likely to have longer commutes than in others. Using census data, 24/7 Wall St. identified the 50 American towns with the longest commutes.
Among the towns on this list, average commute times range from about 46 minutes up to over 67 minutes. Over the course of a week, these commute times add up, from nearly eight hours up to over 11 – and in some cases, more than three weeks over the course of a year for those who commute every Monday through Friday.
Several towns on this list, including Chappaqua, New York and Greenville in Westchester County, New York, have reliable public transportation systems into Manhattan, and the share of workers commuting with public transit far exceeds the 4.6% national average. In most cases, public transportation is less direct than simply driving from door to door, adding to overall commute time.
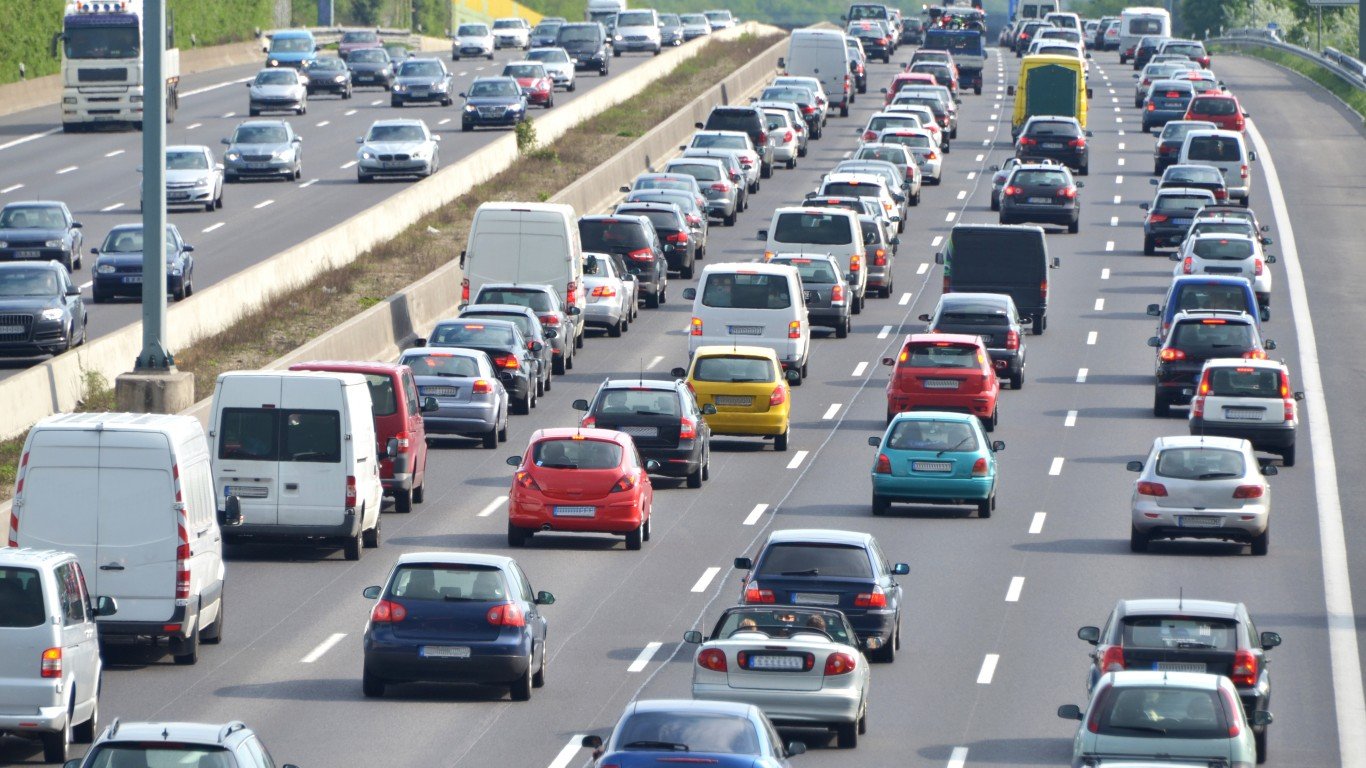
Other towns on this list are more isolated, located beyond the outskirts of the nearest major city. In many of these places, the share of commuters driving themselves to work far exceeds the 74.9% national average. Here is a look at the cities where people lose the most time driving each year.
Click here to see towns where it takes the longest to get to work
Click here to see our detailed methodology
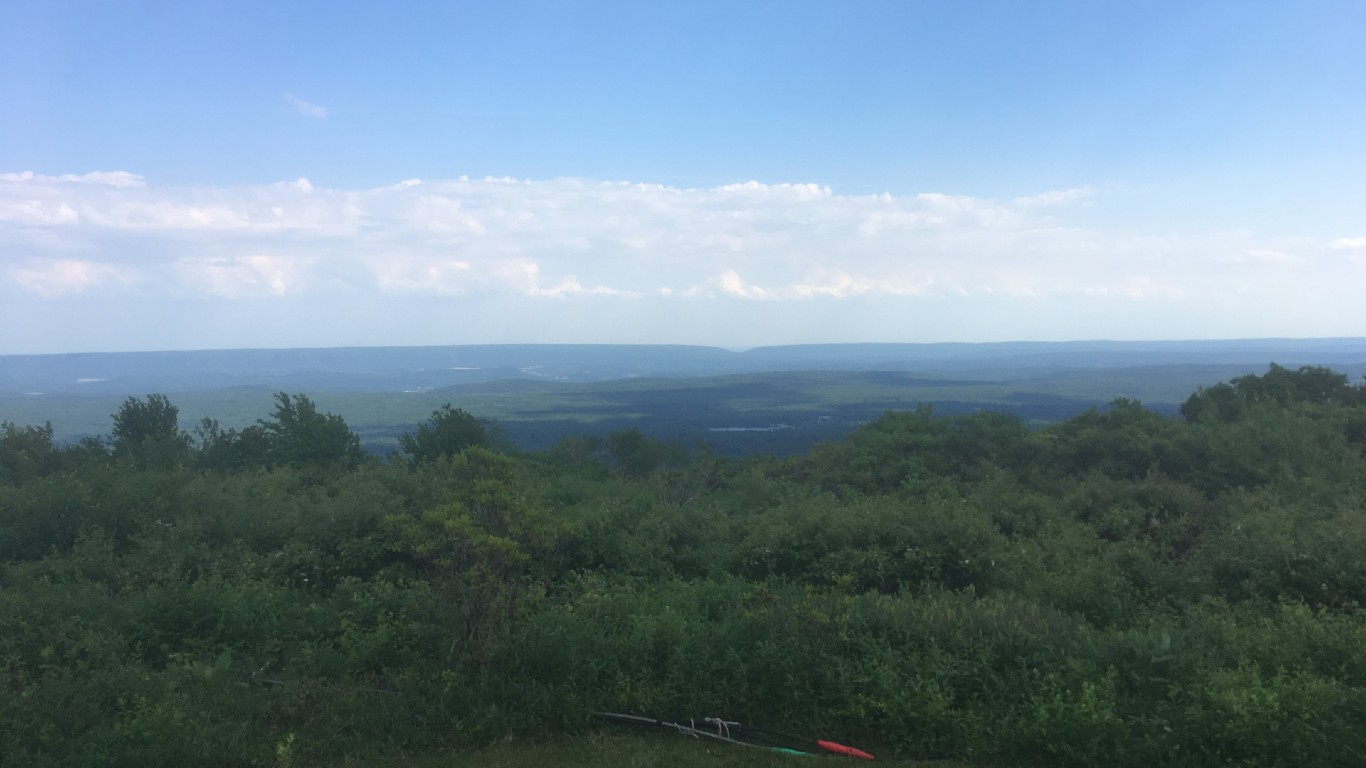
50. Effort, Pennsylvania
> Avg. commute time (minutes): 46.3
> Share of commuters driving alone: 85.2% — 1,874th highest of 8,238 towns
> Share of commuters carpooling: 5.2% — 1,744th lowest of 8,238 towns
> Share of commuters using public transit: 6.0% — 890th highest of 8,238 towns
[in-text-ad]
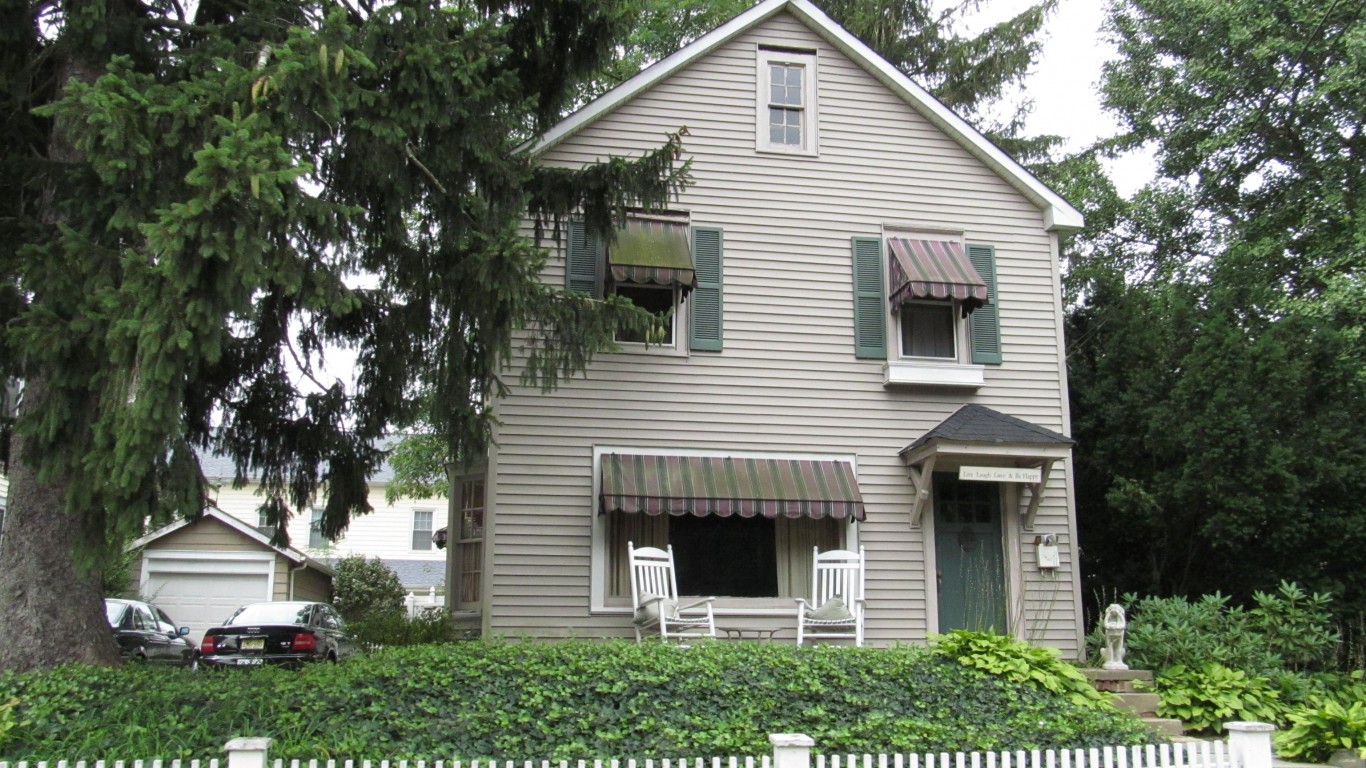
49. Rumson, New Jersey
> Avg. commute time (minutes): 46.5
> Share of commuters driving alone: 52.5% — 146th lowest of 8,238 towns
> Share of commuters carpooling: 5.3% — 1,752nd lowest of 8,238 towns
> Share of commuters using public transit: 24.8% — 49th highest of 8,238 towns
[recirclink id=987778]
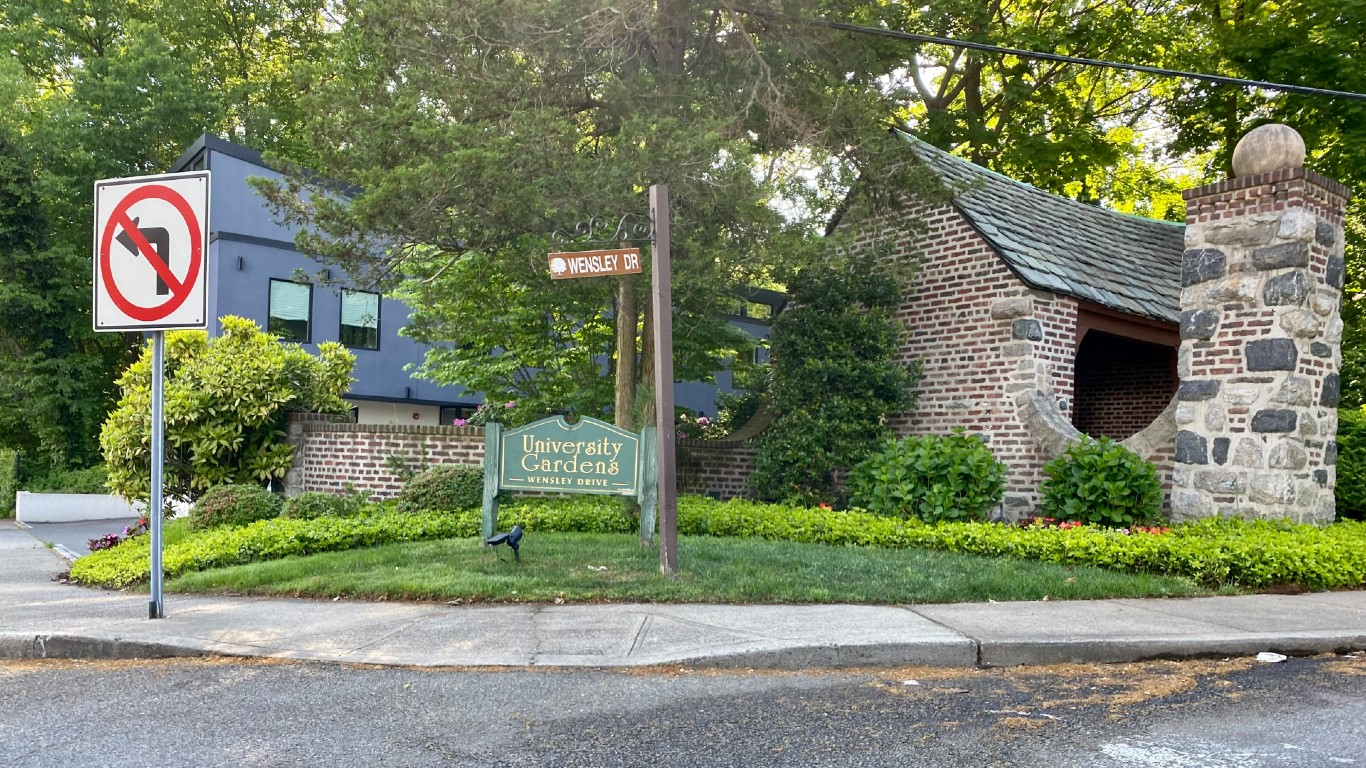
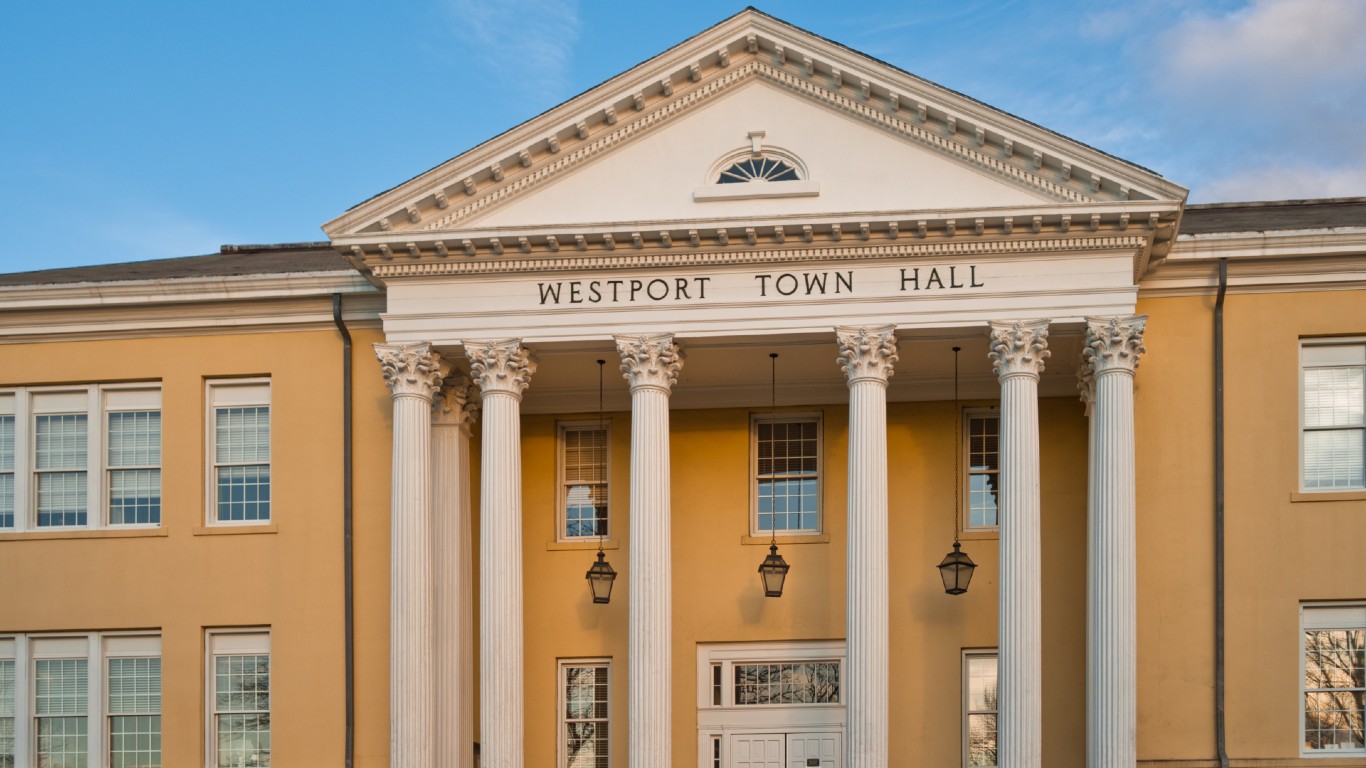
48. University Gardens, New York
> Avg. commute time (minutes): 46.5
> Share of commuters driving alone: 45.7% — 77th lowest of 8,238 towns
> Share of commuters carpooling: 11.3% — 2,068th highest of 8,238 towns
> Share of commuters using public transit: 32.0% — 18th highest of 8,238 towns
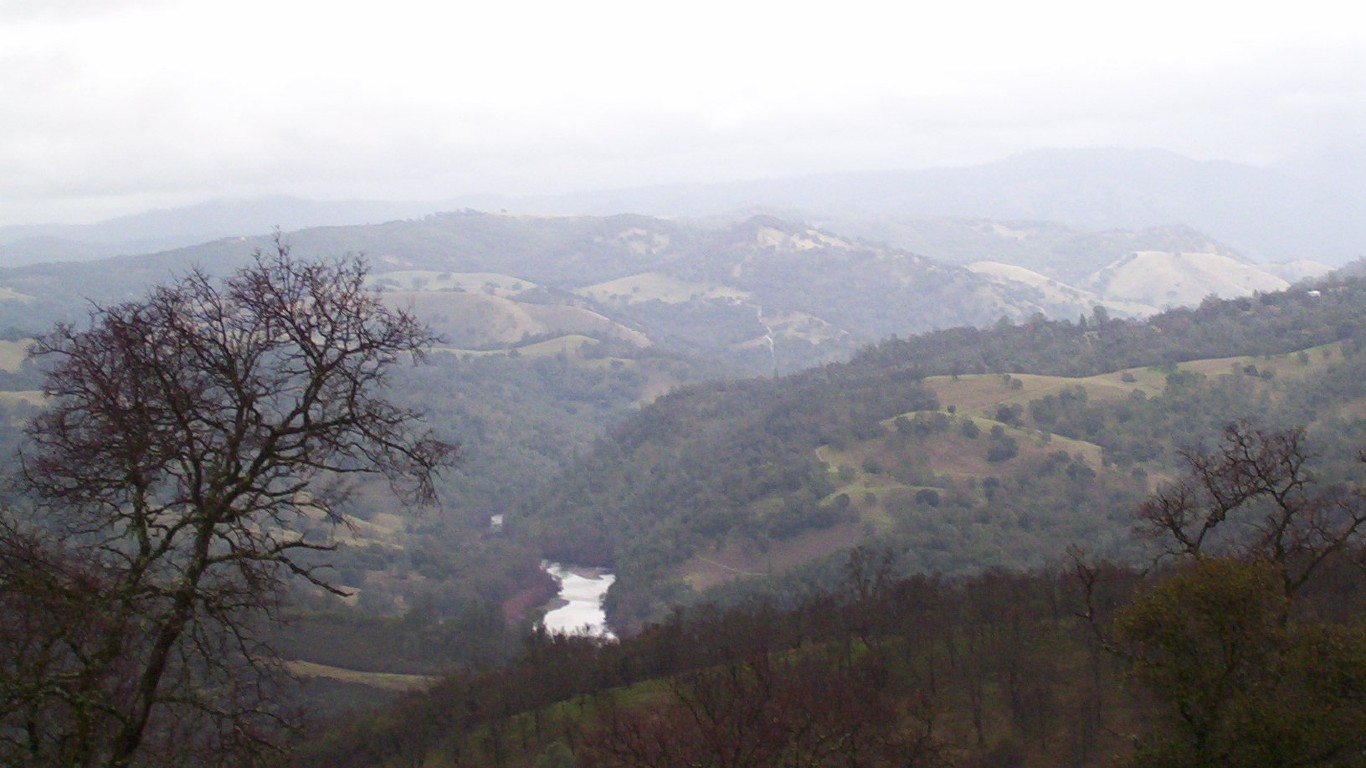
47. Rancho Calaveras, California
> Avg. commute time (minutes): 46.5
> Share of commuters driving alone: 85.8% — 1,601st highest of 8,238 towns
> Share of commuters carpooling: 9.5% — 3,177th highest of 8,238 towns
> Share of commuters using public transit: 0.2% — 3,614th lowest of 8,238 towns
[in-text-ad-2]
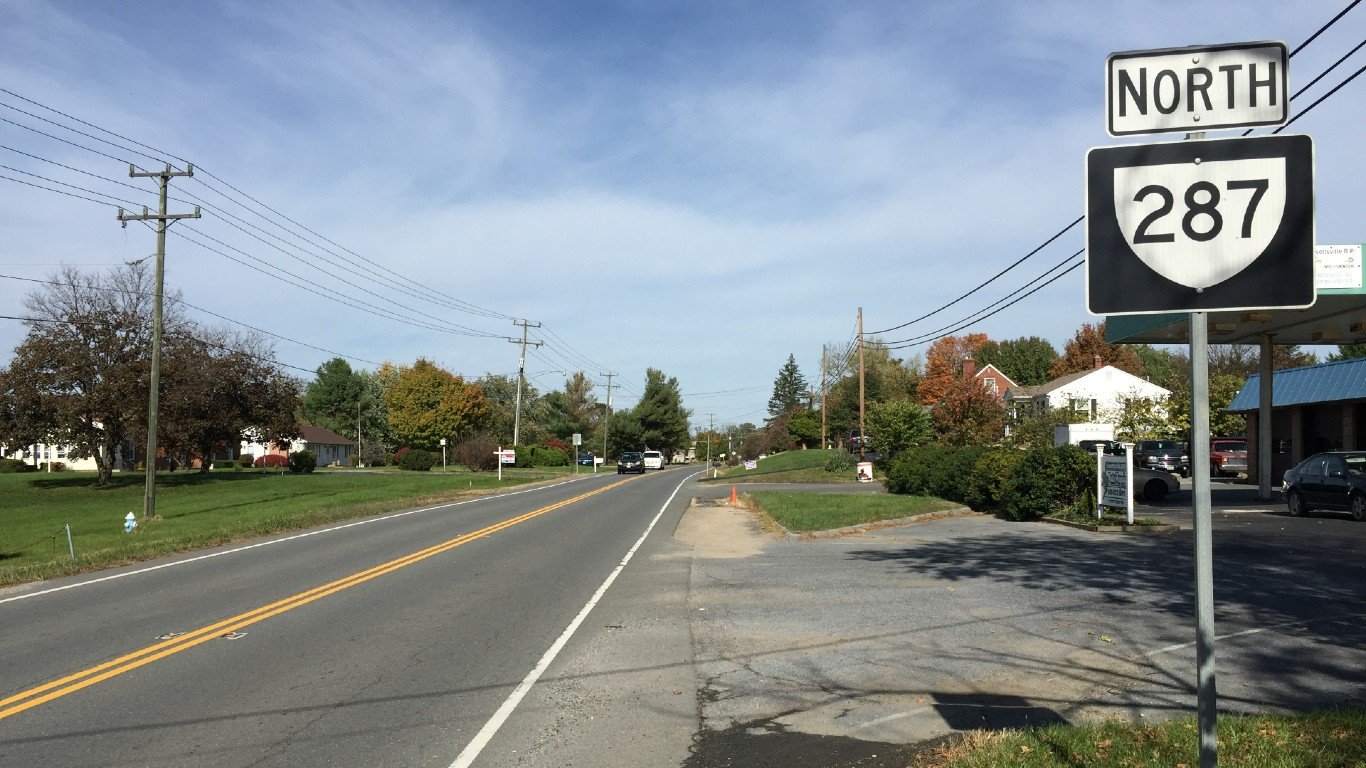
46. Lovettsville, Virginia
> Avg. commute time (minutes): 46.5
> Share of commuters driving alone: 75.6% — 2,333rd lowest of 8,238 towns
> Share of commuters carpooling: 6.8% — 2,956th lowest of 8,238 towns
> Share of commuters using public transit: 1.9% — 2,088th highest of 8,238 towns
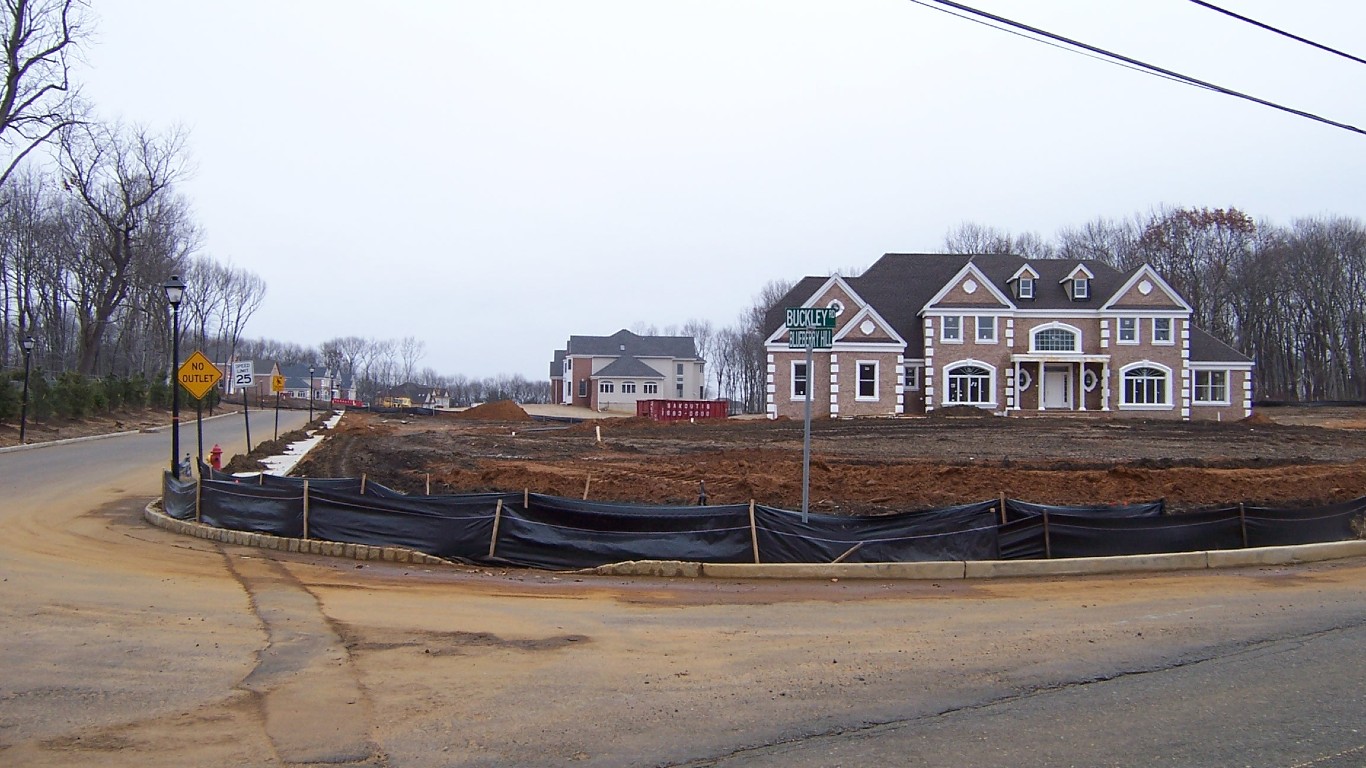
45. Robertsville, New Jersey
> Avg. commute time (minutes): 46.6
> Share of commuters driving alone: 66.7% — 727th lowest of 8,238 towns
> Share of commuters carpooling: 5.1% — 1,664th lowest of 8,238 towns
> Share of commuters using public transit: 15.6% — 198th highest of 8,238 towns
[in-text-ad]
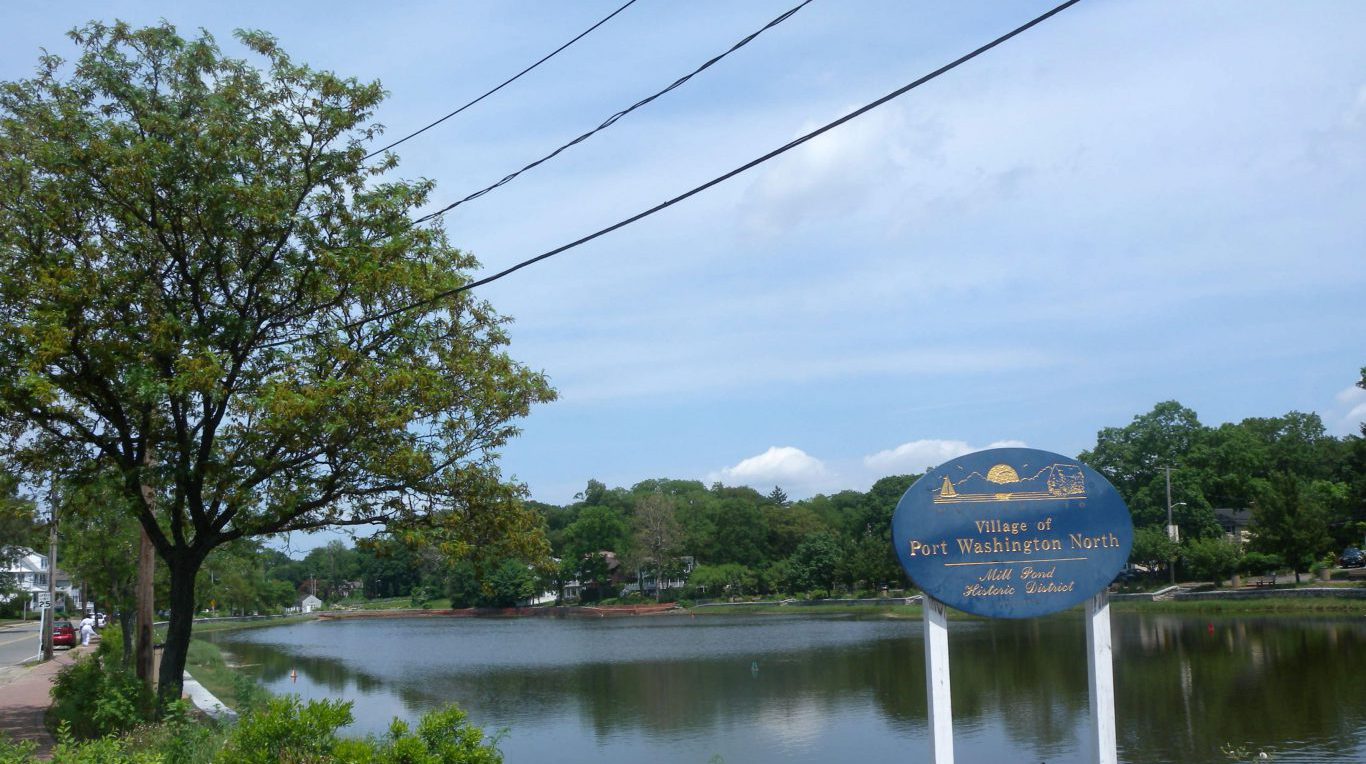
44. Port Washington North, New York
> Avg. commute time (minutes): 46.7
> Share of commuters driving alone: 50.9% — 120th lowest of 8,238 towns
> Share of commuters carpooling: 4.3% — 1,122nd lowest of 8,238 towns
> Share of commuters using public transit: 30.9% — 26th highest of 8,238 towns
[recirclink id=1044820]
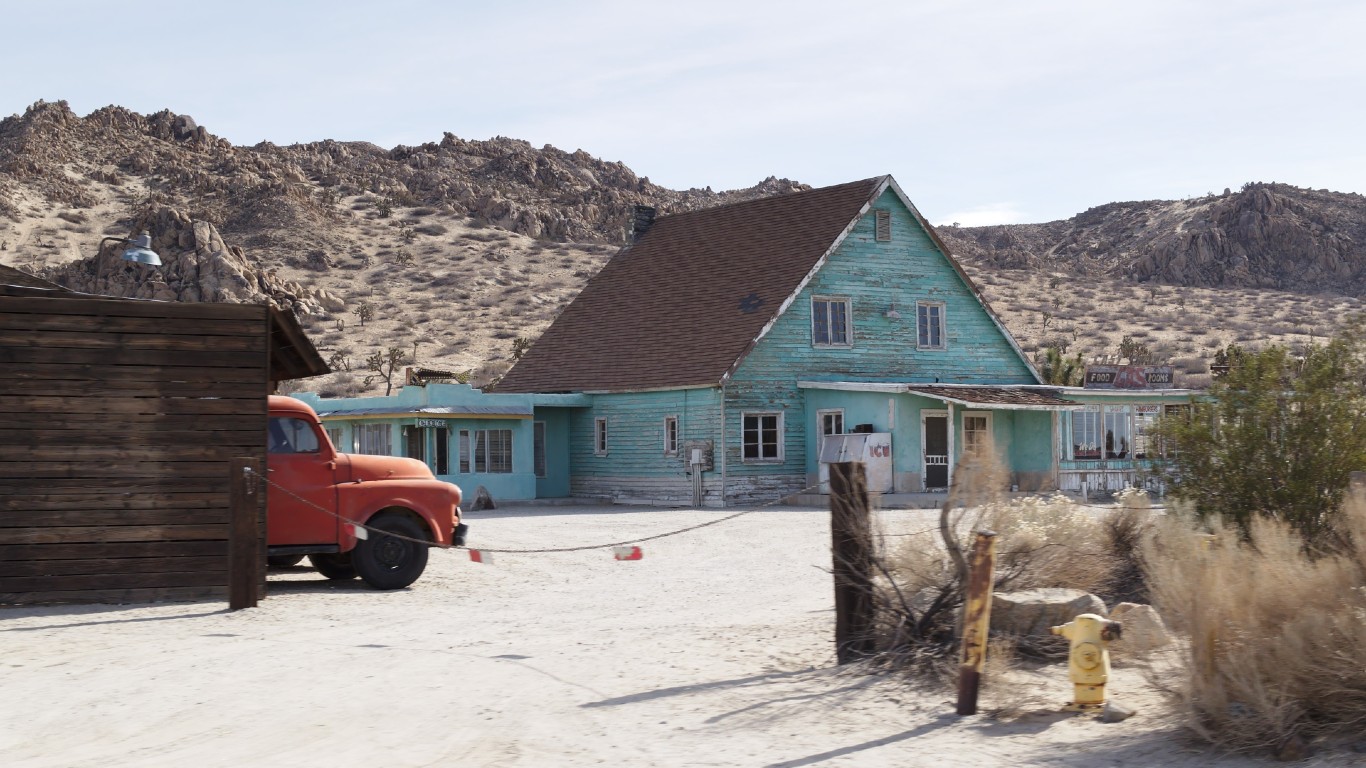
43. Lake Los Angeles, California
> Avg. commute time (minutes): 46.8
> Share of commuters driving alone: 80.4% — 4,055th highest of 8,238 towns
> Share of commuters carpooling: 10.4% — 2,631st highest of 8,238 towns
> Share of commuters using public transit: 0.7% — 3,331st highest of 8,238 towns
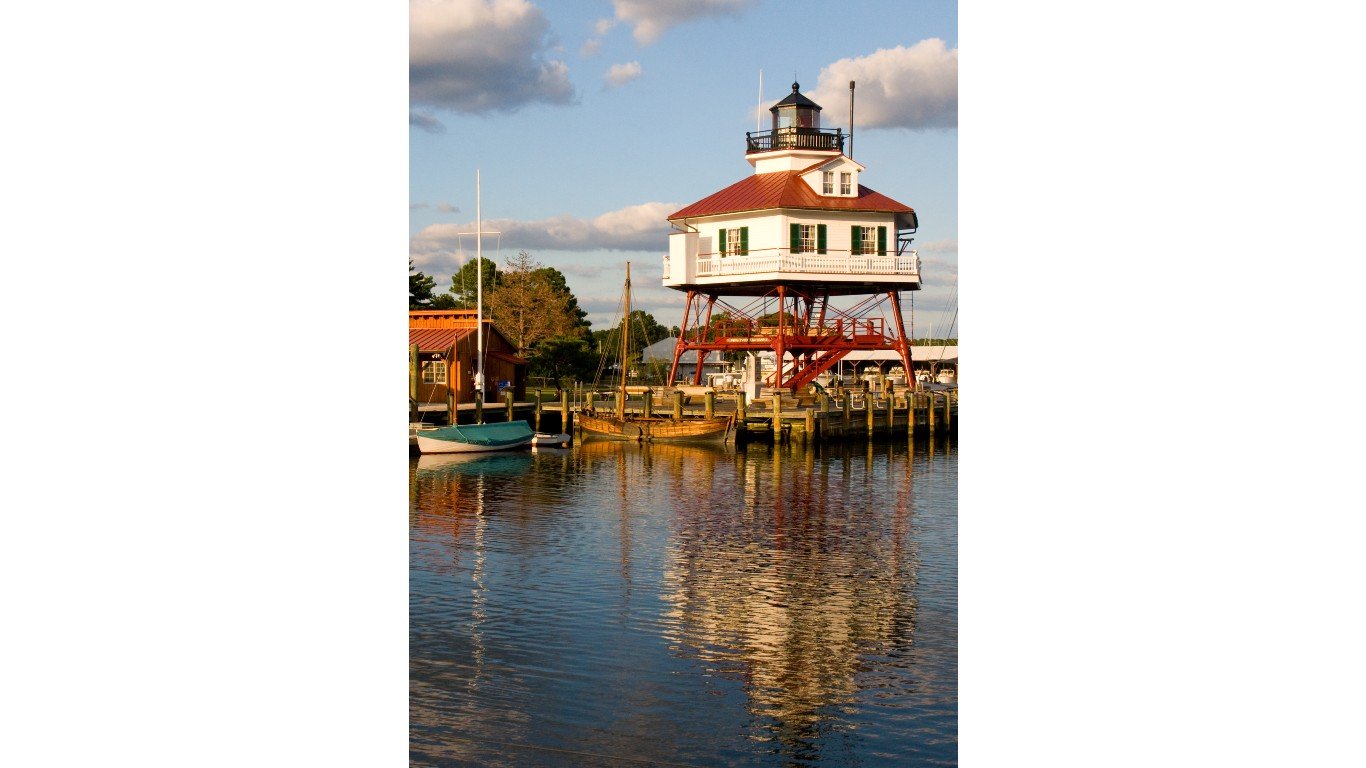
42. Chesapeake Ranch Estates, Maryland
> Avg. commute time (minutes): 46.8
> Share of commuters driving alone: 80.0% — 4,041st lowest of 8,238 towns
> Share of commuters carpooling: 5.6% — 2,028th lowest of 8,238 towns
> Share of commuters using public transit: 5.3% — 1,010th highest of 8,238 towns
[in-text-ad-2]
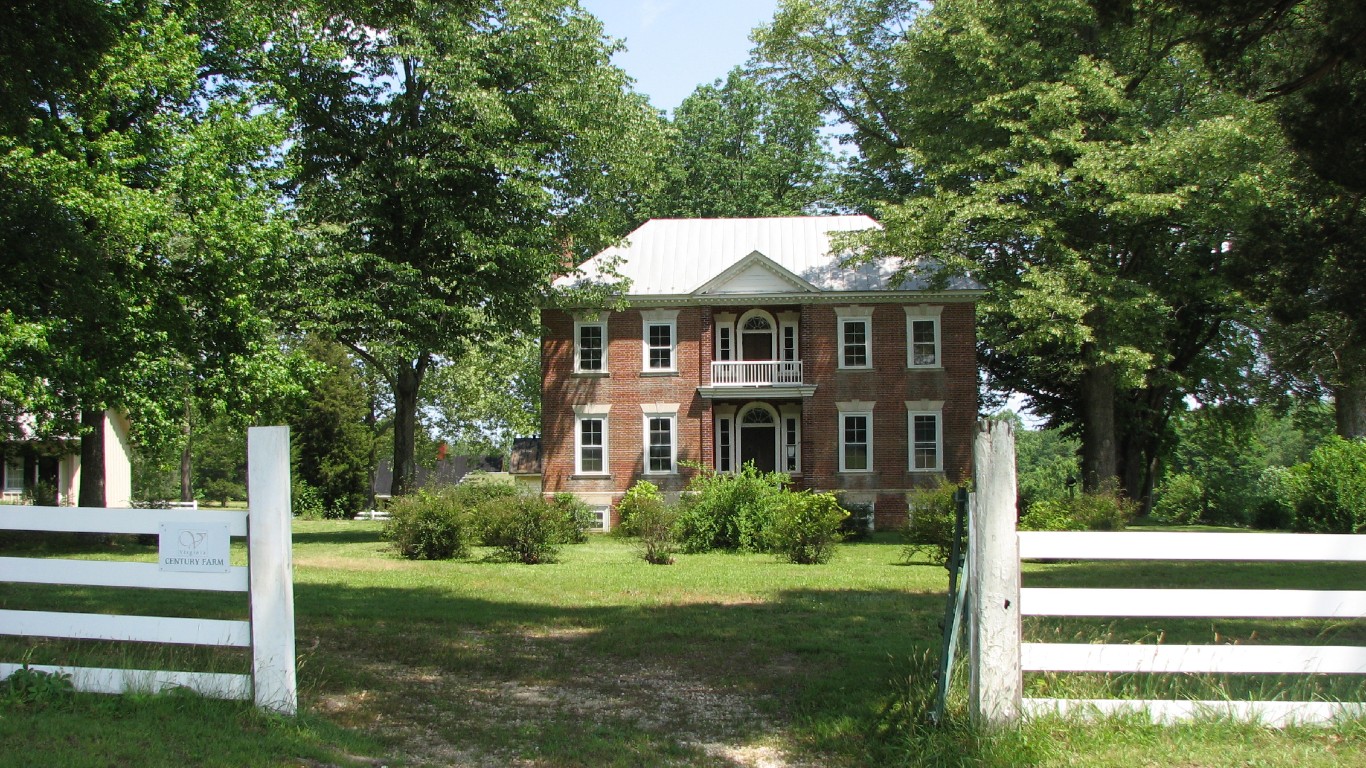
41. Lake Wilderness, Virginia
> Avg. commute time (minutes): 46.8
> Share of commuters driving alone: 82.9% — 2,848th highest of 8,238 towns
> Share of commuters carpooling: 9.1% — 3,507th highest of 8,238 towns (tied)
> Share of commuters using public transit: 1.8% — 2,139th highest of 8,238 towns (tied)

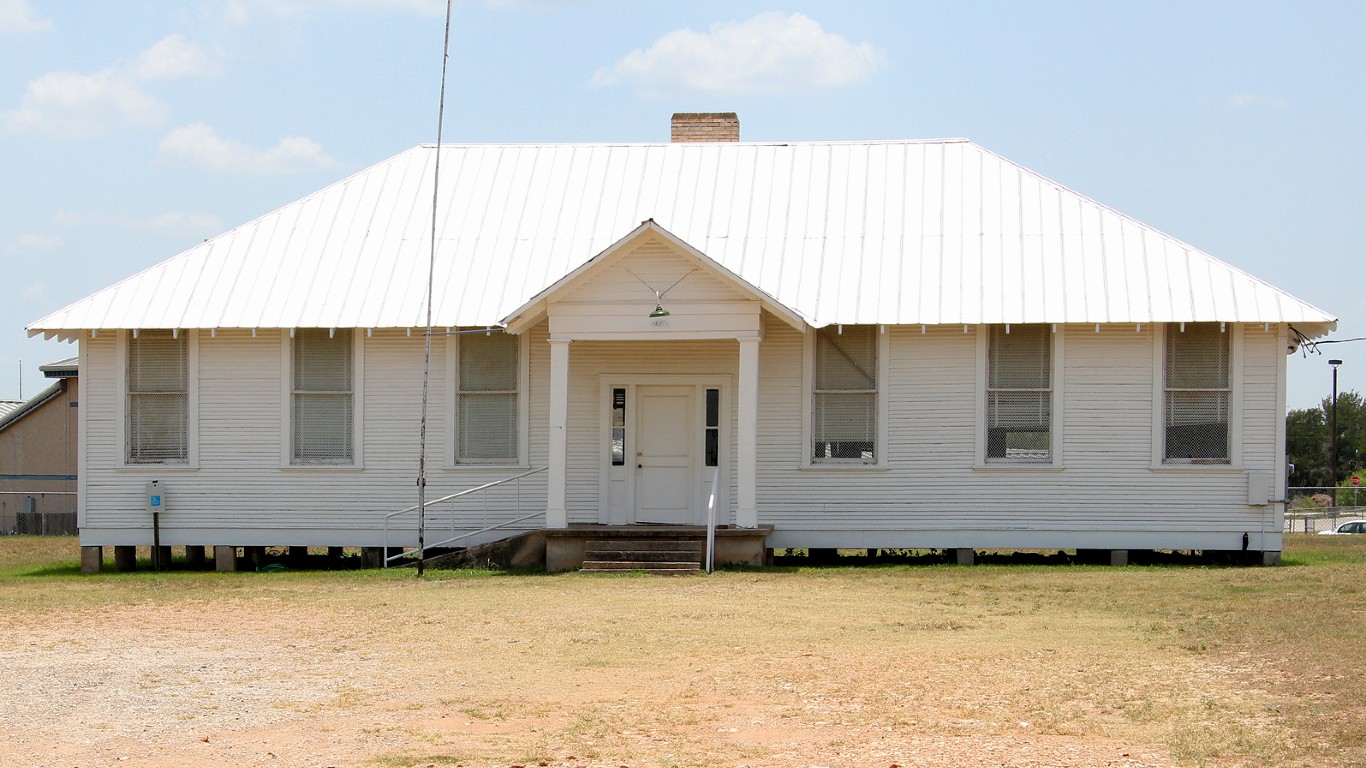
40. Combine, Texas
> Avg. commute time (minutes): 46.8
> Share of commuters driving alone: 81.0% — 3,751st highest of 8,238 towns
> Share of commuters carpooling: 14.2% — 1,003rd highest of 8,238 towns
> Share of commuters using public transit: 0.2% — 3,581st lowest of 8,238 towns
[in-text-ad]
39. Cedar Creek, Texas
> Avg. commute time (minutes): 46.8
> Share of commuters driving alone: 96.2% — 18th highest of 8,238 towns
> Share of commuters carpooling: 0.0% reported — the lowest of 8,238 towns (tied)
> Share of commuters using public transit: 2.4% — 1,806th highest of 8,238 towns
[recirclink id=1054986]
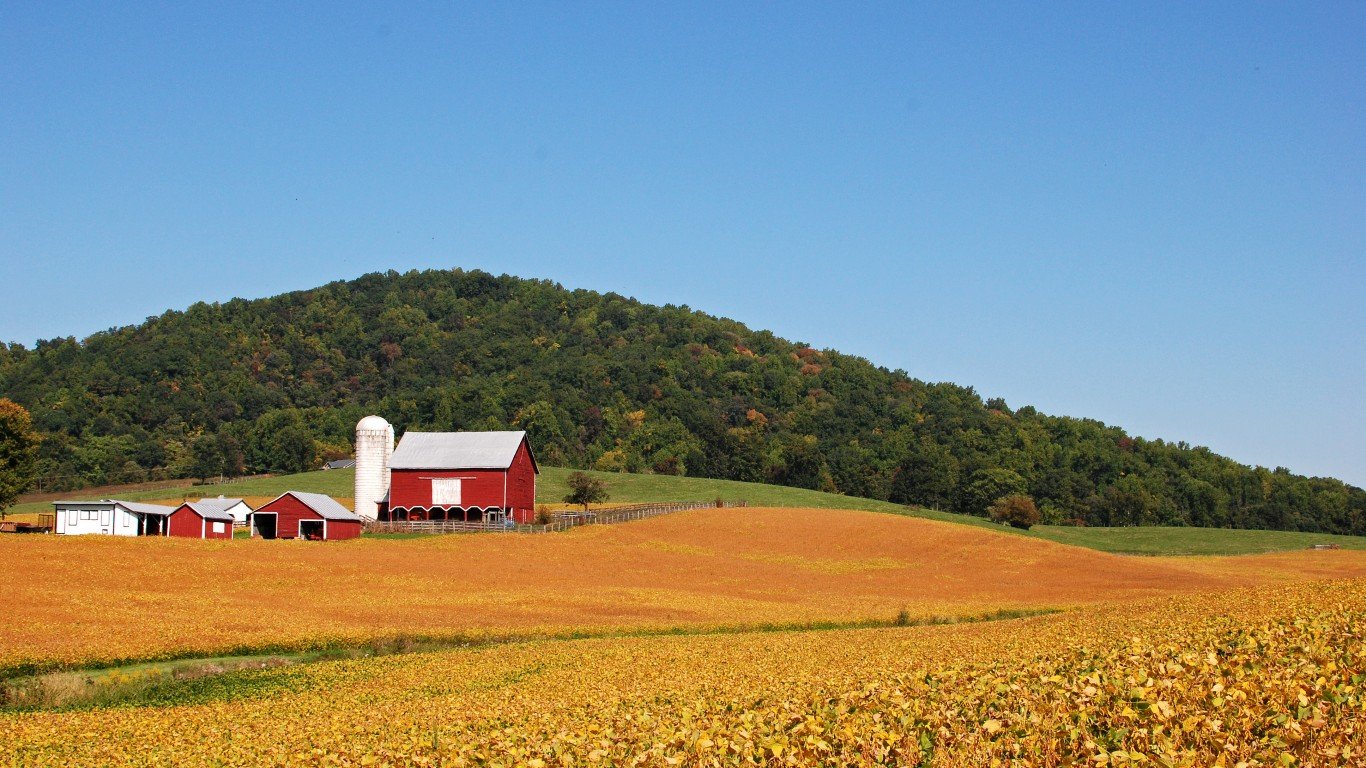
38. Shenandoah Farms, Virginia
> Avg. commute time (minutes): 47.0
> Share of commuters driving alone: 74.6% — 2,051st lowest of 8,238 towns
> Share of commuters carpooling: 15.7% — 673rd highest of 8,238 towns
> Share of commuters using public transit: 0.0% reported — the lowest of 8,238 towns (tied)
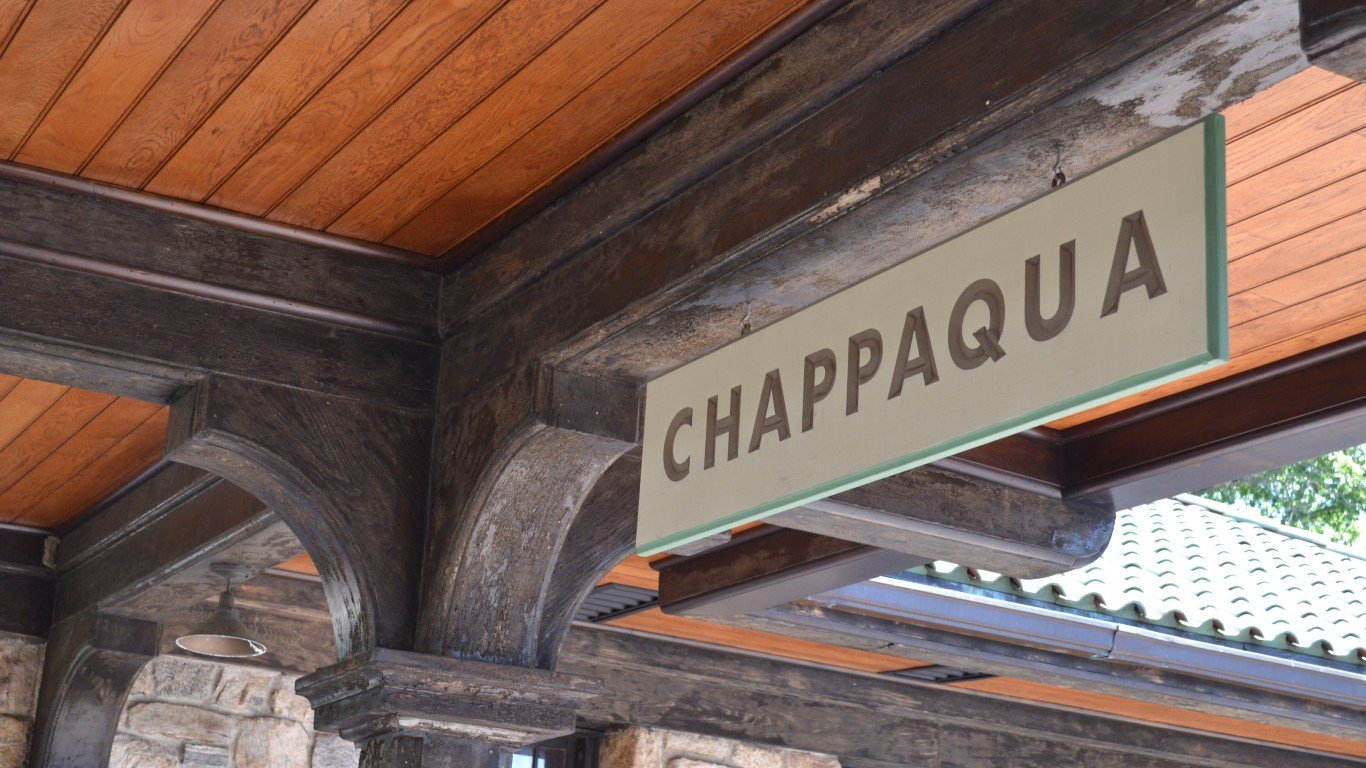
37. Chappaqua, New York
> Avg. commute time (minutes): 47.1
> Share of commuters driving alone: 58.2% — 264th lowest of 8,238 towns
> Share of commuters carpooling: 5.0% — 1,617th lowest of 8,238 towns
> Share of commuters using public transit: 30.7% — 27th highest of 8,238 towns
[in-text-ad-2]
36. East Hills, New York
> Avg. commute time (minutes): 47.4
> Share of commuters driving alone: 55.3% — 200th lowest of 8,238 towns
> Share of commuters carpooling: 4.4% — 1,179th lowest of 8,238 towns
> Share of commuters using public transit: 28.2% — 32nd highest of 8,238 towns
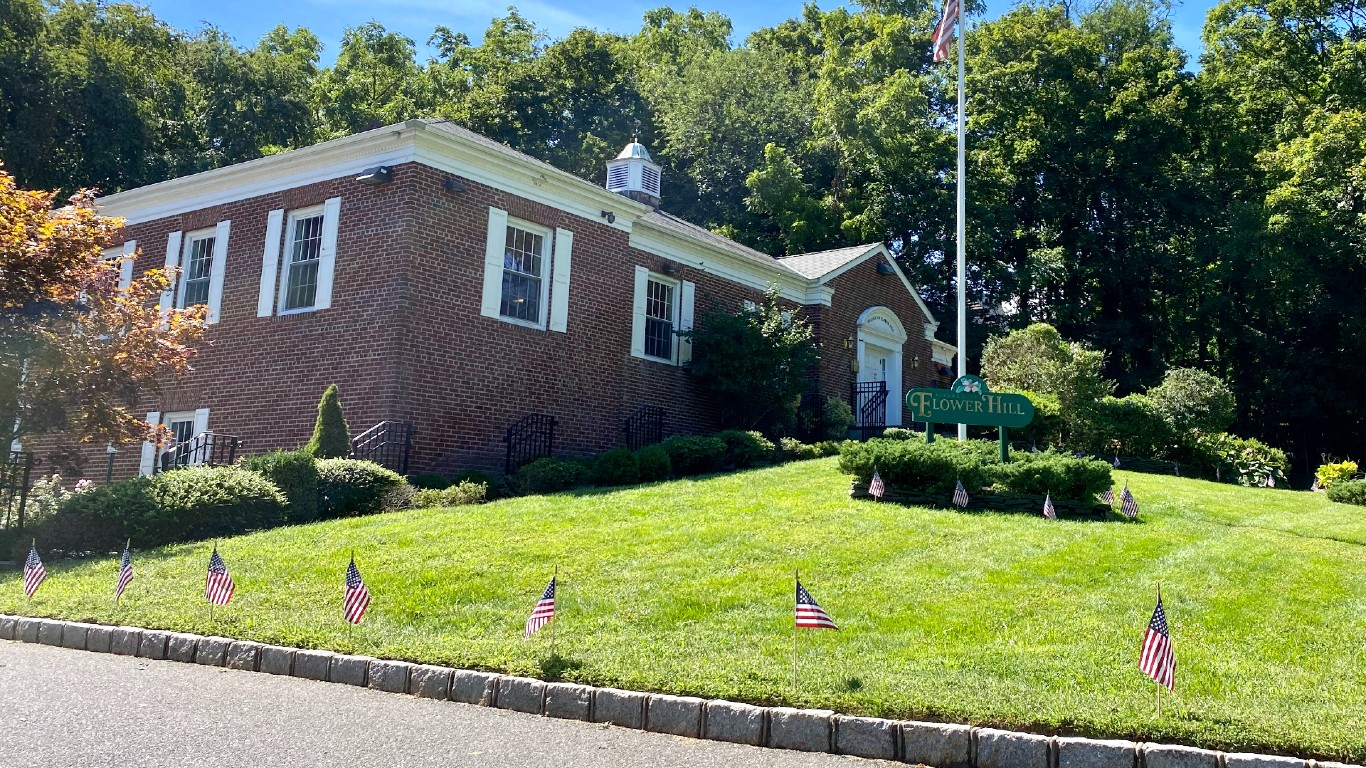
35. Flower Hill, New York
> Avg. commute time (minutes): 47.6
> Share of commuters driving alone: 60.4% — 329th lowest of 8,238 towns
> Share of commuters carpooling: 4.1% — 997th lowest of 8,238 towns
> Share of commuters using public transit: 28.7% — 31st highest of 8,238 towns
[in-text-ad]

34. Maili, Hawaii
> Avg. commute time (minutes): 47.6
> Share of commuters driving alone: 78.0% — 3,185th lowest of 8,238 towns
> Share of commuters carpooling: 8.3% — 4,058th highest of 8,238 towns
> Share of commuters using public transit: 10.2% — 451st highest of 8,238 towns
[recirclink id=1060122]
33. Cedar Crest, Massachusetts
> Avg. commute time (minutes): 47.8
> Share of commuters driving alone: 78.3% — 3,307th lowest of 8,238 towns
> Share of commuters carpooling: 8.5% — 3,909th highest of 8,238 towns
> Share of commuters using public transit: 0.7% — 3,332nd highest of 8,238 towns
32. Heron Bay, Georgia
> Avg. commute time (minutes): 47.8
> Share of commuters driving alone: 65.2% — 602nd lowest of 8,238 towns
> Share of commuters carpooling: 9.5% — 3,184th highest of 8,238 towns
> Share of commuters using public transit: 15.4% — 204th highest of 8,238 towns
[in-text-ad-2]
31. Greenville (Westchester County), New York
> Avg. commute time (minutes): 47.9
> Share of commuters driving alone: 38.0% — 39th lowest of 8,238 towns
> Share of commuters carpooling: 3.6% — 766th lowest of 8,238 towns
> Share of commuters using public transit: 44.7% — 4th highest of 8,238 towns
30. Geneva, Florida
> Avg. commute time (minutes): 48.0
> Share of commuters driving alone: 73.4% — 1,758th lowest of 8,238 towns
> Share of commuters carpooling: 21.8% — 149th highest of 8,238 towns
> Share of commuters using public transit: 0.0% reported — the lowest of 8,238 towns (tied)
[in-text-ad]
29. Indian Head, Maryland
> Avg. commute time (minutes): 48.2
> Share of commuters driving alone: 82.4% — 3,101st highest of 8,238 towns
> Share of commuters carpooling: 4.1% — 1,008th lowest of 8,238 towns
> Share of commuters using public transit: 6.8% — 772nd highest of 8,238 towns
[recirclink id=1024519]
28. Hughesville, Maryland
> Avg. commute time (minutes): 48.3
> Share of commuters driving alone: 64.1% — 512th lowest of 8,238 towns
> Share of commuters carpooling: 7.7% — 3,634th lowest of 8,238 towns (tied)
> Share of commuters using public transit: 20.3% — 95th highest of 8,238 towns
27. Auburn Lake Trails, California
> Avg. commute time (minutes): 48.4
> Share of commuters driving alone: 73.7% — 1,823rd lowest of 8,238 towns
> Share of commuters carpooling: 8.9% — 3,641st highest of 8,238 towns
> Share of commuters using public transit: 0.0% reported — the lowest of 8,238 towns (tied)
[in-text-ad-2]

26. Waianae, Hawaii
> Avg. commute time (minutes): 48.5
> Share of commuters driving alone: 65.7% — 650th lowest of 8,238 towns
> Share of commuters carpooling: 16.2% — 609th highest of 8,238 towns
> Share of commuters using public transit: 11.5% — 365th highest of 8,238 towns
25. Ridgemark, California
> Avg. commute time (minutes): 48.9
> Share of commuters driving alone: 73.0% — 1,673rd lowest of 8,238 towns
> Share of commuters carpooling: 12.9% — 1,406th highest of 8,238 towns
> Share of commuters using public transit: 0.7% — 3,407th highest of 8,238 towns
[in-text-ad]
24. Bensville, Maryland
> Avg. commute time (minutes): 49.0
> Share of commuters driving alone: 78.9% — 3,577th lowest of 8,238 towns
> Share of commuters carpooling: 9.4% — 3,282nd highest of 8,238 towns
> Share of commuters using public transit: 3.6% — 1,369th highest of 8,238 towns
[recirclink id=987778]

23. Makaha, Hawaii
> Avg. commute time (minutes): 49.1
> Share of commuters driving alone: 54.7% — 185th lowest of 8,238 towns
> Share of commuters carpooling: 21.4% — 162nd highest of 8,238 towns
> Share of commuters using public transit: 13.7% — 269th highest of 8,238 towns
22. Lake Holiday, Virginia
> Avg. commute time (minutes): 49.3
> Share of commuters driving alone: 85.8% — 1,622nd highest of 8,238 towns
> Share of commuters carpooling: 11.0% — 2,233rd highest of 8,238 towns
> Share of commuters using public transit: 1.5% — 2,399th highest of 8,238 towns
[in-text-ad-2]
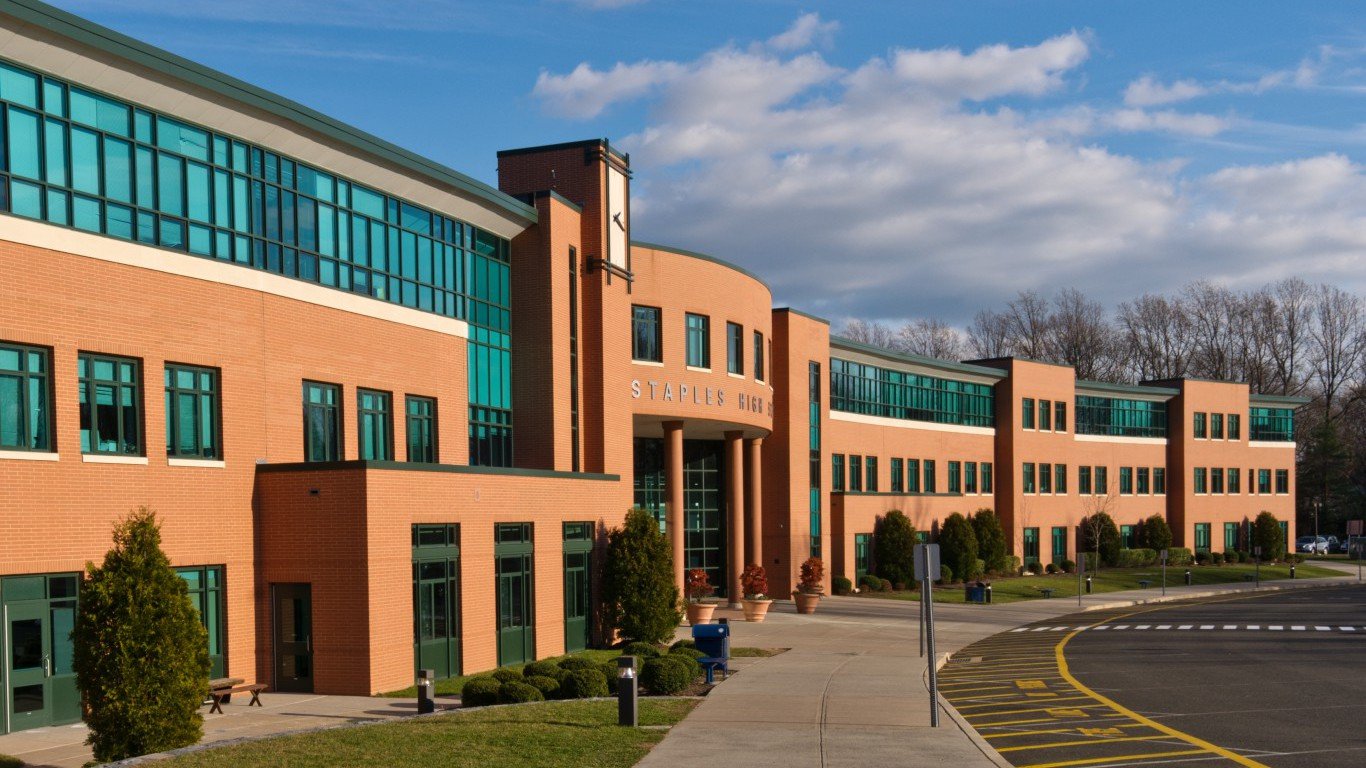
21. Staples, Connecticut
> Avg. commute time (minutes): 49.5
> Share of commuters driving alone: 54.2% — 178th lowest of 8,238 towns
> Share of commuters carpooling: 2.2% — 252nd lowest of 8,238 towns
> Share of commuters using public transit: 20.9% — 89th highest of 8,238 towns
20. Lakeview, California
> Avg. commute time (minutes): 49.6
> Share of commuters driving alone: 77.0% — 2,786th lowest of 8,238 towns
> Share of commuters carpooling: 15.4% — 733rd highest of 8,238 towns
> Share of commuters using public transit: 0.0% reported — the lowest of 8,238 towns (tied)
[in-text-ad]
19. Heritage Hills, New York
> Avg. commute time (minutes): 49.7
> Share of commuters driving alone: 79.2% — 3,702nd lowest of 8,238 towns
> Share of commuters carpooling: 3.8% — 878th lowest of 8,238 towns
> Share of commuters using public transit: 14.1% — 253rd highest of 8,238 towns
[recirclink id=1044820]
18. Longbranch, Washington
> Avg. commute time (minutes): 49.7
> Share of commuters driving alone: 83.5% — 2,568th highest of 8,238 towns
> Share of commuters carpooling: 2.5% — 346th lowest of 8,238 towns
> Share of commuters using public transit: 0.0% reported — the lowest of 8,238 towns (tied)

17. Oak Hills, California
> Avg. commute time (minutes): 49.9
> Share of commuters driving alone: 79.7% — 3,904th lowest of 8,238 towns
> Share of commuters carpooling: 15.2% — 786th highest of 8,238 towns
> Share of commuters using public transit: 0.0% reported — the lowest of 8,238 towns (tied)
[in-text-ad-2]
16. Meadowbrook, California
> Avg. commute time (minutes): 50.3
> Share of commuters driving alone: 67.6% — 824th lowest of 8,238 towns
> Share of commuters carpooling: 23.9% — 87th highest of 8,238 towns
> Share of commuters using public transit: 4.5% — 1,138th highest of 8,238 towns
15. Bryans Road, Maryland
> Avg. commute time (minutes): 50.3
> Share of commuters driving alone: 79.1% — 3,653rd lowest of 8,238 towns
> Share of commuters carpooling: 8.1% — 4,007th lowest of 8,238 towns
> Share of commuters using public transit: 6.7% — 778th highest of 8,238 towns
[in-text-ad]
14. Tehaleh, Washington
> Avg. commute time (minutes): 50.6
> Share of commuters driving alone: 69.3% — 1,007th lowest of 8,238 towns
> Share of commuters carpooling: 2.2% — 251st lowest of 8,238 towns
> Share of commuters using public transit: 0.9% — 3,018th highest of 8,238 towns
[recirclink id=1054986]
13. Coleytown, Connecticut
> Avg. commute time (minutes): 50.7
> Share of commuters driving alone: 43.5% — 65th lowest of 8,238 towns
> Share of commuters carpooling: 4.3% — 1,141st lowest of 8,238 towns
> Share of commuters using public transit: 18.8% — 116th highest of 8,238 towns
12. Pocono Woodland Lakes, Pennsylvania
> Avg. commute time (minutes): 50.7
> Share of commuters driving alone: 78.4% — 3,336th lowest of 8,238 towns
> Share of commuters carpooling: 8.9% — 3,673rd highest of 8,238 towns
> Share of commuters using public transit: 4.0% — 1,253rd highest of 8,238 towns
[in-text-ad-2]
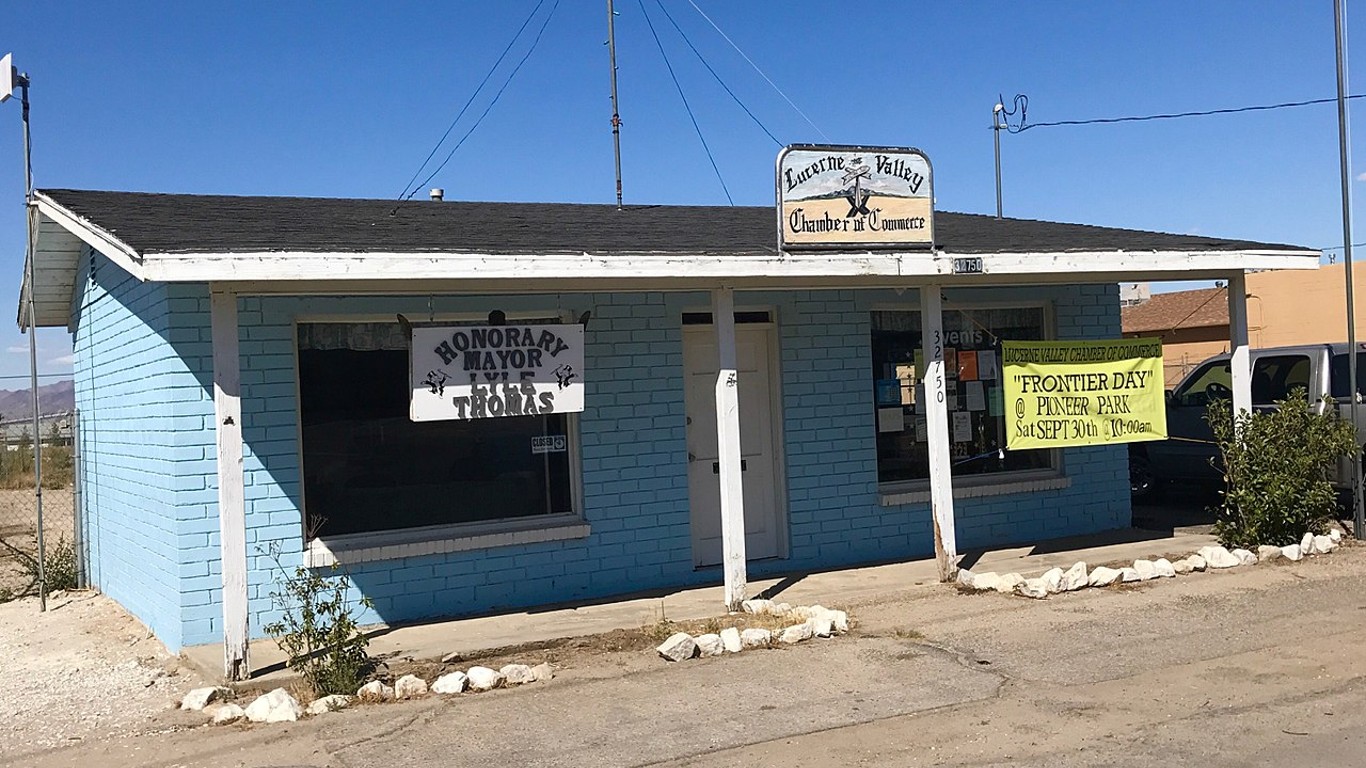
11. Lucerne Valley, California
> Avg. commute time (minutes): 51.1
> Share of commuters driving alone: 80.8% — 3,876th highest of 8,238 towns
> Share of commuters carpooling: 6.7% — 2,848th lowest of 8,238 towns
> Share of commuters using public transit: 0.1% — 3,295th lowest of 8,238 towns

10. Hansville, Washington
> Avg. commute time (minutes): 51.2
> Share of commuters driving alone: 60.6% — 333rd lowest of 8,238 towns
> Share of commuters carpooling: 12.7% — 1,497th highest of 8,238 towns
> Share of commuters using public transit: 10.4% — 439th highest of 8,238 towns
[in-text-ad]
9. Upper Greenwood Lake, New Jersey
> Avg. commute time (minutes): 52.5
> Share of commuters driving alone: 78.3% — 3,324th lowest of 8,238 towns
> Share of commuters carpooling: 9.0% — 3,588th highest of 8,238 towns
> Share of commuters using public transit: 4.0% — 1,248th highest of 8,238 towns
[recirclink id=1060122]
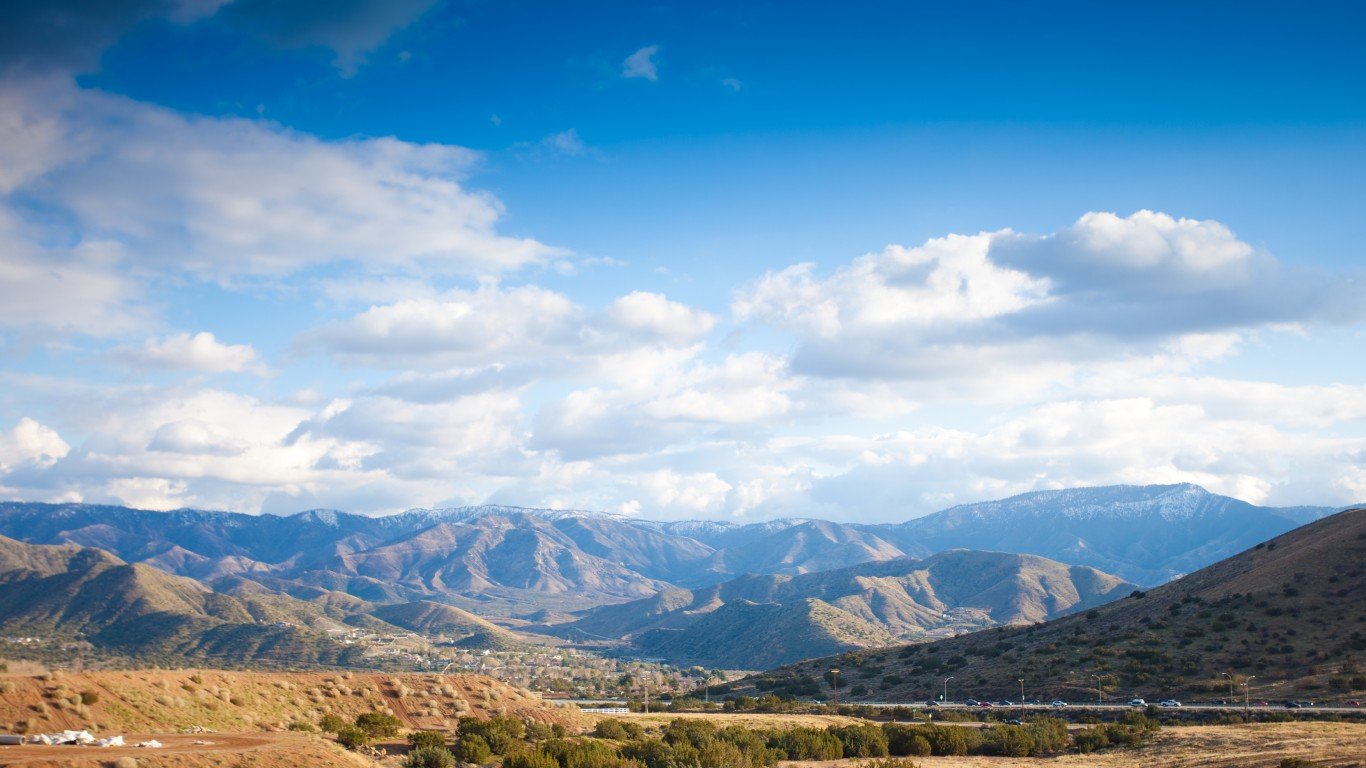
8. Acton, California
> Avg. commute time (minutes): 52.7
> Share of commuters driving alone: 77.2% — 2,883rd lowest of 8,238 towns
> Share of commuters carpooling: 12.6% — 1,517th highest of 8,238 towns
> Share of commuters using public transit: 0.8% — 3,186th highest of 8,238 towns
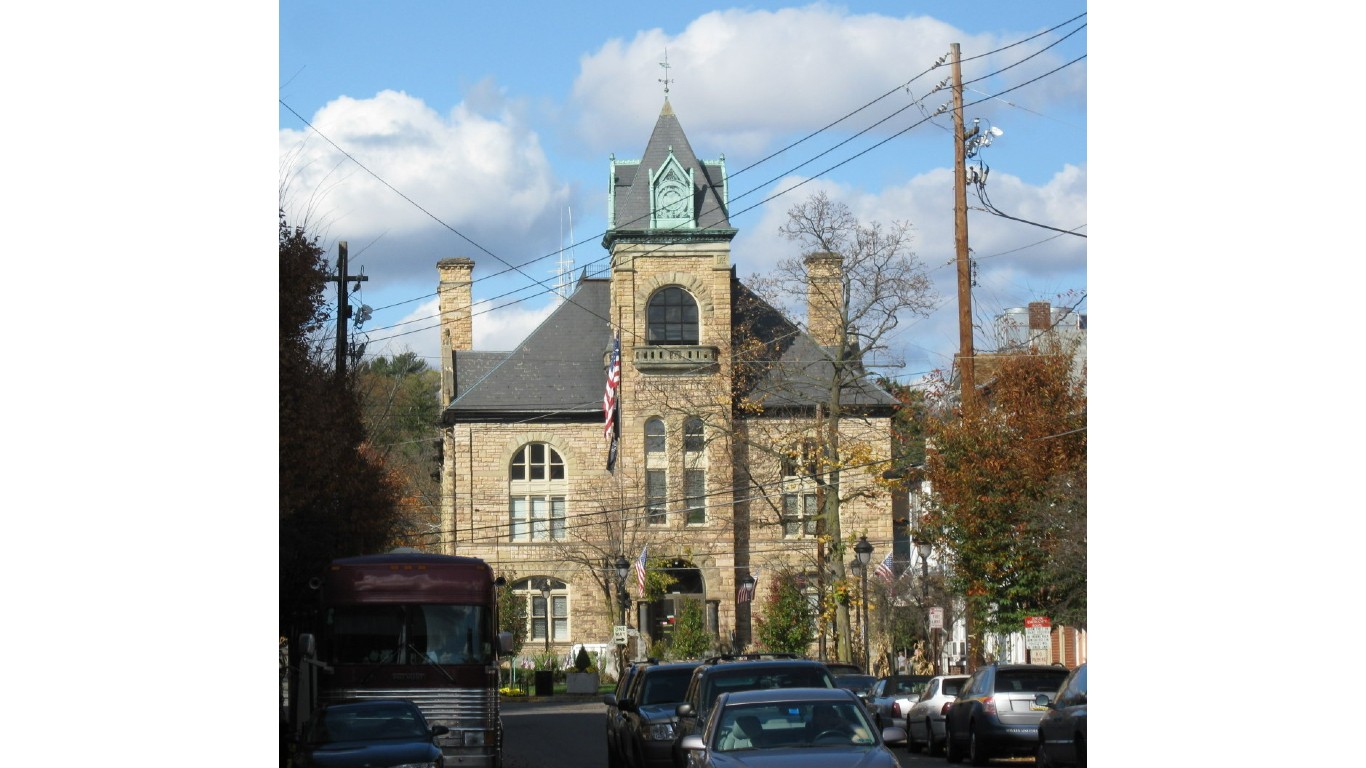
7. Penn Estates, Pennsylvania
> Avg. commute time (minutes): 52.9
> Share of commuters driving alone: 67.2% — 787th lowest of 8,238 towns
> Share of commuters carpooling: 20.0% — 217th highest of 8,238 towns
> Share of commuters using public transit: 4.4% — 1,158th highest of 8,238 towns
[in-text-ad-2]
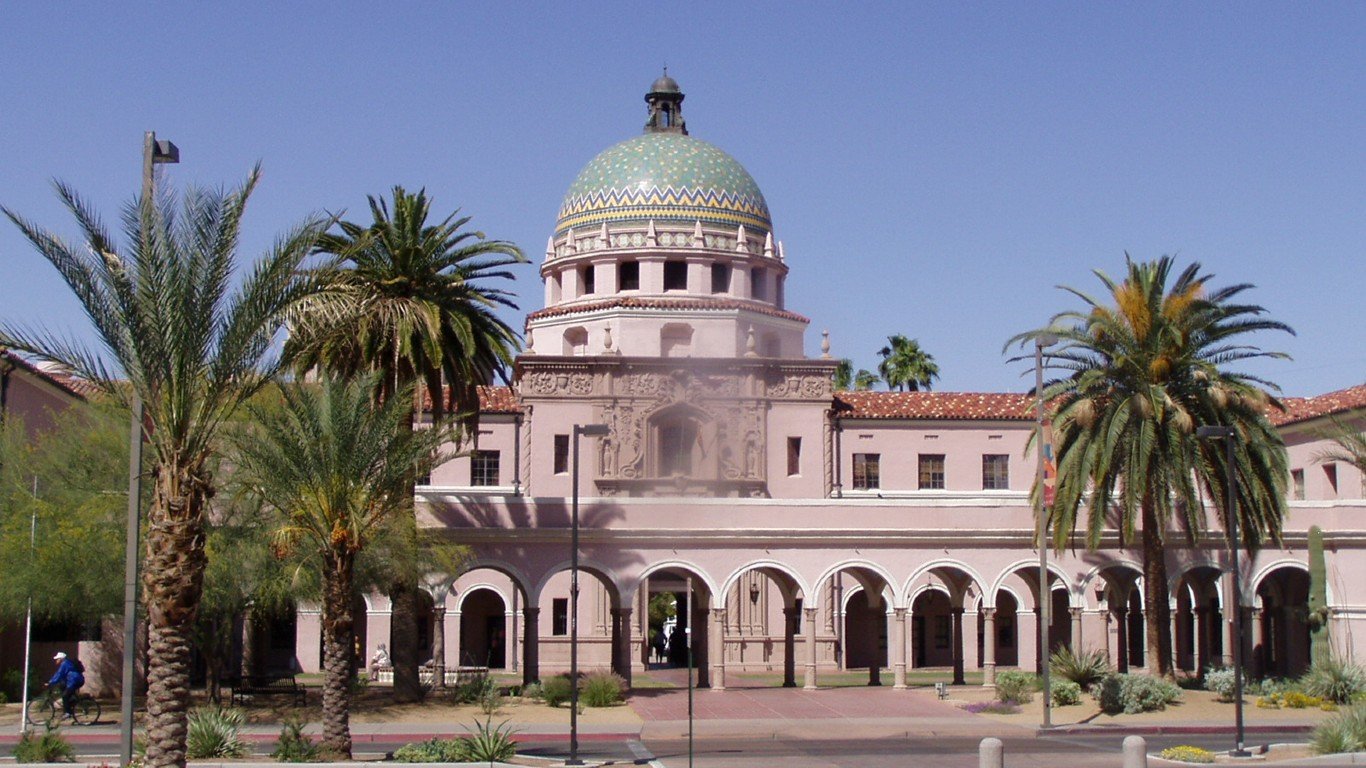
6. Three Points, Arizona
> Avg. commute time (minutes): 55.1
> Share of commuters driving alone: 83.3% — 2,676th highest of 8,238 towns
> Share of commuters carpooling: 6.3% — 2,562nd lowest of 8,238 towns
> Share of commuters using public transit: 0.0% reported — the lowest of 8,238 towns (tied)
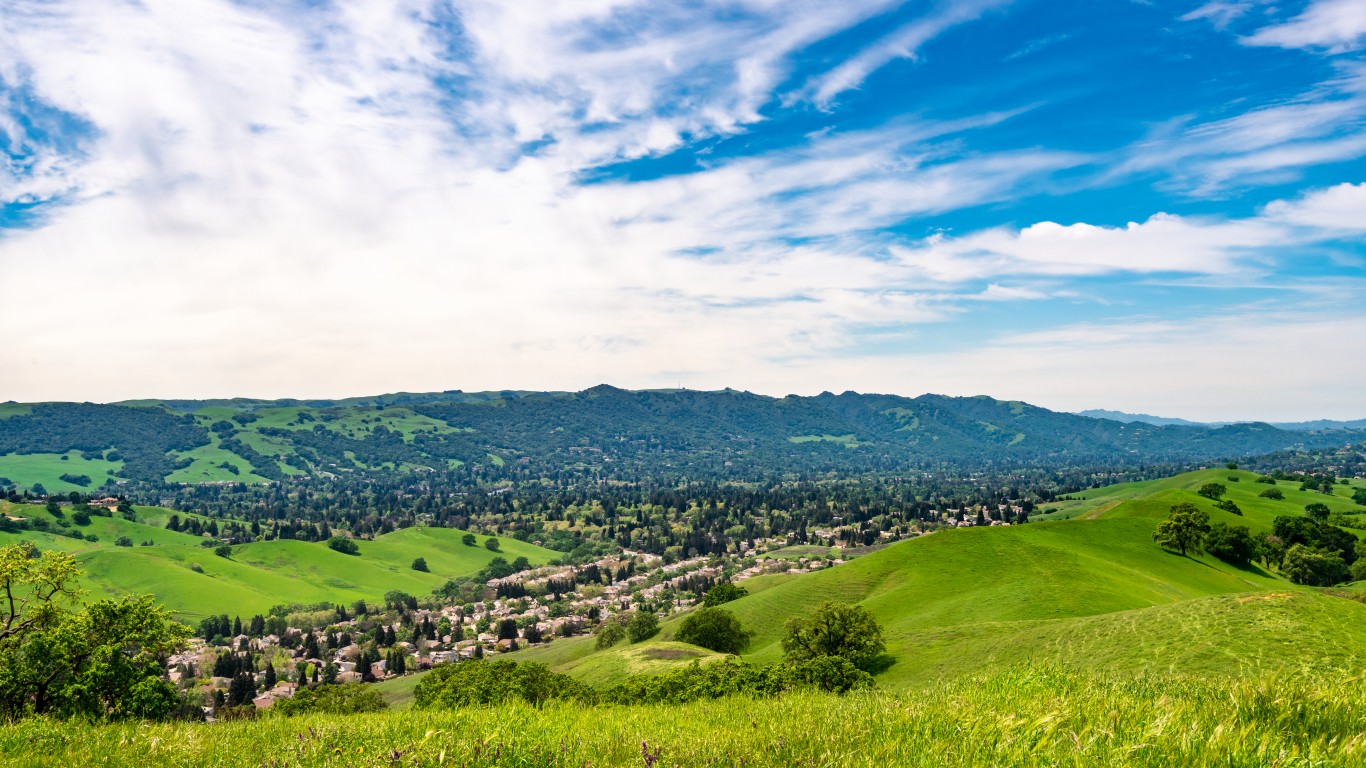
5. Camino Tassajara, California
> Avg. commute time (minutes): 60.7
> Share of commuters driving alone: 56.1% — 210th lowest of 8,238 towns
> Share of commuters carpooling: 3.5% — 706th lowest of 8,238 towns
> Share of commuters using public transit: 11.8% — 345th highest of 8,238 towns
[in-text-ad]
4. Saw Creek, Pennsylvania
> Avg. commute time (minutes): 65.5
> Share of commuters driving alone: 75.8% — 2,395th lowest of 8,238 towns
> Share of commuters carpooling: 11.6% — 1,955th highest of 8,238 towns
> Share of commuters using public transit: 4.6% — 1,125th highest of 8,238 towns
[recirclink id=1024519]

3. Hawaiian Ocean View, Hawaii
> Avg. commute time (minutes): 65.6
> Share of commuters driving alone: 52.0% — 131st lowest of 8,238 towns
> Share of commuters carpooling: 39.2% — 7th highest of 8,238 towns
> Share of commuters using public transit: 0.0% reported — the lowest of 8,238 towns (tied)
2. Mountain House, California
> Avg. commute time (minutes): 66.4
> Share of commuters driving alone: 64.1% — 514th lowest of 8,238 towns
> Share of commuters carpooling: 16.4% — 579th highest of 8,238 towns
> Share of commuters using public transit: 6.1% — 862nd highest of 8,238 towns
[in-text-ad-2]
1. Pine Ridge, Pennsylvania
> Avg. commute time (minutes): 67.3
> Share of commuters driving alone: 72.8% — 1,627th lowest of 8,238 towns
> Share of commuters carpooling: 16.5% — 565th highest of 8,238 towns
> Share of commuters using public transit: 8.7% — 565th highest of 8,238 towns (tied)
Methodology
To determine the towns with the longest commutes, 24/7 Wall St. reviewed five-year estimates of average commute times from the U.S. Census Bureau’s 2020 American Community Survey.
We used census “place” geographies — a category that includes incorporated legal entities and census-designated statistical entities. We defined towns based on population thresholds — having at least 1,000 people and less than 25,000 people.
Towns were excluded if average commute time estimates were not available in the 2020 ACS, if there were fewer than 1,000 workers 16 years and over who did not work from home, or if the sampling error associated with a town’s data was deemed too high.
The sampling error was defined as too high if the coefficient of variation — a statistical assessment of how reliable an estimate is — for a town’s average commute time was above 15% and greater than two standard deviations above the mean CV for all towns’ average commute times. We similarly excluded towns that had a sampling error too high for their population, using the same definition.
Towns were ranked based on their average commute time. To break ties, we used the share of workers with a commute of 45 minutes or longer.
Additional information on the share of commuters driving alone, carpooling, and using public transit are also five-year estimates from the 2020 ACS.
Contact [email protected] for any questions or corrections.