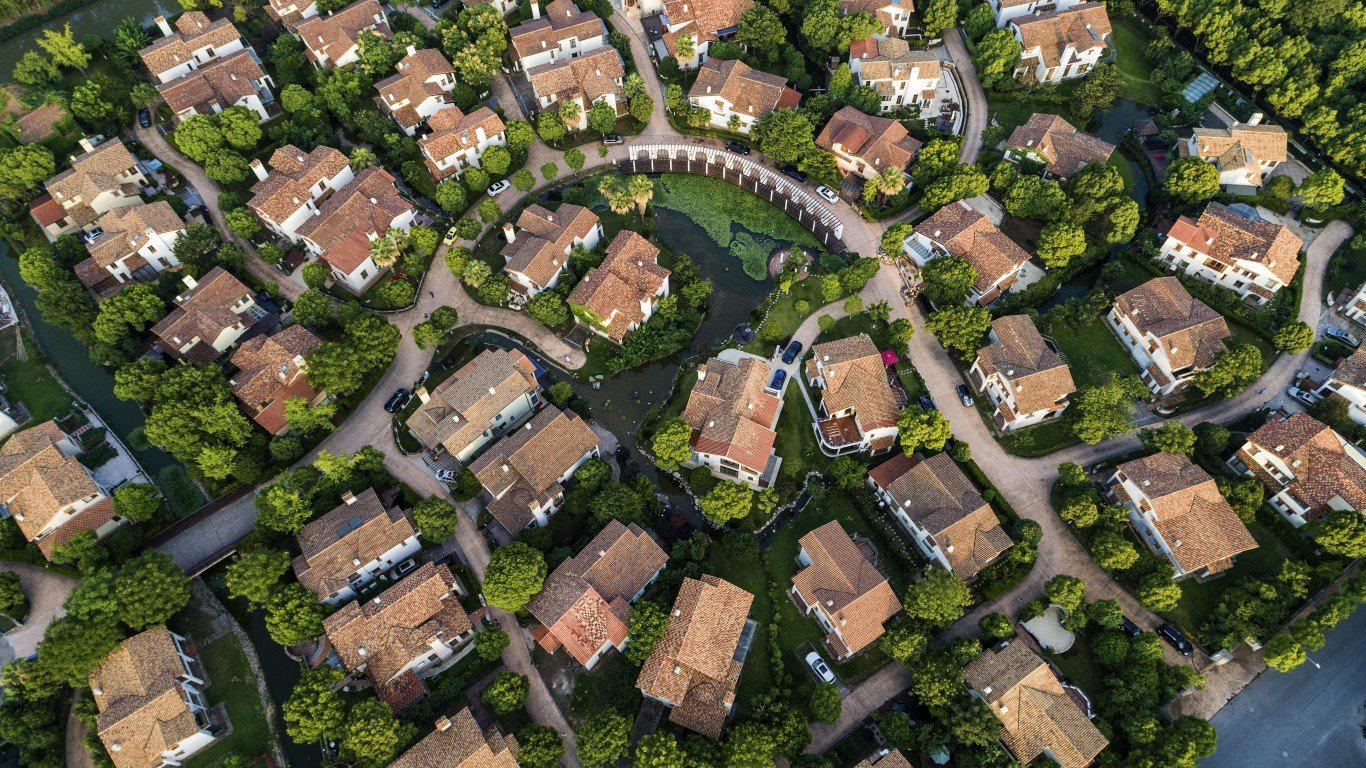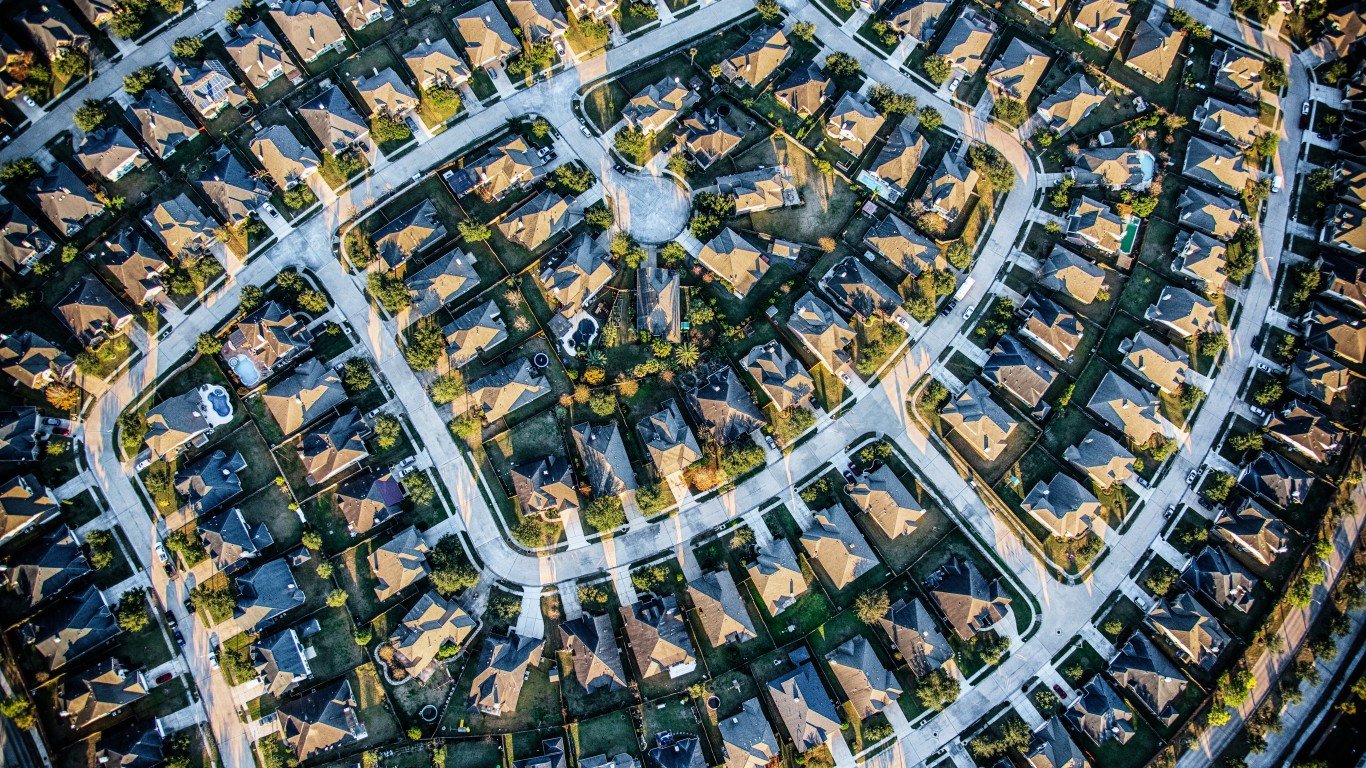
U.S. home sales skyrocketed during the COVID-19 pandemic – hitting a 15-year high of 6.1 million in 2021. The spike in demand, coupled with declining inventory, have put upward pressure on housing prices. Renters have not been spared, as housing has become one of the key drivers of surging U.S. inflation.
According to the Economic Policy Institute, a nonprofit think tank, a family of four – two adults and two children – can expect to pay an estimated $15,031 on housing in 2022. This amount varies across the country, however, from state to state and city to city.
Using data from the EPI’s Family Budget Calculator, 24/7 Wall St. identified the metro area in each state where families pay the least for housing. Metro areas are ranked on 2022 estimates of housing and utility costs for a modest two-bedroom rental.
It is important to note that four states – Delaware, New Hampshire, Rhode Island, and Vermont – each have only one metro area. As a result, the metro area in these places ranks as having the lowest housing costs by default only.
Among the metro areas on this list, housing costs for a family of four range from about $8,100 to nearly $21,300. In all but seven metro areas on this list, housing costs are lower than they are across the state as a whole – and in most cases, by $1,500 or more. Here is a look at the cities where the middle class can no longer afford housing. Lower housing costs in these places are often a reflection of what residents can afford. Most metro areas on this list have a lower median family income than the comparable statewide median. Here is a look at the income needed to be middle class in each state.
Click here to see the city with the lowest housing costs in every state
Click here to read our detailed methodology

Alabama: Dothan
> Est. annual housing costs: $8,472 (Alabama: $9,784)
> Median family income: $61,627 (Alabama: $66,772)
> Homeownership rate: 69.7% (Alabama: 69.2%)
> Median home value: $131,600 (Alabama: $149,600)
> No. of metros considered in ranking: 12
[in-text-ad]

Alaska: Anchorage
> Est. annual housing costs: $14,640 (Alaska: $14,566)
> Median family income: $98,403 (Alaska: $92,648)
> Homeownership rate: 65.6% (Alaska: 64.8%)
> Median home value: $301,100 (Alaska: $275,600)
> No. of metros considered in ranking: 2
[recirclink id=1052847]

Arizona: Sierra Vista-Douglas
> Est. annual housing costs: $10,488 (Arizona: $13,875)
> Median family income: $64,128 (Arizona: $73,456)
> Homeownership rate: 69.1% (Arizona: 65.3%)
> Median home value: $150,100 (Arizona: $242,000)
> No. of metros considered in ranking: 7

Arkansas: Fort Smith
> Est. annual housing costs: $8,736 (Arkansas: $8,993)
> Median family income: $56,536 (Arkansas: $62,067)
> Homeownership rate: 66.2% (Arkansas: 65.8%)
> Median home value: $119,500 (Arkansas: $133,600)
> No. of metros considered in ranking: 6
[in-text-ad-2]

California: Visalia
> Est. annual housing costs: $11,508 (California: $23,734)
> Median family income: $55,395 (California: $89,798)
> Homeownership rate: 57.1% (California: 55.3%)
> Median home value: $223,600 (California: $538,500)
> No. of metros considered in ranking: 26

Colorado: Pueblo
> Est. annual housing costs: $10,032 (Colorado: $17,157)
> Median family income: $62,959 (Colorado: $92,752)
> Homeownership rate: 65.1% (Colorado: 66.2%)
> Median home value: $172,500 (Colorado: $369,900)
> No. of metros considered in ranking: 7
[in-text-ad]

Connecticut: Norwich-New London
> Est. annual housing costs: $14,724 (Connecticut: $17,127)
> Median family income: $94,894 (Connecticut: $102,061)
> Homeownership rate: 67.1% (Connecticut: 66.1%)
> Median home value: $246,800 (Connecticut: $279,700)
> No. of metros considered in ranking: 4
[recirclink id=1065785]

Delaware: Dover
> Est. annual housing costs: $12,792 (Delaware: $14,037)
> Median family income: $70,383 (Delaware: $84,825)
> Homeownership rate: 68.8% (Delaware: 71.4%)
> Median home value: $226,600 (Delaware: $258,300)
> No. of metros considered in ranking: 1
*Because Dover is the only eligible metro in Delaware, it is the metro with the lowest highest housing costs by default.

Florida: Sebring-Avon Park
> Est. annual housing costs: $10,452 (Florida: $15,232)
> Median family income: $52,793 (Florida: $69,670)
> Homeownership rate: 77.0% (Florida: 66.2%)
> Median home value: $120,500 (Florida: $232,000)
> No. of metros considered in ranking: 22
[in-text-ad-2]

Georgia: Dalton
> Est. annual housing costs: $9,036 (Georgia: $12,152)
> Median family income: $58,145 (Georgia: $74,127)
> Homeownership rate: 67.2% (Georgia: 64.0%)
> Median home value: $136,800 (Georgia: $190,200)
> No. of metros considered in ranking: 14

Hawaii: Kahului-Wailuku-Lahaina
> Est. annual housing costs: $21,264 (Hawaii: $23,335)
> Median family income: $92,627 (Hawaii: $97,813)
> Homeownership rate: 62.5% (Hawaii: 60.3%)
> Median home value: $657,400 (Hawaii: $636,400)
> No. of metros considered in ranking: 2
[in-text-ad]

Idaho: Pocatello
> Est. annual housing costs: $9,384 (Idaho: $10,791)
> Median family income: $66,208 (Idaho: $70,885)
> Homeownership rate: 68.3% (Idaho: 70.8%)
> Median home value: $165,800 (Idaho: $235,600)
> No. of metros considered in ranking: 5
[recirclink id=1069876]

Illinois: Decatur
> Est. annual housing costs: $9,264 (Illinois: $13,692)
> Median family income: $71,270 (Illinois: $86,251)
> Homeownership rate: 69.1% (Illinois: 66.3%)
> Median home value: $103,100 (Illinois: $202,100)
> No. of metros considered in ranking: 9

Indiana: Kokomo
> Est. annual housing costs: $8,784 (Indiana: $10,331)
> Median family income: $69,896 (Indiana: $73,265)
> Homeownership rate: 72.1% (Indiana: 69.5%)
> Median home value: $113,900 (Indiana: $148,900)
> No. of metros considered in ranking: 12
[in-text-ad-2]

Iowa: Davenport-Moline-Rock Island
> Est. annual housing costs: $9,408 (Iowa: $9,802)
> Median family income: $76,902 (Iowa: $79,186)
> Homeownership rate: 70.7% (Iowa: 71.2%)
> Median home value: $141,600 (Iowa: $153,900)
> No. of metros considered in ranking: 8

Kansas: Topeka
> Est. annual housing costs: $9,612 (Kansas: $10,740)
> Median family income: $75,758 (Kansas: $77,620)
> Homeownership rate: 69.4% (Kansas: 66.2%)
> Median home value: $137,900 (Kansas: $157,600)
> No. of metros considered in ranking: 4
[in-text-ad]

Kentucky: Owensboro
> Est. annual housing costs: $9,852 (Kentucky: $9,687)
> Median family income: $68,358 (Kentucky: $65,893)
> Homeownership rate: 68.5% (Kentucky: 67.6%)
> Median home value: $139,300 (Kentucky: $147,100)
> No. of metros considered in ranking: 5
[recirclink id=1076225]

Louisiana: Monroe
> Est. annual housing costs: $9,648 (Louisiana: $11,046)
> Median family income: $56,295 (Louisiana: $65,427)
> Homeownership rate: 63.2% (Louisiana: 66.6%)
> Median home value: $134,500 (Louisiana: $168,100)
> No. of metros considered in ranking: 9

Maine: Lewiston-Auburn
> Est. annual housing costs: $11,364 (Maine: $13,104)
> Median family income: $70,817 (Maine: $76,192)
> Homeownership rate: 64.9% (Maine: 72.9%)
> Median home value: $166,600 (Maine: $198,000)
> No. of metros considered in ranking: 3
[in-text-ad-2]

Maryland: Cumberland
> Est. annual housing costs: $8,808 (Maryland: $17,840)
> Median family income: $63,095 (Maryland: $105,790)
> Homeownership rate: 71.7% (Maryland: 67.1%)
> Median home value: $131,300 (Maryland: $325,400)
> No. of metros considered in ranking: 5

Massachusetts: Springfield
> Est. annual housing costs: $13,548 (Massachusetts: $22,294)
> Median family income: $79,907 (Massachusetts: $106,526)
> Homeownership rate: 63.9% (Massachusetts: 62.5%)
> Median home value: $236,200 (Massachusetts: $398,800)
> No. of metros considered in ranking: 5
[in-text-ad]

Michigan: Bay City
> Est. annual housing costs: $9,312 (Michigan: $11,467)
> Median family income: $62,204 (Michigan: $75,470)
> Homeownership rate: 76.1% (Michigan: 71.7%)
> Median home value: $106,400 (Michigan: $162,600)
> No. of metros considered in ranking: 14
[recirclink id=1076750]

Minnesota: St. Cloud
> Est. annual housing costs: $9,852 (Minnesota: $13,486)
> Median family income: $80,403 (Minnesota: $92,692)
> Homeownership rate: 68.4% (Minnesota: 71.9%)
> Median home value: $192,100 (Minnesota: $235,700)
> No. of metros considered in ranking: 5

Mississippi: Gulfport-Biloxi
> Est. annual housing costs: $9,720 (Mississippi: $9,546)
> Median family income: $62,967 (Mississippi: $58,923)
> Homeownership rate: 66.0% (Mississippi: 68.8%)
> Median home value: $153,600 (Mississippi: $125,500)
> No. of metros considered in ranking: 3
[in-text-ad-2]

Missouri: Jefferson City
> Est. annual housing costs: $8,136 (Missouri: $10,344)
> Median family income: $75,505 (Missouri: $72,834)
> Homeownership rate: 71.7% (Missouri: 67.1%)
> Median home value: $162,100 (Missouri: $163,600)
> No. of metros considered in ranking: 8

Montana: Great Falls
> Est. annual housing costs: $9,696 (Montana: $10,972)
> Median family income: $67,789 (Montana: $72,773)
> Homeownership rate: 66.6% (Montana: 68.5%)
> Median home value: $184,400 (Montana: $244,900)
> No. of metros considered in ranking: 3
[in-text-ad]

Nebraska: Lincoln
> Est. annual housing costs: $10,512 (Nebraska: $10,551)
> Median family income: $82,381 (Nebraska: $80,125)
> Homeownership rate: 59.8% (Nebraska: 66.2%)
> Median home value: $188,700 (Nebraska: $164,000)
> No. of metros considered in ranking: 2
[recirclink id=1052847]

Nevada: Carson City
> Est. annual housing costs: $12,276 (Nevada: $13,543)
> Median family income: $69,727 (Nevada: $74,077)
> Homeownership rate: 58.2% (Nevada: 57.1%)
> Median home value: $299,900 (Nevada: $290,200)
> No. of metros considered in ranking: 3

New Hampshire: Manchester-Nashua
> Est. annual housing costs: $15,768 (New Hampshire: $15,267)
> Median family income: $103,238 (New Hampshire: $97,001)
> Homeownership rate: 65.7% (New Hampshire: 71.2%)
> Median home value: $287,900 (New Hampshire: $272,300)
> No. of metros considered in ranking: 1
*Because Manchester-Nashua is the only eligible metro in New Hampshire, it is the metro with the lowest highest housing costs by default.
[in-text-ad-2]

New Jersey: Vineland-Bridgeton
> Est. annual housing costs: $16,236 (New Jersey: $19,811)
> Median family income: $67,467 (New Jersey: $104,804)
> Homeownership rate: 66.3% (New Jersey: 64.0%)
> Median home value: $166,400 (New Jersey: $343,500)
> No. of metros considered in ranking: 4

New Mexico: Las Cruces
> Est. annual housing costs: $8,808 (New Mexico: $10,784)
> Median family income: $51,928 (New Mexico: $62,611)
> Homeownership rate: 64.6% (New Mexico: 68.0%)
> Median home value: $153,600 (New Mexico: $175,700)
> No. of metros considered in ranking: 4
[in-text-ad]

New York: Utica-Rome
> Est. annual housing costs: $9,552 (New York: $20,092)
> Median family income: $75,037 (New York: $87,270)
> Homeownership rate: 69.9% (New York: 54.1%)
> Median home value: $127,000 (New York: $325,000)
> No. of metros considered in ranking: 13
[recirclink id=1065785]

North Carolina: Hickory-Lenoir-Morganton
> Est. annual housing costs: $8,316 (North Carolina: $11,360)
> Median family income: $60,878 (North Carolina: $70,978)
> Homeownership rate: 73.4% (North Carolina: 65.7%)
> Median home value: $139,100 (North Carolina: $182,100)
> No. of metros considered in ranking: 14

North Dakota: Fargo
> Est. annual housing costs: $10,476 (North Dakota: $10,236)
> Median family income: $90,450 (North Dakota: $86,798)
> Homeownership rate: 55.9% (North Dakota: 62.5%)
> Median home value: $225,600 (North Dakota: $199,900)
> No. of metros considered in ranking: 3
[in-text-ad-2]

Ohio: Mansfield
> Est. annual housing costs: $8,808 (Ohio: $10,324)
> Median family income: $63,284 (Ohio: $74,391)
> Homeownership rate: 66.9% (Ohio: 66.3%)
> Median home value: $115,100 (Ohio: $151,400)
> No. of metros considered in ranking: 11

Oklahoma: Lawton
> Est. annual housing costs: $9,072 (Oklahoma: $10,059)
> Median family income: $65,335 (Oklahoma: $67,511)
> Homeownership rate: 54.4% (Oklahoma: 66.1%)
> Median home value: $121,500 (Oklahoma: $142,400)
> No. of metros considered in ranking: 4
[in-text-ad]

Oregon: Medford
> Est. annual housing costs: $12,468 (Oregon: $15,607)
> Median family income: $70,436 (Oregon: $80,630)
> Homeownership rate: 64.3% (Oregon: 62.8%)
> Median home value: $294,500 (Oregon: $336,700)
> No. of metros considered in ranking: 8
[recirclink id=1069876]

Pennsylvania: Johnstown
> Est. annual housing costs: $8,688 (Pennsylvania: $12,412)
> Median family income: $65,560 (Pennsylvania: $80,996)
> Homeownership rate: 74.7% (Pennsylvania: 69.0%)
> Median home value: $94,900 (Pennsylvania: $187,500)
> No. of metros considered in ranking: 17

Rhode Island: Providence-Warwick
> Est. annual housing costs: $13,776 (Rhode Island: $14,502)
> Median family income: $89,555 (Rhode Island: $89,330)
> Homeownership rate: 62.0% (Rhode Island: 61.6%)
> Median home value: $290,500 (Rhode Island: $276,600)
> No. of metros considered in ranking: 1
*Because Providence-Warwick is the only eligible metro in Rhode Island, it is the metro with the lowest highest housing costs by default.
[in-text-ad-2]

South Carolina: Florence
> Est. annual housing costs: $9,708 (South Carolina: $11,096)
> Median family income: $58,215 (South Carolina: $68,813)
> Homeownership rate: 67.0% (South Carolina: 70.1%)
> Median home value: $125,100 (South Carolina: $170,100)
> No. of metros considered in ranking: 7

South Dakota: Sioux Falls
> Est. annual housing costs: $10,488 (South Dakota: $9,670)
> Median family income: $84,874 (South Dakota: $77,042)
> Homeownership rate: 66.2% (South Dakota: 68.0%)
> Median home value: $208,400 (South Dakota: $174,600)
> No. of metros considered in ranking: 2
[in-text-ad]

Tennessee: Kingsport-Bristol
> Est. annual housing costs: $8,412 (Tennessee: $10,906)
> Median family income: $60,792 (Tennessee: $68,793)
> Homeownership rate: 73.5% (Tennessee: 66.5%)
> Median home value: $140,800 (Tennessee: $177,600)
> No. of metros considered in ranking: 10
[recirclink id=1076225]

Texas: McAllen-Edinburg-Mission
> Est. annual housing costs: $8,868 (Texas: $13,475)
> Median family income: $46,609 (Texas: $76,073)
> Homeownership rate: 68.0% (Texas: 62.3%)
> Median home value: $90,000 (Texas: $187,200)
> No. of metros considered in ranking: 25

Utah: Logan
> Est. annual housing costs: $9,384 (Utah: $12,508)
> Median family income: $69,237 (Utah: $84,590)
> Homeownership rate: 64.7% (Utah: 70.5%)
> Median home value: $252,800 (Utah: $305,400)
> No. of metros considered in ranking: 5
[in-text-ad-2]

Vermont: Burlington-South Burlington
> Est. annual housing costs: $19,536 (Vermont: $14,321)
> Median family income: $95,011 (Vermont: $83,023)
> Homeownership rate: 66.8% (Vermont: 71.3%)
> Median home value: $285,200 (Vermont: $230,900)
> No. of metros considered in ranking: 1
*Because Burlington-South Burlington is the only eligible metro in Vermont, it is the metro with the lowest highest housing costs by default.

Virginia: Lynchburg
> Est. annual housing costs: $9,408 (Virginia: $15,870)
> Median family income: $70,981 (Virginia: $93,284)
> Homeownership rate: 70.8% (Virginia: 66.7%)
> Median home value: $173,900 (Virginia: $282,800)
> No. of metros considered in ranking: 9
[in-text-ad]

Washington: Spokane-Spokane Valley
> Est. annual housing costs: $12,084 (Washington: $17,824)
> Median family income: $76,280 (Washington: $92,422)
> Homeownership rate: 64.4% (Washington: 63.3%)
> Median home value: $243,000 (Washington: $366,800)
> No. of metros considered in ranking: 10
[recirclink id=1076750]

West Virginia: Weirton-Steubenville
> Est. annual housing costs: $8,808 (West Virginia: $9,133)
> Median family income: $61,496 (West Virginia: $61,707)
> Homeownership rate: 71.0% (West Virginia: 73.7%)
> Median home value: $95,400 (West Virginia: $123,200)
> No. of metros considered in ranking: 6

Wisconsin: Oshkosh-Neenah
> Est. annual housing costs: $9,108 (Wisconsin: $10,970)
> Median family income: $79,200 (Wisconsin: $80,844)
> Homeownership rate: 65.7% (Wisconsin: 67.1%)
> Median home value: $158,400 (Wisconsin: $189,200)
> No. of metros considered in ranking: 12
[in-text-ad-2]

Wyoming: Casper
> Est. annual housing costs: $10,416 (Wyoming: $10,423)
> Median family income: $78,926 (Wyoming: $81,290)
> Homeownership rate: 70.6% (Wyoming: 71.0%)
> Median home value: $215,400 (Wyoming: $228,000)
> No. of metros considered in ranking: 2
Methodology
To determine the metro areas where families pay the least for housing in every state, 24/7 Wall St. reviewed data from the Economic Policy Institute’s 2022 Family Budget Calculator. Metros were ranked based on the EPI’s annual housing cost estimates. Ties were broken with five-year estimates of median gross rent from the U.S. Census Bureau’s 2020 American Community Survey.
In the Family Budget Calculator, the EPI estimates the housing costs for families to maintain a modest yet adequate standard of living. The budgets are created for 10 family types for U.S. counties and metro areas. A family of four is defined by the EPI as a married couple living with their two children, and the two children are assumed to be a 4-year-old and an 8-year-old.
State-level housing cost estimates are aggregated from the county level using five-year estimates of total households from the U.S. Census Bureau’s 2020 American Community Survey.
We used the 384 metropolitan statistical areas as delineated by the United States Office of Management and Budget and used by the Census Bureau as our definition of metros.
Additional information on median family income, homeownership rate, and median home value are from the U.S. Census Bureau’s 2020 American Community Survey. Because the Census Bureau didn’t release one-year estimates for 2020 due to data collection issues caused by the COVID-19 pandemic, all ACS data are five-year estimates.
Contact [email protected] for any questions or corrections.