The share of Americans working from home skyrocketed during the pandemic. A recent Gallup study found that 45% of full-time workers in the United States – and two-thirds of white-collar workers – were doing their job remotely at least some of the time.
The shift is proving to be a positive development for millions of Americans. Gallup reports that over 90% of remote workers hope that the trend continues after the pandemic, citing the lack of commute time as the chief benefit. (Here is a look at the state where the most people are working from home.)
According to the U.S. Census Bureau, the average commute time in the United States is 26.9 minutes. For those who travel to and from work every Monday through Friday, this translates to about 4.5 hours per week, or nearly 10 days a year.
Of course, commute times vary from person to person, but in some parts of the country, workers are far more likely to have longer commutes than in others. Using census data, 24/7 Wall St. identified the city – defined as a place with at least 25,000 residents – with the longest commute in every state.
Among the cities on this list, average commute times range from about 17 minutes up to 48 minutes. Over the course of a week, these commute times add up, from nearly three hours to eight hours – and from six days to over two weeks over the course of a year. In most cities on this list, commuters spend a day and a half or more commuting per year than the typical commuter across the state as a whole.
In many of the cities on this list, the share of commuters using public transit exceeds the comparable statewide average. In most cases, public transportation is less direct than simply driving from door to door, adding to overall commute time. In most of these cities, however, commuters are more likely to drive to work alone than commuters statewide, suggesting that long commutes are the result of traffic congestion or greater distance to the workplace. Here is a look at the cities where people lose the most time driving each year.
Click here to see the city with the longest commute in every state
Click here to read our detailed methodology
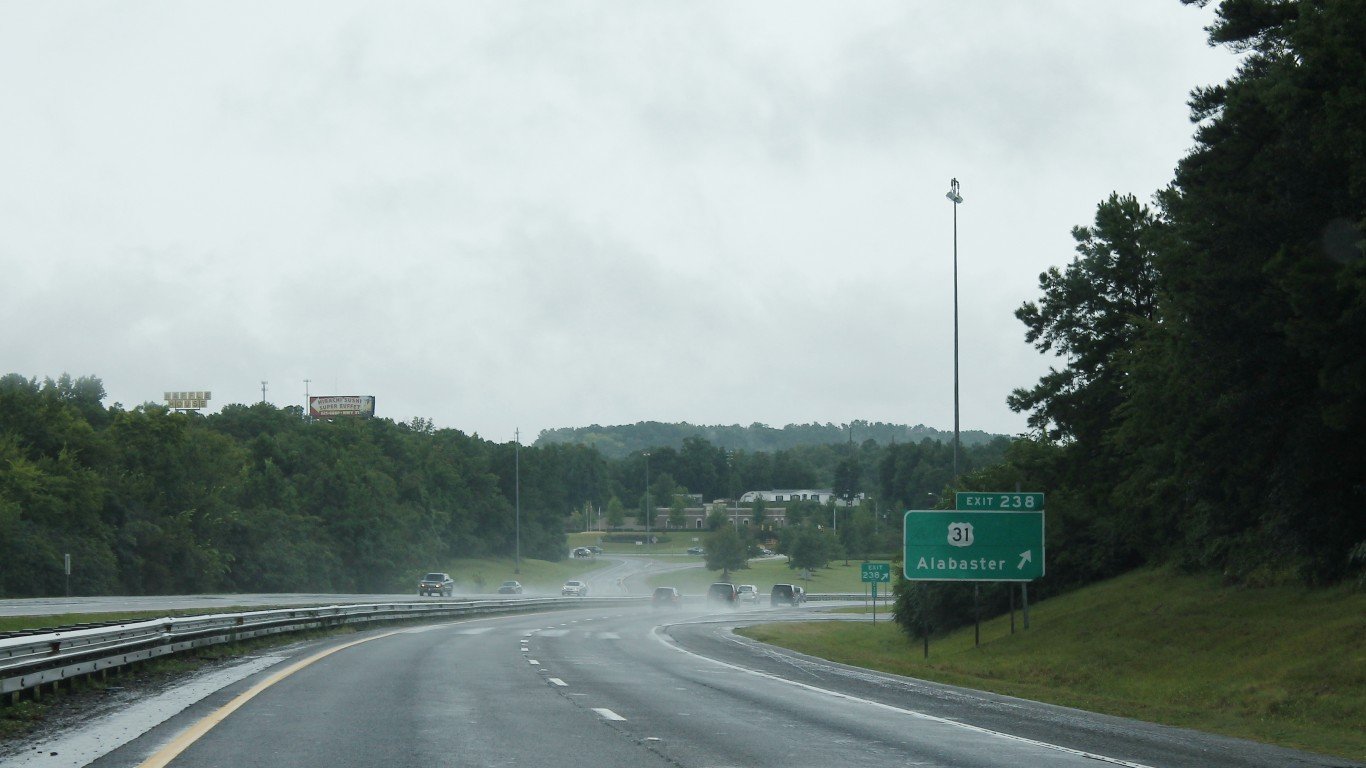
Alabama: Alabaster
> Avg. commute time (minutes): 31.6 (Alabama: 25.2)
> Share of commuters driving alone: 83.1% (Alabama: 84.9%)
> Share of commuters carpooling: 8.4% (Alabama: 8.3%)
> Share of commuters using public transit: 0.0% reported (Alabama: 0.3%)
> No. of cities considered in ranking: 23
[in-text-ad]
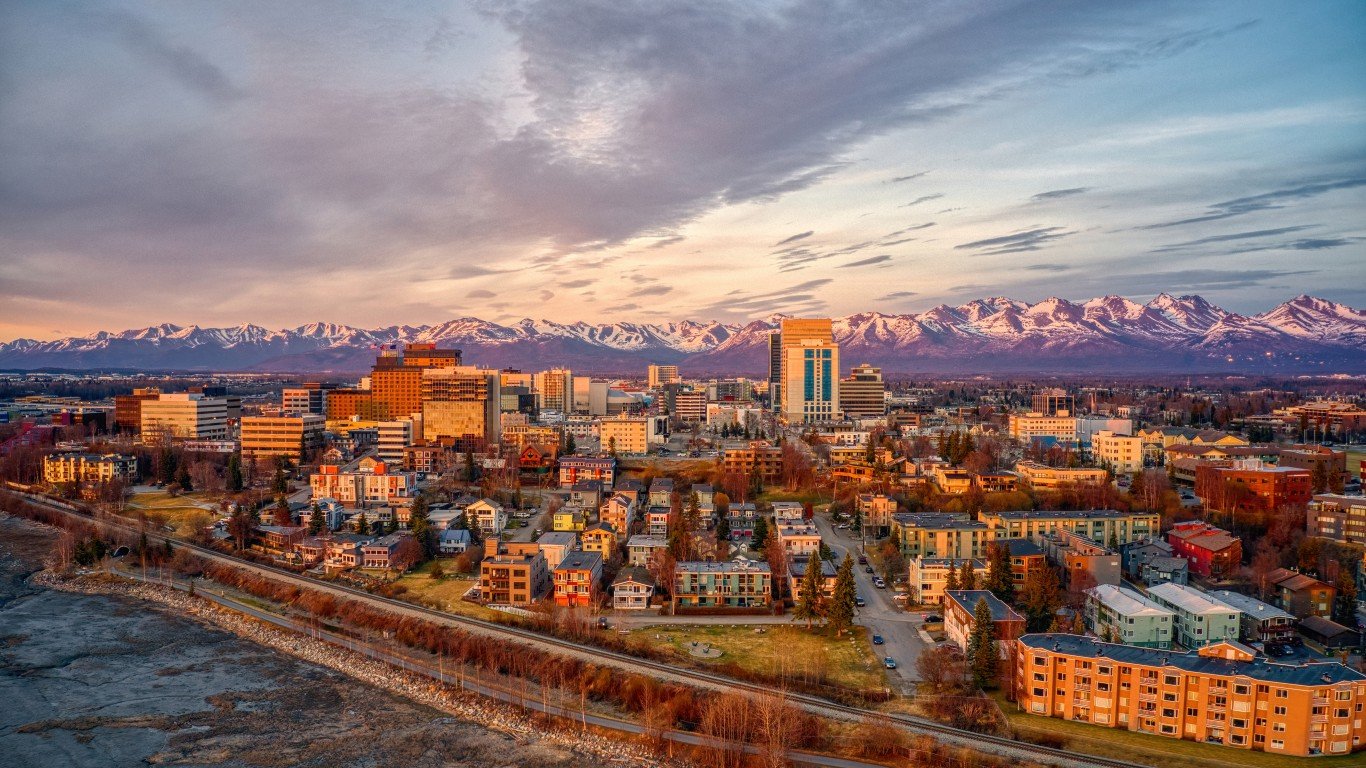
Alaska: Anchorage
> Avg. commute time (minutes): 18.6 (Alaska: 18.9)
> Share of commuters driving alone: 75.0% (Alaska: 68.1%)
> Share of commuters carpooling: 12.4% (Alaska: 12.1%)
> Share of commuters using public transit: 1.5% (Alaska: 1.2%)
> No. of cities considered in ranking: 3
[recirclink id=987778]

Arizona: Maricopa
> Avg. commute time (minutes): 38.1 (Arizona: 25.8)
> Share of commuters driving alone: 74.5% (Arizona: 74.5%)
> Share of commuters carpooling: 12.1% (Arizona: 10.7%)
> Share of commuters using public transit: 0.5% (Arizona: 1.6%)
> No. of cities considered in ranking: 39
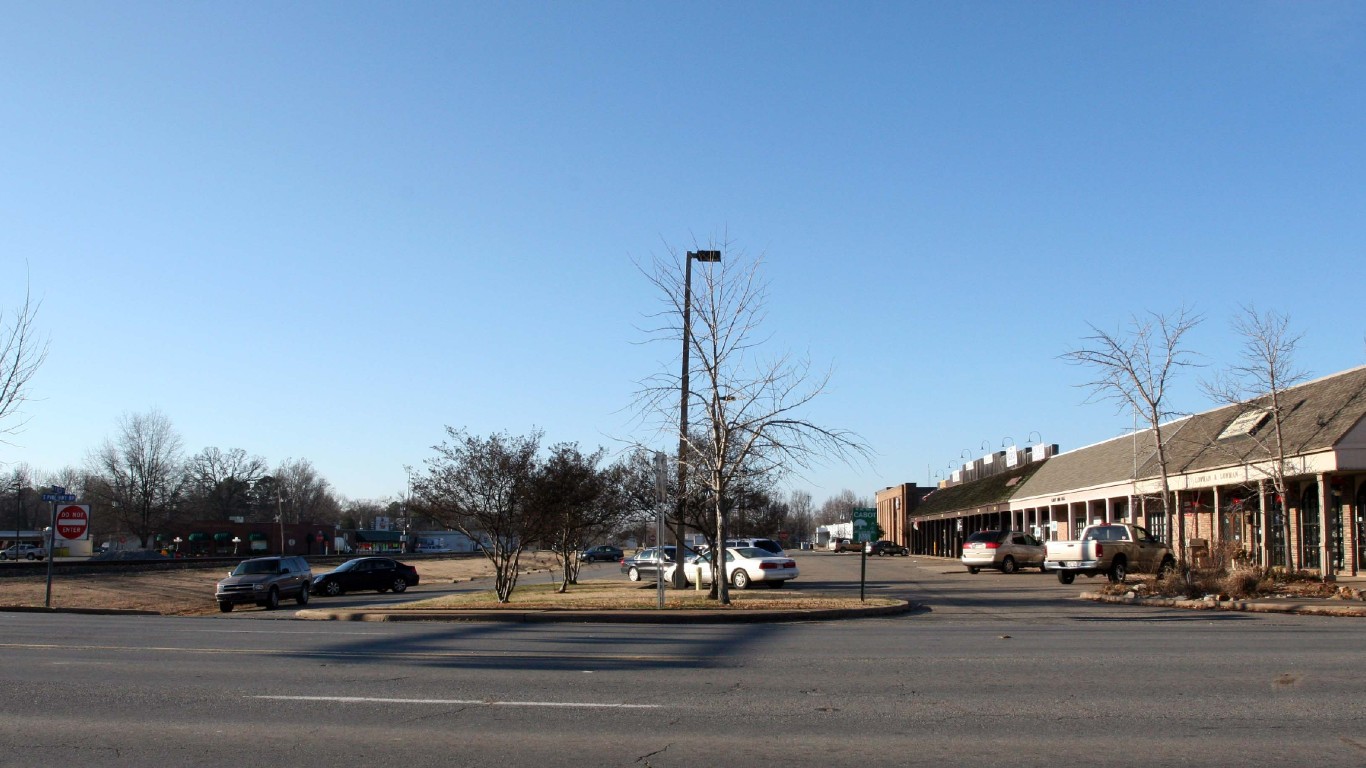
Arkansas: Cabot
> Avg. commute time (minutes): 28.5 (Arkansas: 21.8)
> Share of commuters driving alone: 85.8% (Arkansas: 82.3%)
> Share of commuters carpooling: 7.5% (Arkansas: 10.2%)
> Share of commuters using public transit: 0.4% (Arkansas: 0.3%)
> No. of cities considered in ranking: 19
[in-text-ad-2]

California: Temescal Valley
> Avg. commute time (minutes): 47.7 (California: 29.8)
> Share of commuters driving alone: 79.2% (California: 72.1%)
> Share of commuters carpooling: 8.9% (California: 10.0%)
> Share of commuters using public transit: 0.6% (California: 4.6%)
> No. of cities considered in ranking: 302

Colorado: Brighton
> Avg. commute time (minutes): 32.0 (Colorado: 25.8)
> Share of commuters driving alone: 78.6% (Colorado: 72.9%)
> Share of commuters carpooling: 10.6% (Colorado: 8.6%)
> Share of commuters using public transit: 2.0% (Colorado: 2.8%)
> No. of cities considered in ranking: 33
[in-text-ad]
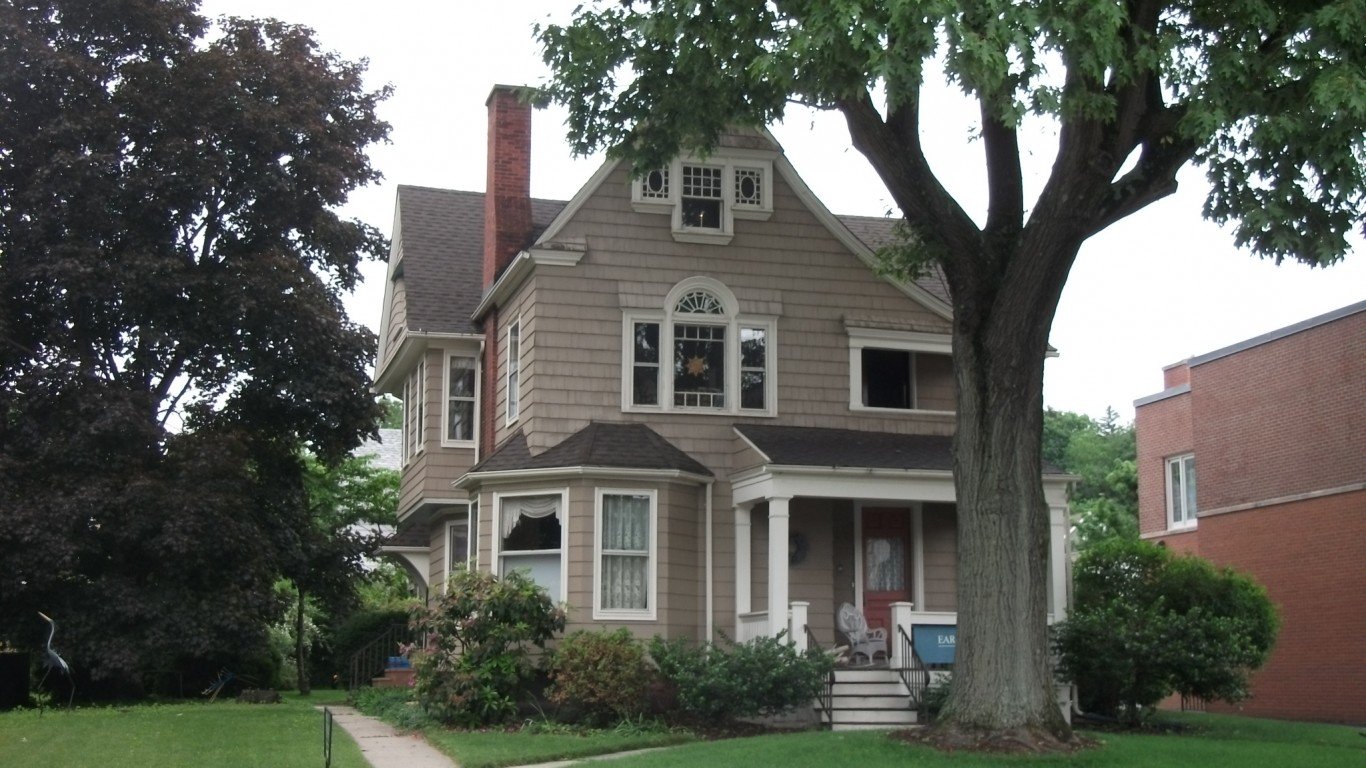
Connecticut: Naugatuck
> Avg. commute time (minutes): 30.5 (Connecticut: 26.7)
> Share of commuters driving alone: 80.0% (Connecticut: 76.3%)
> Share of commuters carpooling: 10.2% (Connecticut: 7.8%)
> Share of commuters using public transit: 1.0% (Connecticut: 4.4%)
> No. of cities considered in ranking: 24
[recirclink id=1044820]

Delaware: Wilmington
> Avg. commute time (minutes): 23.3 (Delaware: 26.2)
> Share of commuters driving alone: 62.9% (Delaware: 78.8%)
> Share of commuters carpooling: 9.2% (Delaware: 8.6%)
> Share of commuters using public transit: 11.1% (Delaware: 2.2%)
> No. of cities considered in ranking: 3

Florida: Poinciana
> Avg. commute time (minutes): 45.7 (Florida: 27.9)
> Share of commuters driving alone: 79.2% (Florida: 77.7%)
> Share of commuters carpooling: 15.2% (Florida: 9.2%)
> Share of commuters using public transit: 0.9% (Florida: 1.6%)
> No. of cities considered in ranking: 158
[in-text-ad-2]
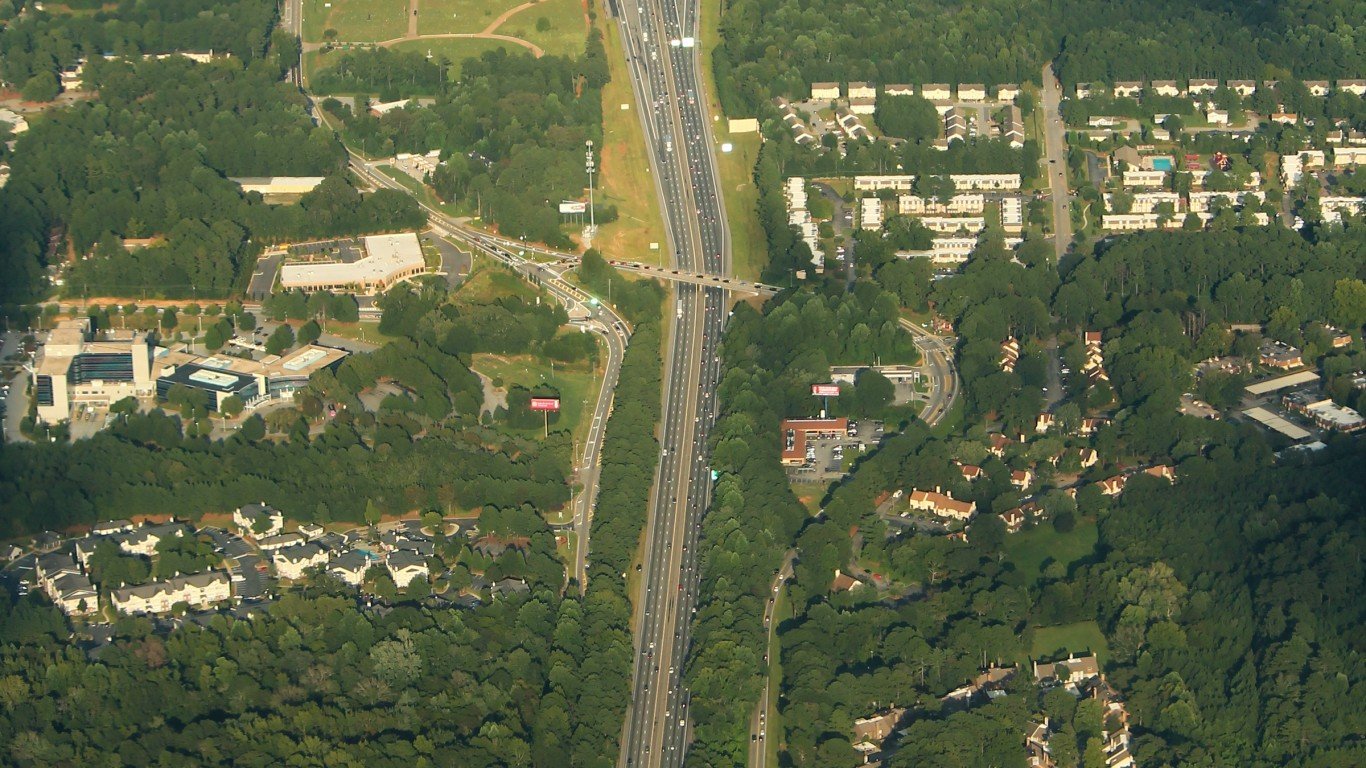
Georgia: Stonecrest
> Avg. commute time (minutes): 37.3 (Georgia: 28.7)
> Share of commuters driving alone: 72.6% (Georgia: 77.7%)
> Share of commuters carpooling: 12.9% (Georgia: 9.3%)
> Share of commuters using public transit: 4.9% (Georgia: 1.9%)
> No. of cities considered in ranking: 45

Hawaii: Ewa Gentry
> Avg. commute time (minutes): 37.8 (Hawaii: 27.1)
> Share of commuters driving alone: 73.8% (Hawaii: 67.6%)
> Share of commuters carpooling: 13.9% (Hawaii: 13.4%)
> Share of commuters using public transit: 7.2% (Hawaii: 5.5%)
> No. of cities considered in ranking: 10
[in-text-ad]

Idaho: Caldwell
> Avg. commute time (minutes): 25.8 (Idaho: 21.2)
> Share of commuters driving alone: 77.5% (Idaho: 77.8%)
> Share of commuters carpooling: 12.4% (Idaho: 9.3%)
> Share of commuters using public transit: 0.5% (Idaho: 0.6%)
> No. of cities considered in ranking: 13
[recirclink id=1054986]
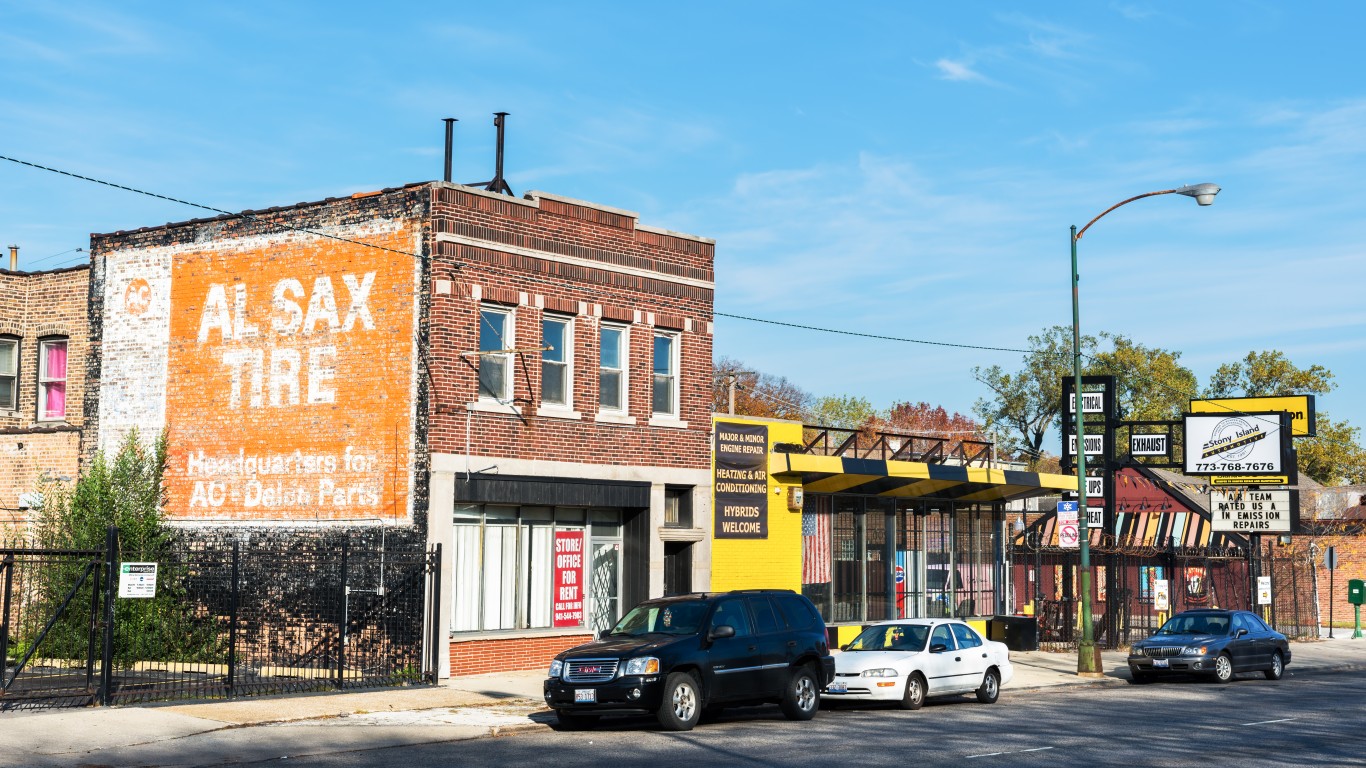
Illinois: Calumet City
> Avg. commute time (minutes): 36.6 (Illinois: 29.0)
> Share of commuters driving alone: 67.6% (Illinois: 71.5%)
> Share of commuters carpooling: 10.8% (Illinois: 7.8%)
> Share of commuters using public transit: 10.9% (Illinois: 8.8%)
> No. of cities considered in ranking: 91

Indiana: Schererville
> Avg. commute time (minutes): 31.4 (Indiana: 23.9)
> Share of commuters driving alone: 87.7% (Indiana: 81.3%)
> Share of commuters carpooling: 3.3% (Indiana: 9.0%)
> Share of commuters using public transit: 2.2% (Indiana: 0.9%)
> No. of cities considered in ranking: 40
[in-text-ad-2]

Iowa: Ankeny
> Avg. commute time (minutes): 21.6 (Iowa: 19.5)
> Share of commuters driving alone: 85.1% (Iowa: 80.2%)
> Share of commuters carpooling: 5.2% (Iowa: 8.0%)
> Share of commuters using public transit: 0.9% (Iowa: 0.9%)
> No. of cities considered in ranking: 18

Kansas: Olathe
> Avg. commute time (minutes): 21.9 (Kansas: 19.6)
> Share of commuters driving alone: 80.2% (Kansas: 80.7%)
> Share of commuters carpooling: 8.2% (Kansas: 8.9%)
> Share of commuters using public transit: 0.2% (Kansas: 0.4%)
> No. of cities considered in ranking: 15
[in-text-ad]
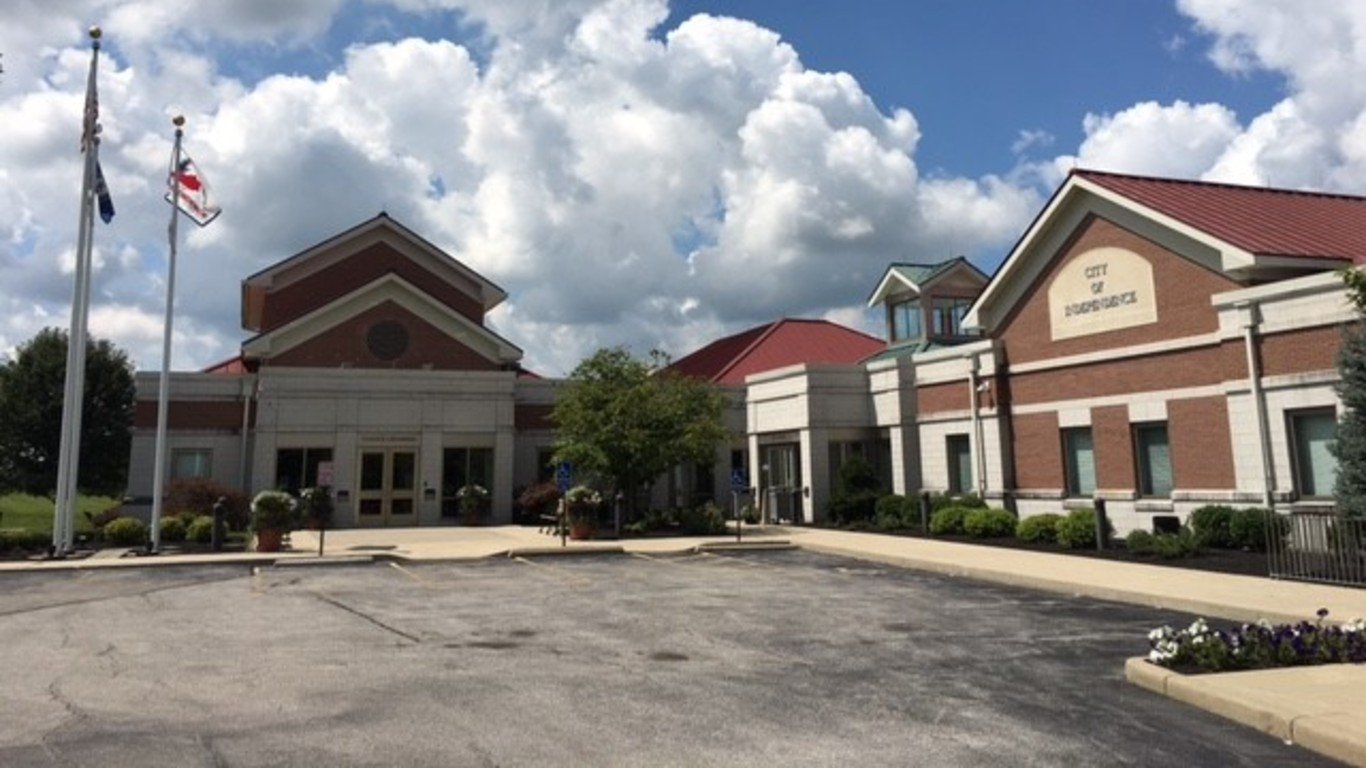
Kentucky: Independence
> Avg. commute time (minutes): 28.4 (Kentucky: 23.7)
> Share of commuters driving alone: 84.0% (Kentucky: 81.2%)
> Share of commuters carpooling: 9.6% (Kentucky: 9.2%)
> Share of commuters using public transit: 0.4% (Kentucky: 0.9%)
> No. of cities considered in ranking: 15
[recirclink id=1060122]
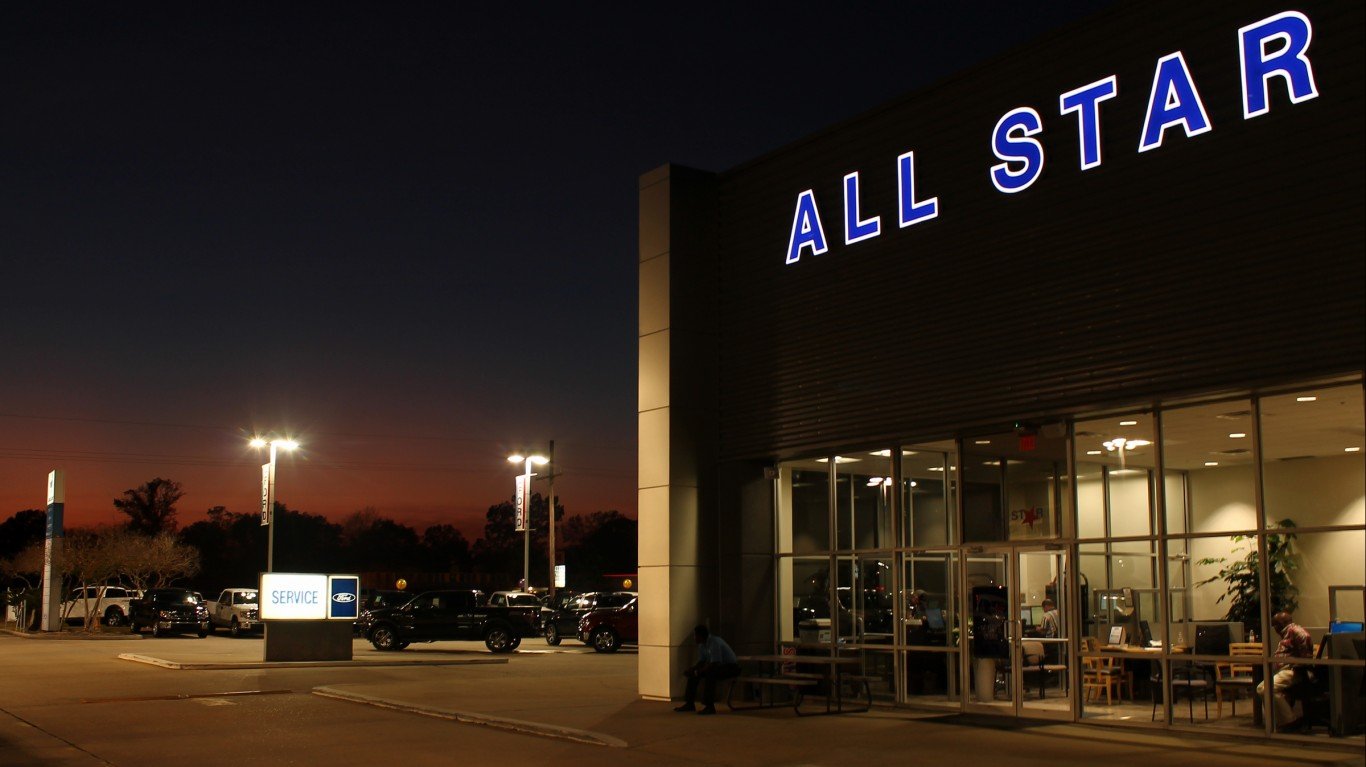
Louisiana: Prairieville
> Avg. commute time (minutes): 35.5 (Louisiana: 25.8)
> Share of commuters driving alone: 90.1% (Louisiana: 81.9%)
> Share of commuters carpooling: 3.9% (Louisiana: 9.0%)
> Share of commuters using public transit: 0.0% reported (Louisiana: 1.1%)
> No. of cities considered in ranking: 18
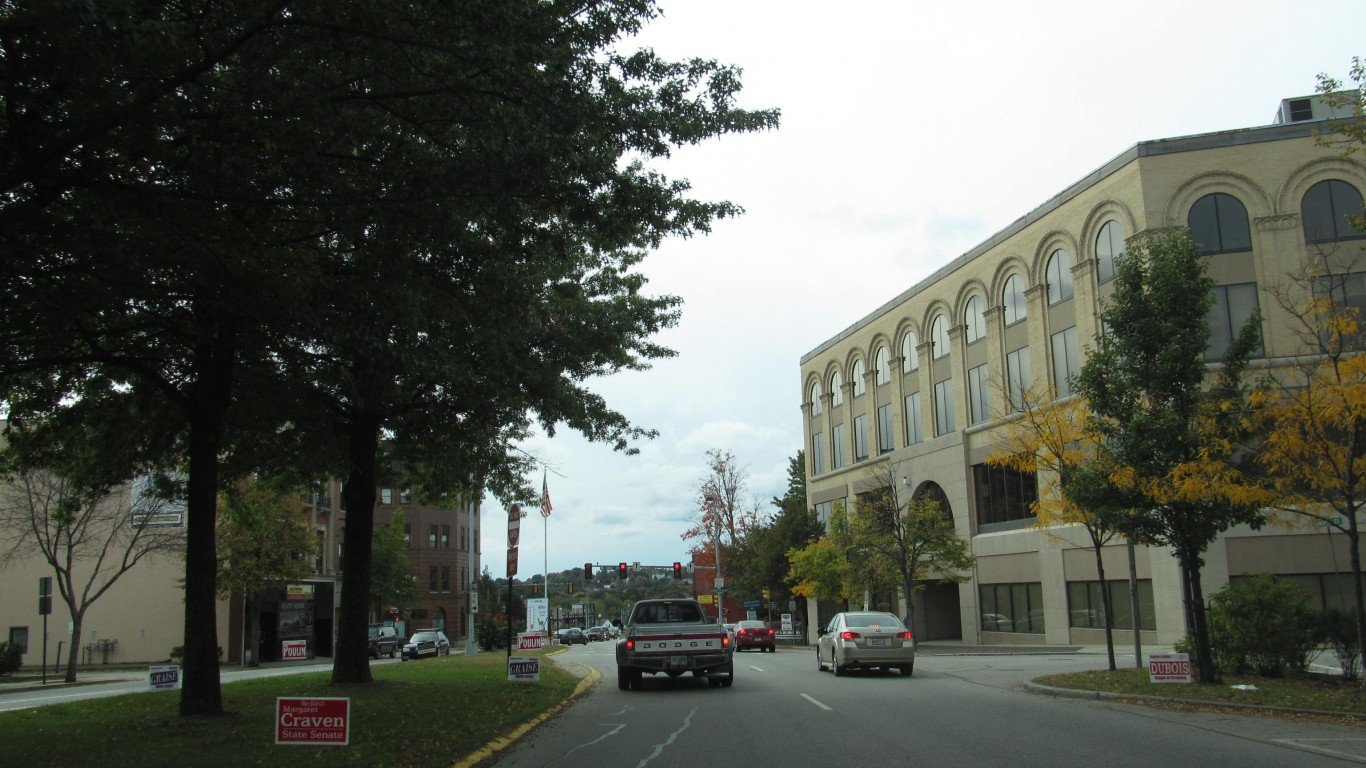
Maine: Lewiston
> Avg. commute time (minutes): 20.2 (Maine: 24.3)
> Share of commuters driving alone: 72.0% (Maine: 77.2%)
> Share of commuters carpooling: 14.2% (Maine: 9.2%)
> Share of commuters using public transit: 0.3% (Maine: 0.5%)
> No. of cities considered in ranking: 4
[in-text-ad-2]
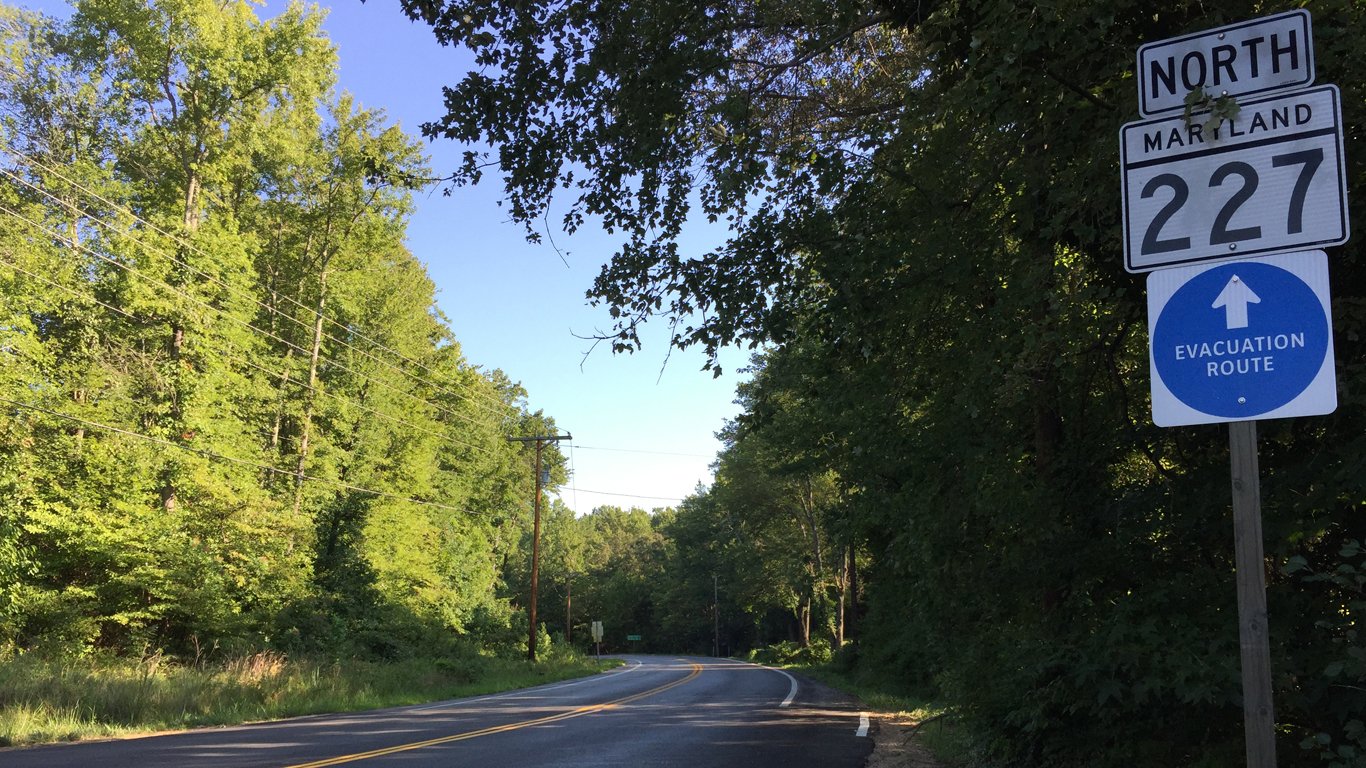
Maryland: Waldorf
> Avg. commute time (minutes): 46.1 (Maryland: 33.0)
> Share of commuters driving alone: 80.3% (Maryland: 72.1%)
> Share of commuters carpooling: 6.2% (Maryland: 8.6%)
> Share of commuters using public transit: 6.8% (Maryland: 7.4%)
> No. of cities considered in ranking: 54

Massachusetts: Randolph Town
> Avg. commute time (minutes): 38.0 (Massachusetts: 30.0)
> Share of commuters driving alone: 72.8% (Massachusetts: 68.0%)
> Share of commuters carpooling: 9.8% (Massachusetts: 7.3%)
> Share of commuters using public transit: 10.7% (Massachusetts: 9.5%)
> No. of cities considered in ranking: 64
[in-text-ad]

Michigan: Novi
> Avg. commute time (minutes): 26.9 (Michigan: 24.6)
> Share of commuters driving alone: 85.0% (Michigan: 80.7%)
> Share of commuters carpooling: 7.4% (Michigan: 8.6%)
> Share of commuters using public transit: 0.2% (Michigan: 1.3%)
> No. of cities considered in ranking: 45
[recirclink id=1024519]

Minnesota: Ramsey
> Avg. commute time (minutes): 29.4 (Minnesota: 23.8)
> Share of commuters driving alone: 83.2% (Minnesota: 76.0%)
> Share of commuters carpooling: 5.2% (Minnesota: 8.1%)
> Share of commuters using public transit: 1.7% (Minnesota: 3.2%)
> No. of cities considered in ranking: 42

Mississippi: Horn Lake
> Avg. commute time (minutes): 27.1 (Mississippi: 25.2)
> Share of commuters driving alone: 87.9% (Mississippi: 84.6%)
> Share of commuters carpooling: 10.2% (Mississippi: 9.2%)
> Share of commuters using public transit: 0.0% reported (Mississippi: 0.3%)
> No. of cities considered in ranking: 14
[in-text-ad-2]
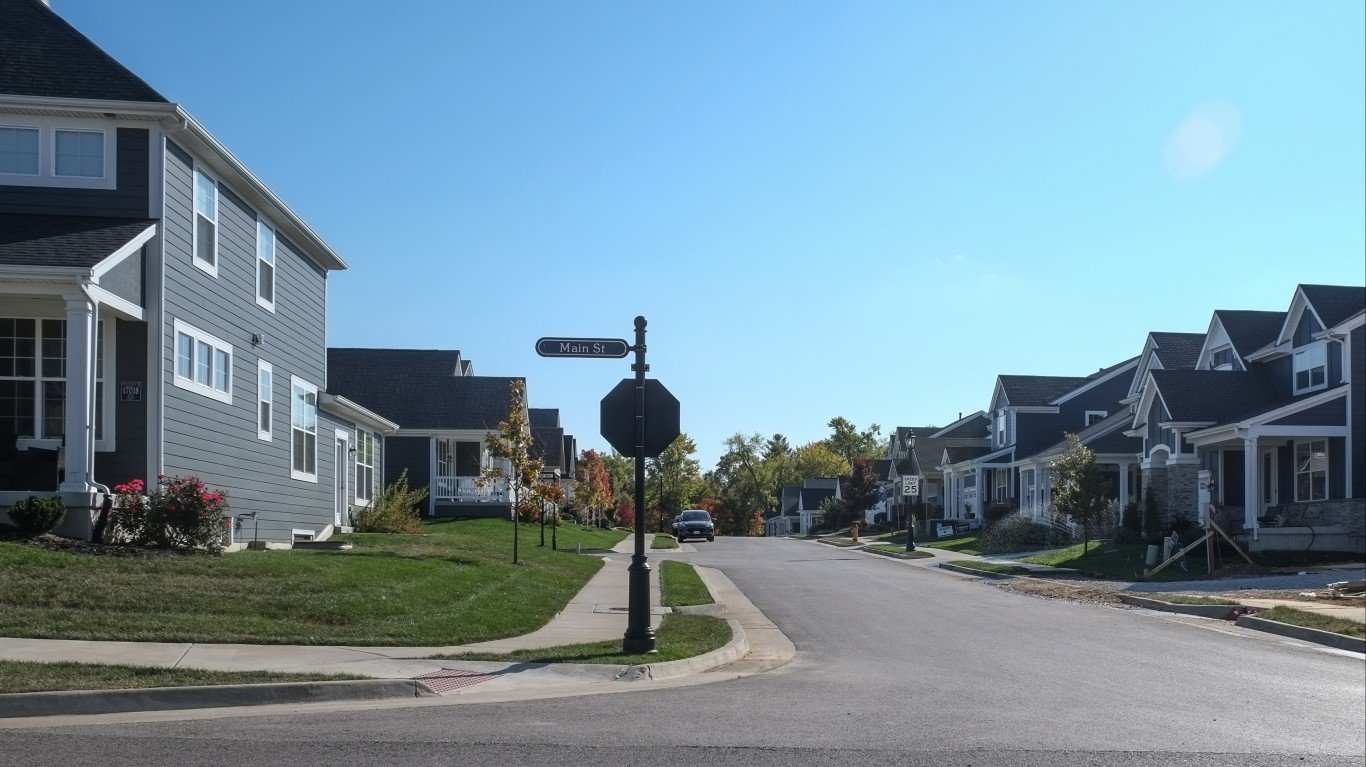
Missouri: Wildwood
> Avg. commute time (minutes): 30.2 (Missouri: 23.9)
> Share of commuters driving alone: 80.6% (Missouri: 80.8%)
> Share of commuters carpooling: 4.9% (Missouri: 8.4%)
> Share of commuters using public transit: 0.3% (Missouri: 1.2%)
> No. of cities considered in ranking: 28
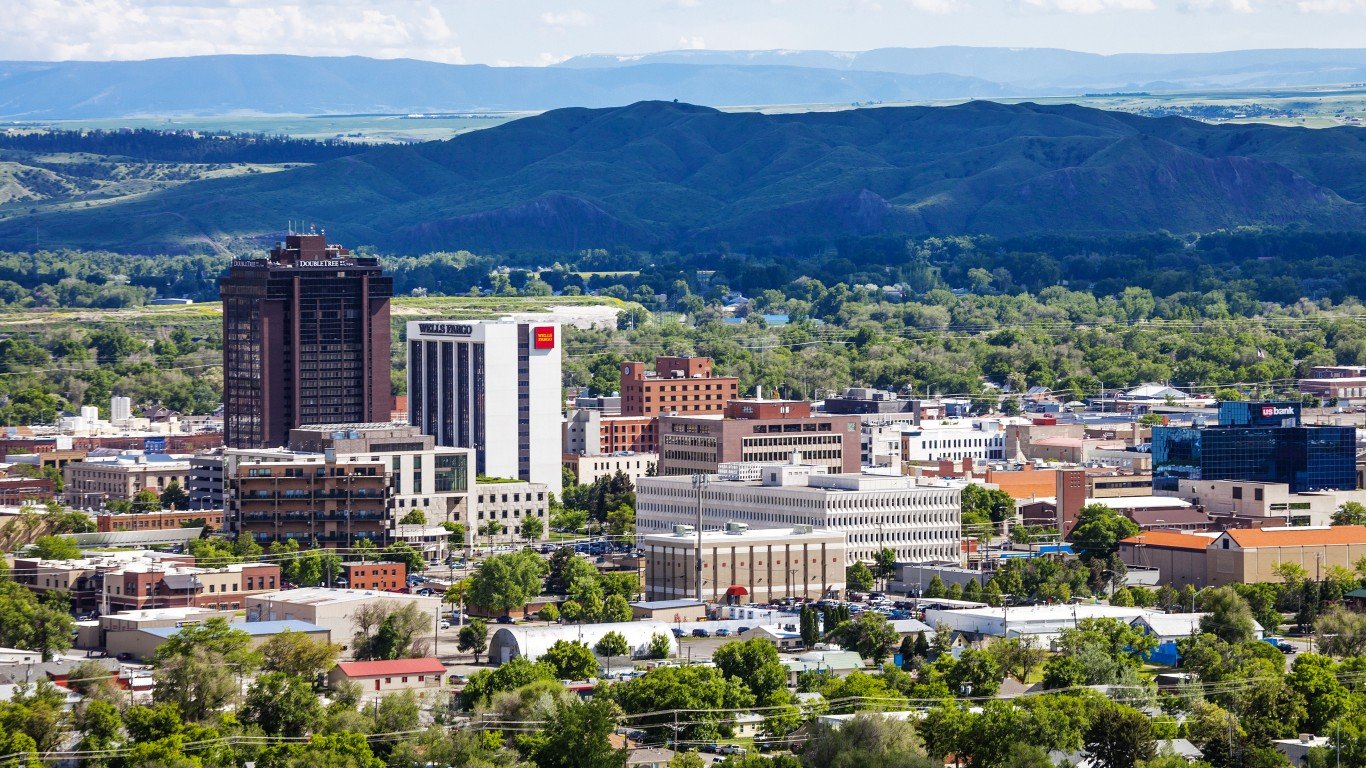
Montana: Billings
> Avg. commute time (minutes): 17.3 (Montana: 18.4)
> Share of commuters driving alone: 82.3% (Montana: 75.2%)
> Share of commuters carpooling: 7.9% (Montana: 9.2%)
> Share of commuters using public transit: 1.0% (Montana: 0.7%)
> No. of cities considered in ranking: 6
[in-text-ad]

Nebraska: Bellevue
> Avg. commute time (minutes): 20.7 (Nebraska: 18.9)
> Share of commuters driving alone: 84.6% (Nebraska: 80.7%)
> Share of commuters carpooling: 9.1% (Nebraska: 9.0%)
> Share of commuters using public transit: 0.1% (Nebraska: 0.6%)
> No. of cities considered in ranking: 6
[recirclink id=987778]
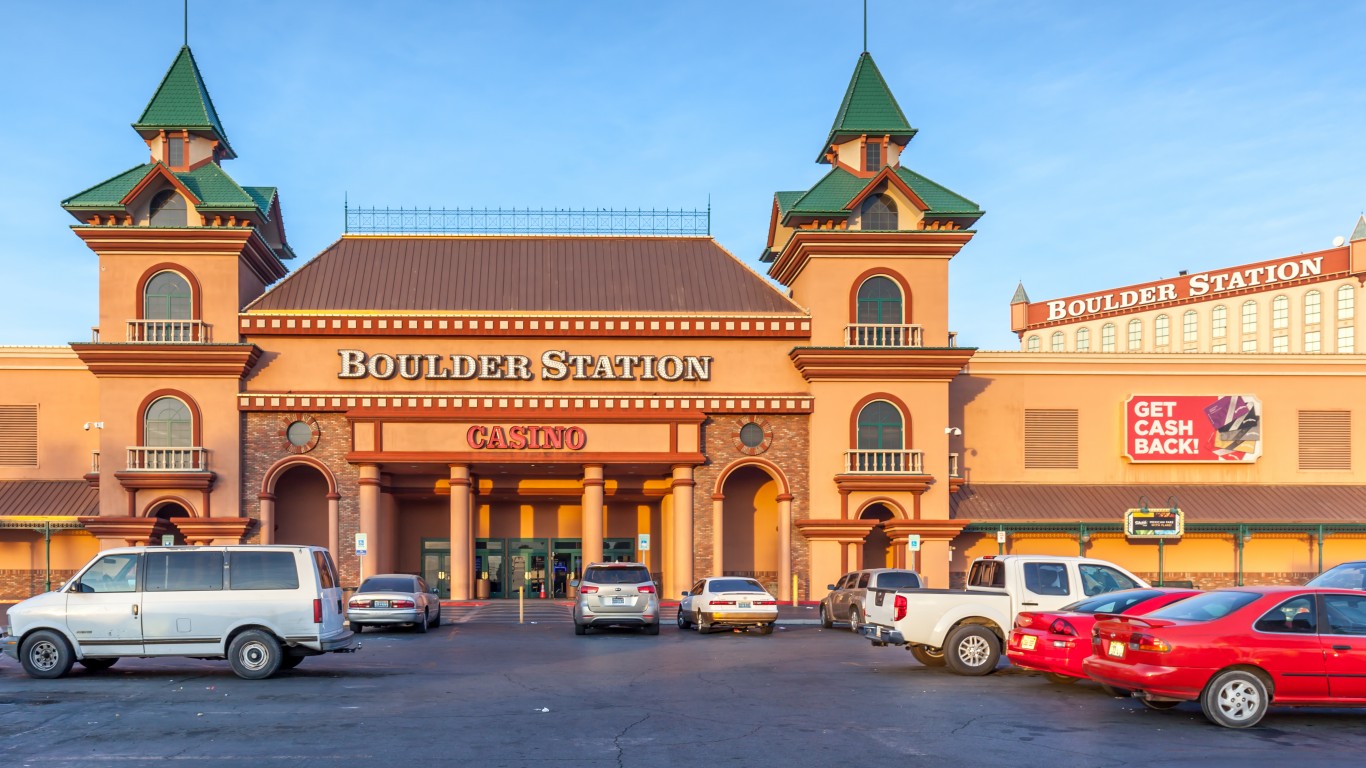
Nevada: Sunrise Manor
> Avg. commute time (minutes): 30.1 (Nevada: 24.6)
> Share of commuters driving alone: 74.9% (Nevada: 76.8%)
> Share of commuters carpooling: 14.3% (Nevada: 10.6%)
> Share of commuters using public transit: 5.8% (Nevada: 2.9%)
> No. of cities considered in ranking: 14
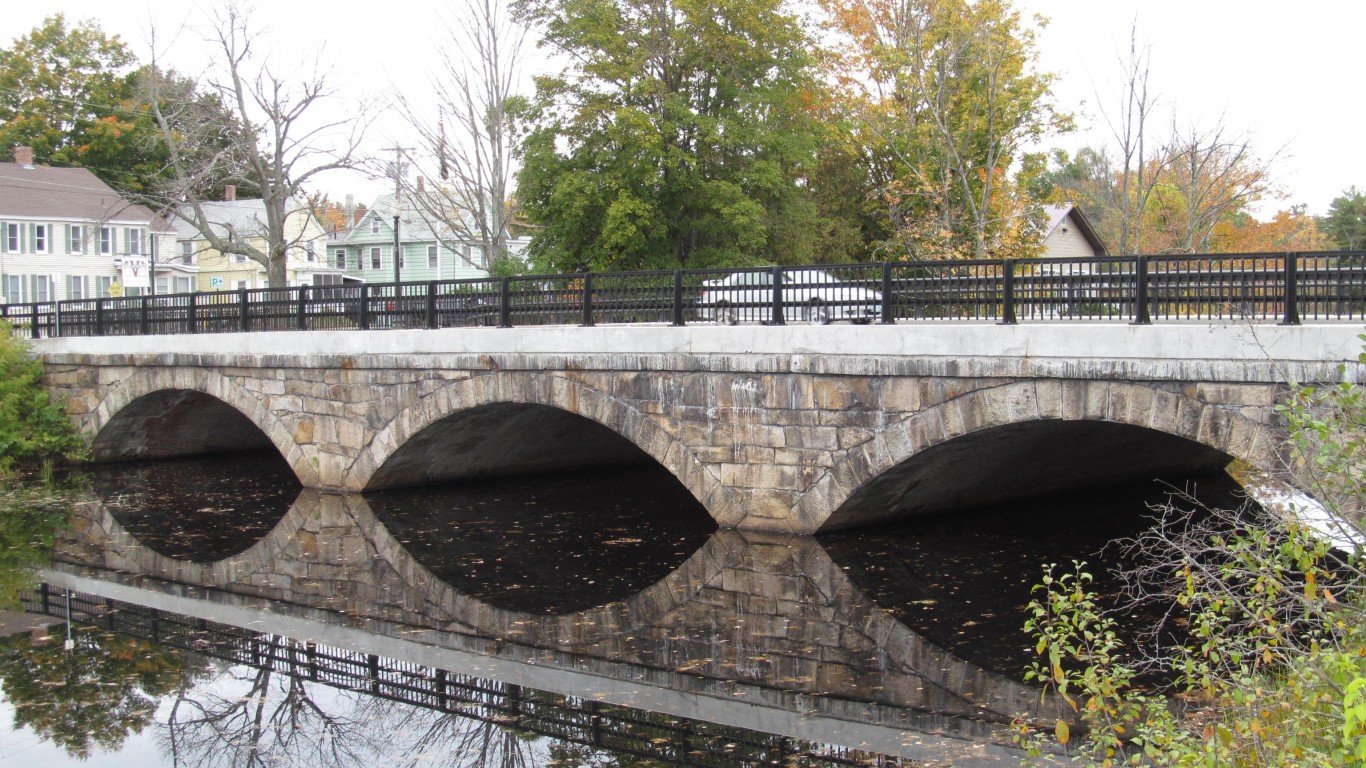
New Hampshire: Rochester
> Avg. commute time (minutes): 27.8 (New Hampshire: 27.4)
> Share of commuters driving alone: 79.9% (New Hampshire: 79.5%)
> Share of commuters carpooling: 10.5% (New Hampshire: 7.7%)
> Share of commuters using public transit: 1.9% (New Hampshire: 0.8%)
> No. of cities considered in ranking: 5
[in-text-ad-2]

New Jersey: Old Bridge
> Avg. commute time (minutes): 40.1 (New Jersey: 32.0)
> Share of commuters driving alone: 73.5% (New Jersey: 69.6%)
> Share of commuters carpooling: 9.0% (New Jersey: 7.8%)
> Share of commuters using public transit: 9.9% (New Jersey: 10.8%)
> No. of cities considered in ranking: 39
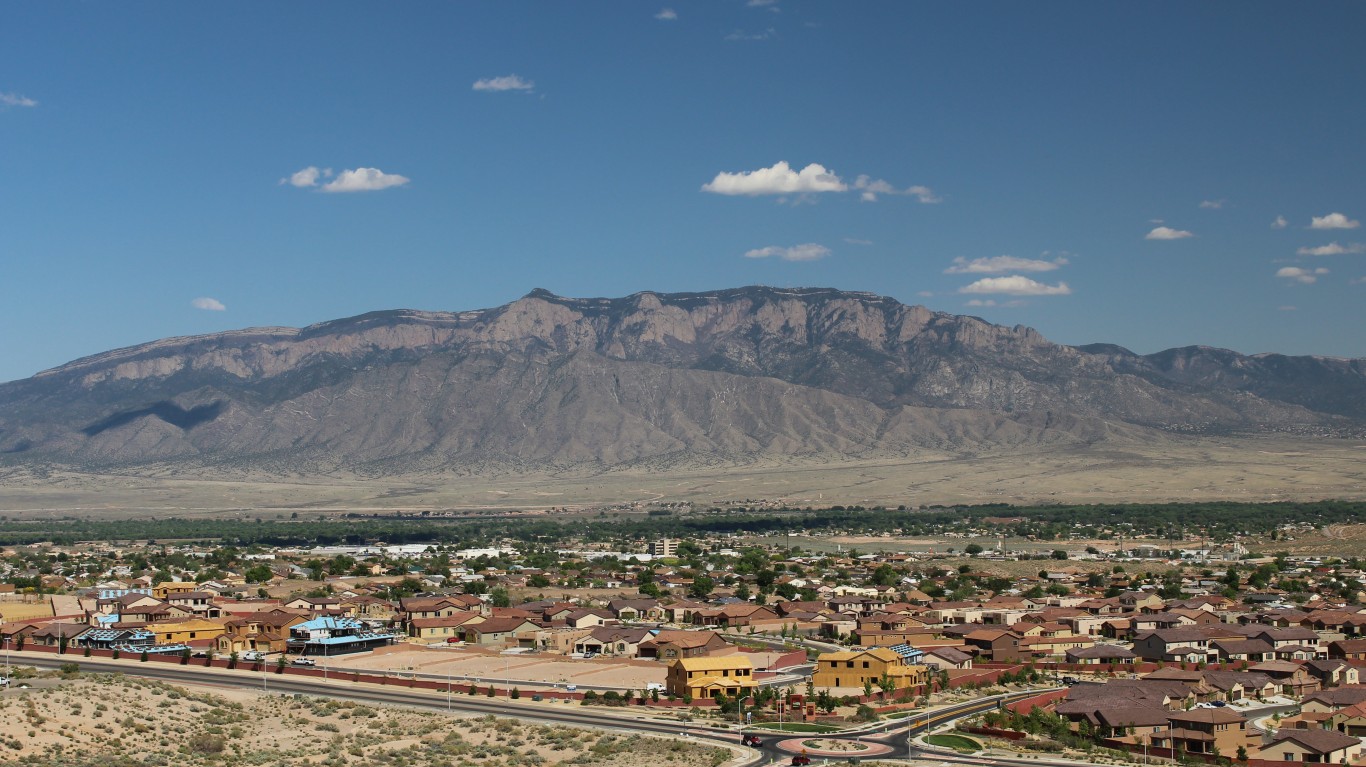
New Mexico: Rio Rancho
> Avg. commute time (minutes): 27.9 (New Mexico: 22.7)
> Share of commuters driving alone: 79.3% (New Mexico: 79.1%)
> Share of commuters carpooling: 11.0% (New Mexico: 10.0%)
> Share of commuters using public transit: 0.8% (New Mexico: 1.0%)
> No. of cities considered in ranking: 11
[in-text-ad]

New York: Long Beach
> Avg. commute time (minutes): 42.3 (New York: 33.5)
> Share of commuters driving alone: 61.7% (New York: 52.3%)
> Share of commuters carpooling: 3.8% (New York: 6.4%)
> Share of commuters using public transit: 20.3% (New York: 26.2%)
> No. of cities considered in ranking: 63
[recirclink id=1044820]

North Carolina: Fuquay-Varina
> Avg. commute time (minutes): 32.5 (North Carolina: 24.9)
> Share of commuters driving alone: 76.2% (North Carolina: 79.3%)
> Share of commuters carpooling: 9.8% (North Carolina: 9.0%)
> Share of commuters using public transit: 0.1% (North Carolina: 1.0%)
> No. of cities considered in ranking: 40
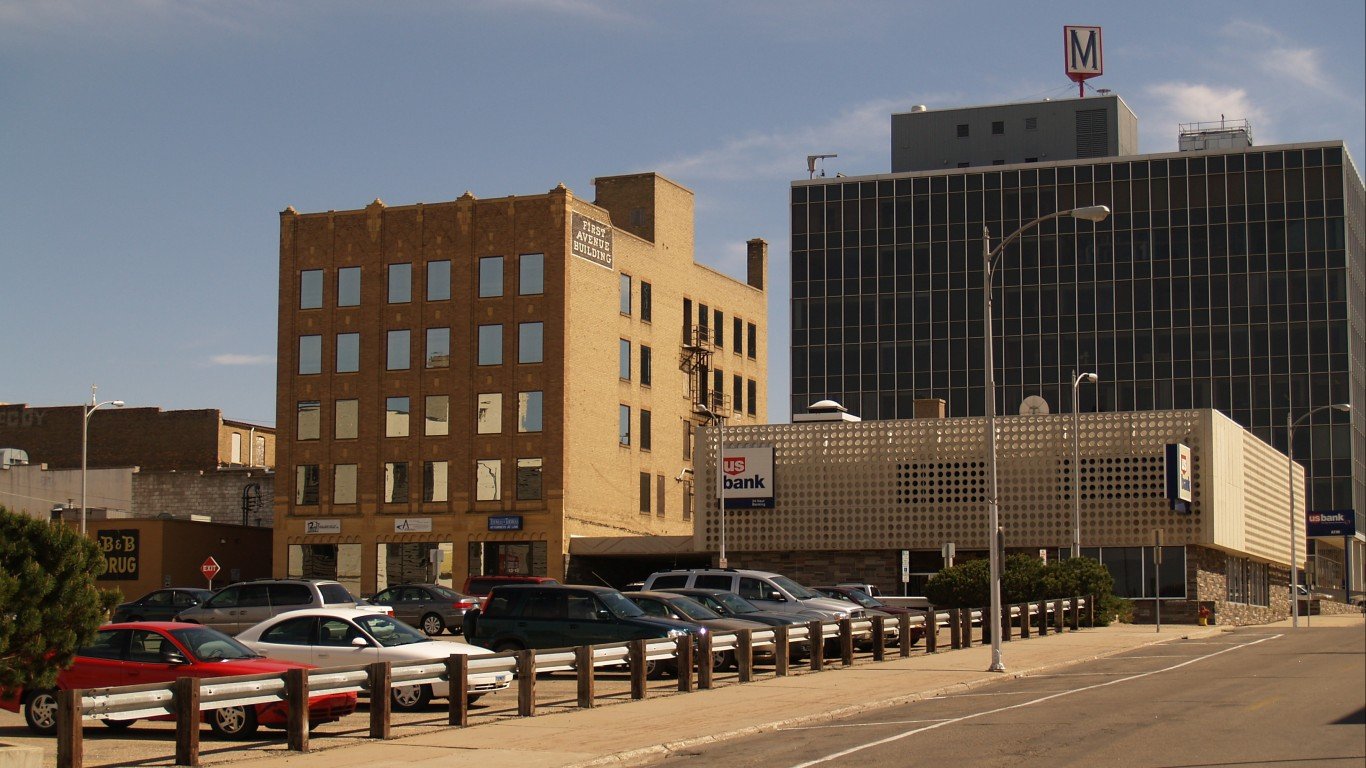
North Dakota: Minot
> Avg. commute time (minutes): 18.8 (North Dakota: 17.6)
> Share of commuters driving alone: 81.1% (North Dakota: 80.8%)
> Share of commuters carpooling: 10.8% (North Dakota: 8.9%)
> Share of commuters using public transit: 0.5% (North Dakota: 0.5%)
> No. of cities considered in ranking: 6
[in-text-ad-2]
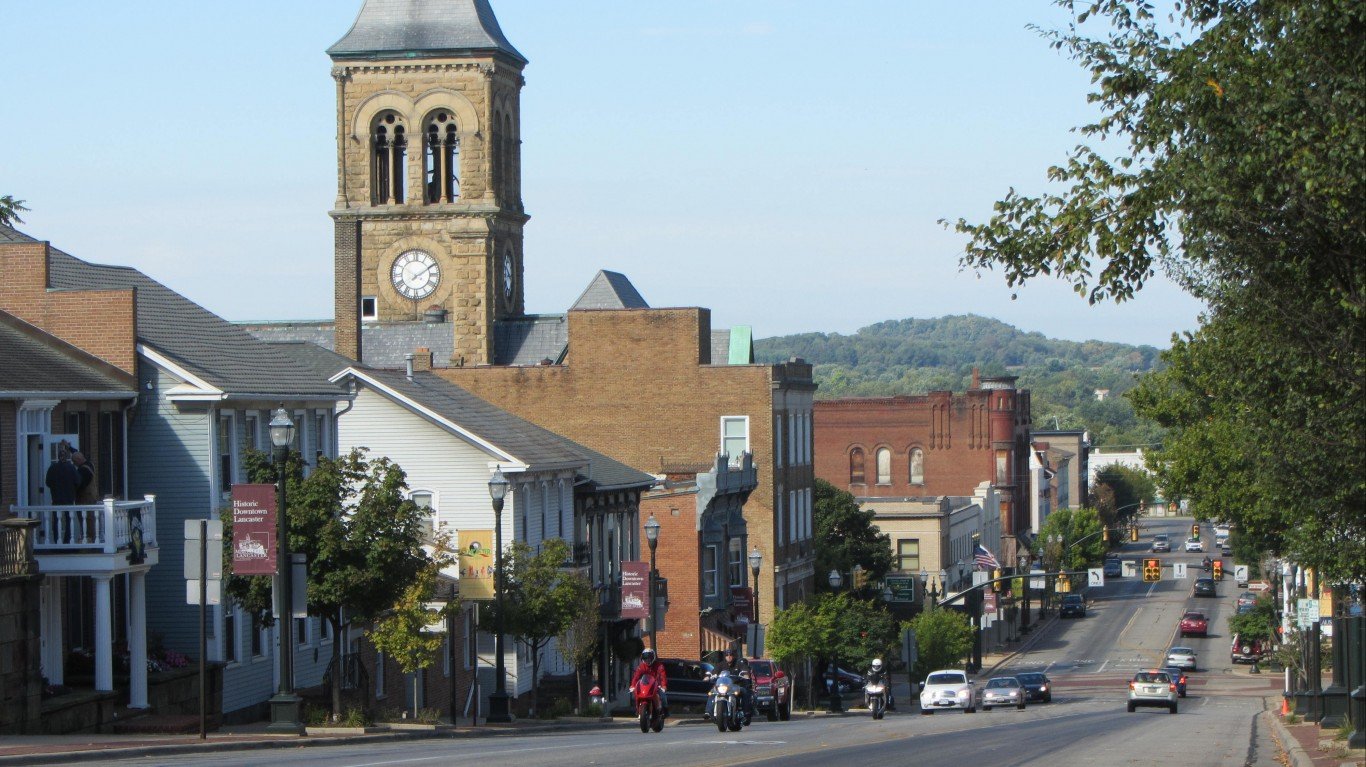
Ohio: Lancaster
> Avg. commute time (minutes): 28.0 (Ohio: 23.7)
> Share of commuters driving alone: 81.1% (Ohio: 81.5%)
> Share of commuters carpooling: 10.2% (Ohio: 7.6%)
> Share of commuters using public transit: 0.3% (Ohio: 1.4%)
> No. of cities considered in ranking: 61

Oklahoma: Moore
> Avg. commute time (minutes): 23.6 (Oklahoma: 22.0)
> Share of commuters driving alone: 84.1% (Oklahoma: 81.6%)
> Share of commuters carpooling: 8.3% (Oklahoma: 9.7%)
> Share of commuters using public transit: 0.0% (Oklahoma: 0.4%)
> No. of cities considered in ranking: 16
[in-text-ad]

Oregon: Oregon City
> Avg. commute time (minutes): 29.8 (Oregon: 23.9)
> Share of commuters driving alone: 77.9% (Oregon: 70.5%)
> Share of commuters carpooling: 9.5% (Oregon: 9.4%)
> Share of commuters using public transit: 1.7% (Oregon: 4.0%)
> No. of cities considered in ranking: 23
[recirclink id=1054986]
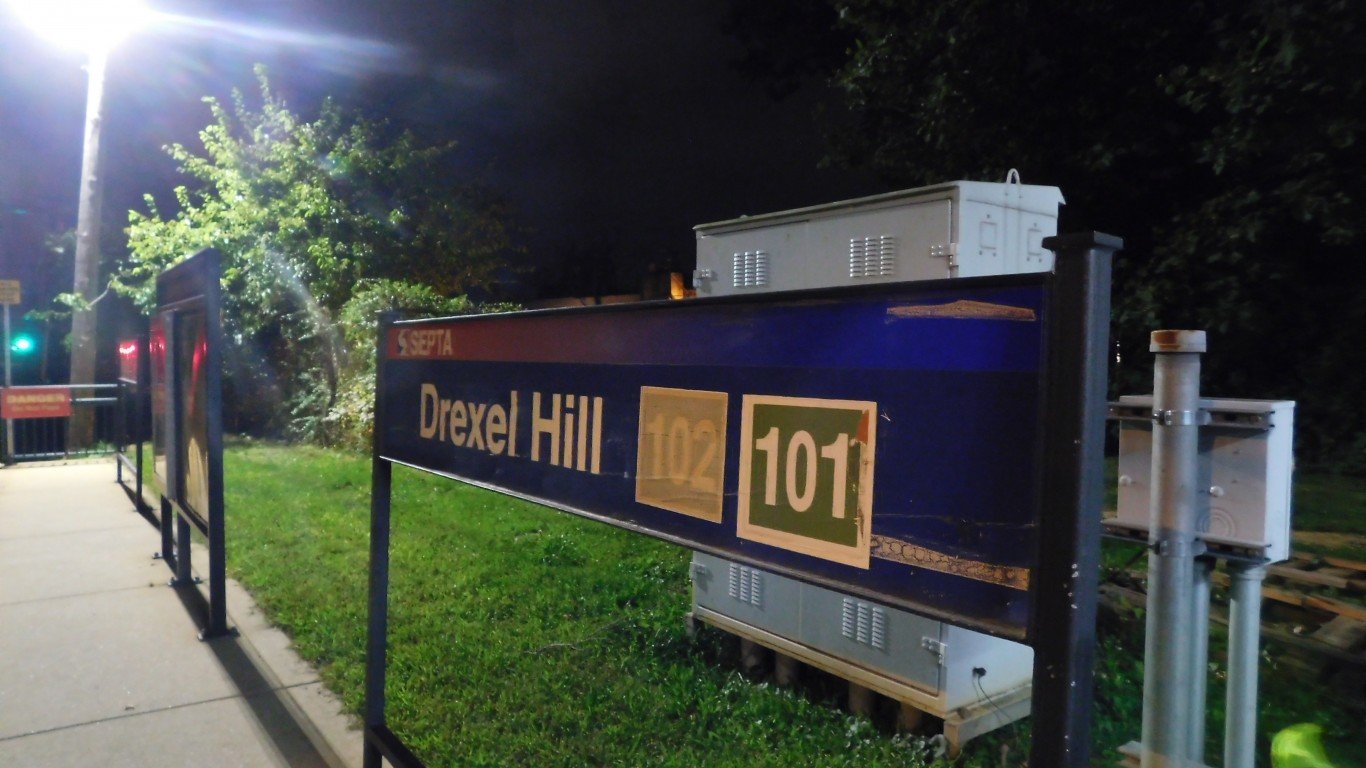
Pennsylvania: Drexel Hill
> Avg. commute time (minutes): 33.8 (Pennsylvania: 27.1)
> Share of commuters driving alone: 72.1% (Pennsylvania: 74.4%)
> Share of commuters carpooling: 7.7% (Pennsylvania: 8.2%)
> Share of commuters using public transit: 10.7% (Pennsylvania: 5.2%)
> No. of cities considered in ranking: 23

Rhode Island: Pawtucket
> Avg. commute time (minutes): 25.9 (Rhode Island: 25.3)
> Share of commuters driving alone: 80.0% (Rhode Island: 79.7%)
> Share of commuters carpooling: 11.3% (Rhode Island: 8.1%)
> Share of commuters using public transit: 3.0% (Rhode Island: 2.2%)
> No. of cities considered in ranking: 6
[in-text-ad-2]
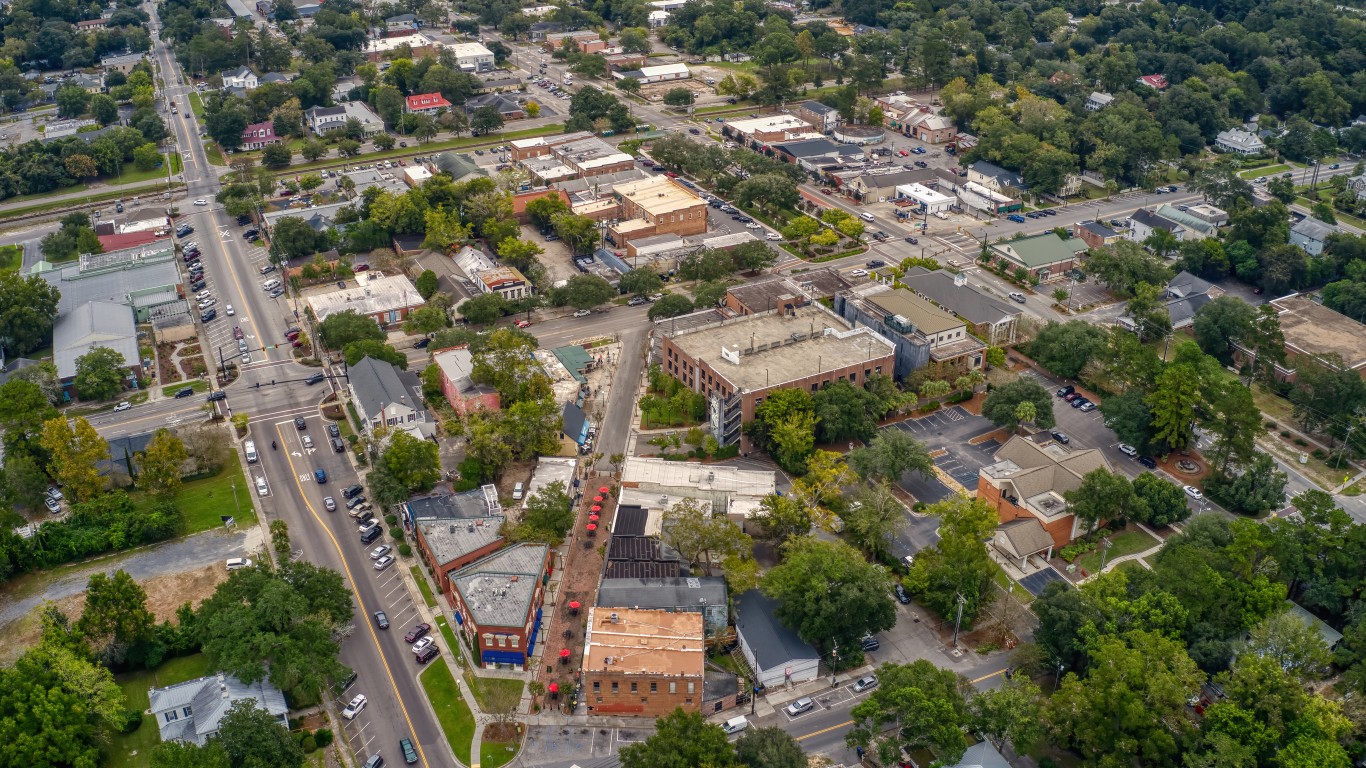
South Carolina: Summerville
> Avg. commute time (minutes): 30.2 (South Carolina: 25.1)
> Share of commuters driving alone: 86.1% (South Carolina: 81.5%)
> Share of commuters carpooling: 6.9% (South Carolina: 8.9%)
> Share of commuters using public transit: 0.5% (South Carolina: 0.5%)
> No. of cities considered in ranking: 19
South Dakota: Rapid City
> Avg. commute time (minutes): 17.4 (South Dakota: 17.3)
> Share of commuters driving alone: 81.9% (South Dakota: 80.0%)
> Share of commuters carpooling: 7.1% (South Dakota: 8.1%)
> Share of commuters using public transit: 1.3% (South Dakota: 0.5%)
> No. of cities considered in ranking: 3
[in-text-ad]
Tennessee: La Vergne
> Avg. commute time (minutes): 31.5 (Tennessee: 25.4)
> Share of commuters driving alone: 82.2% (Tennessee: 81.9%)
> Share of commuters carpooling: 9.8% (Tennessee: 8.8%)
> Share of commuters using public transit: 0.1% (Tennessee: 0.6%)
> No. of cities considered in ranking: 28
[recirclink id=1060122]

Texas: Canyon Lake
> Avg. commute time (minutes): 38.9 (Texas: 26.6)
> Share of commuters driving alone: 78.8% (Texas: 78.7%)
> Share of commuters carpooling: 6.0% (Texas: 9.9%)
> Share of commuters using public transit: 0.0% reported (Texas: 1.3%)
> No. of cities considered in ranking: 127

Utah: Eagle Mountain
> Avg. commute time (minutes): 33.2 (Utah: 22.0)
> Share of commuters driving alone: 72.5% (Utah: 74.4%)
> Share of commuters carpooling: 12.4% (Utah: 10.4%)
> Share of commuters using public transit: 1.1% (Utah: 2.2%)
> No. of cities considered in ranking: 38
[in-text-ad-2]

Vermont: Burlington
> Avg. commute time (minutes): 18.8 (Vermont: 23.3)
> Share of commuters driving alone: 50.2% (Vermont: 74.4%)
> Share of commuters carpooling: 8.3% (Vermont: 8.5%)
> Share of commuters using public transit: 5.8% (Vermont: 1.2%)
> No. of cities considered in ranking: 1
*Because Burlington is the only eligible city in Vermont, it is the city with the longest average commute time by default.

Virginia: Lake Ridge
> Avg. commute time (minutes): 42.5 (Virginia: 28.6)
> Share of commuters driving alone: 71.1% (Virginia: 74.9%)
> Share of commuters carpooling: 12.7% (Virginia: 8.9%)
> Share of commuters using public transit: 6.2% (Virginia: 4.0%)
> No. of cities considered in ranking: 43
[in-text-ad]
Washington: Graham
> Avg. commute time (minutes): 43.6 (Washington: 28.0)
> Share of commuters driving alone: 79.5% (Washington: 69.7%)
> Share of commuters carpooling: 10.6% (Washington: 9.7%)
> Share of commuters using public transit: 1.5% (Washington: 6.0%)
> No. of cities considered in ranking: 47
[recirclink id=1024519]

West Virginia: Huntington
> Avg. commute time (minutes): 19.1 (West Virginia: 26.1)
> Share of commuters driving alone: 72.7% (West Virginia: 82.0%)
> Share of commuters carpooling: 10.5% (West Virginia: 8.6%)
> Share of commuters using public transit: 2.9% (West Virginia: 0.8%)
> No. of cities considered in ranking: 5
Wisconsin: Caledonia
> Avg. commute time (minutes): 25.6 (Wisconsin: 22.2)
> Share of commuters driving alone: 89.1% (Wisconsin: 79.9%)
> Share of commuters carpooling: 5.5% (Wisconsin: 7.7%)
> Share of commuters using public transit: 0.2% (Wisconsin: 1.5%)
> No. of cities considered in ranking: 34
[in-text-ad-2]
Wyoming: Gillette
> Avg. commute time (minutes): 18.6 (Wyoming: 17.9)
> Share of commuters driving alone: 81.8% (Wyoming: 77.4%)
> Share of commuters carpooling: 11.6% (Wyoming: 10.0%)
> Share of commuters using public transit: 1.2% (Wyoming: 1.0%)
> No. of cities considered in ranking: 4
Methodology
To determine the city with the longest commute in every state, 24/7 Wall St. reviewed five-year estimates of average commute times from the U.S. Census Bureau’s 2020 American Community Survey.
We used census “place” geographies — a category that includes incorporated legal entities and census-designated statistical entities. We defined cities based on a population threshold — census places needed to have a population of at least 25,000 to be considered.
Cities were excluded if average commute time estimates were not available in the 2020 ACS, if there were fewer than 1,000 workers 16 years and over who did not work from home, or if the sampling error associated with a city’s data was deemed too high.
The sampling error was defined as too high if the coefficient of variation — a statistical assessment of how reliable an estimate is — for a city’s average commute time was above 15% and greater than two standard deviations above the mean CV for all cities’ average commute times. We similarly excluded cities that had a sampling error too high for their population, using the same definition.
Cities were ranked based on their average commute time. To break ties, we used the share of workers with a commute of 45 minutes or longer.
Additional information on the share of commuters driving alone, carpooling, and using public transit are also five-year estimates from the 2020 ACS. Because the Census Bureau didn’t release one-year estimates for 2020 due to data collection issues caused by the COVID-19 pandemic, all ACS data are five-year estimates.
Contact [email protected] for any questions or corrections.