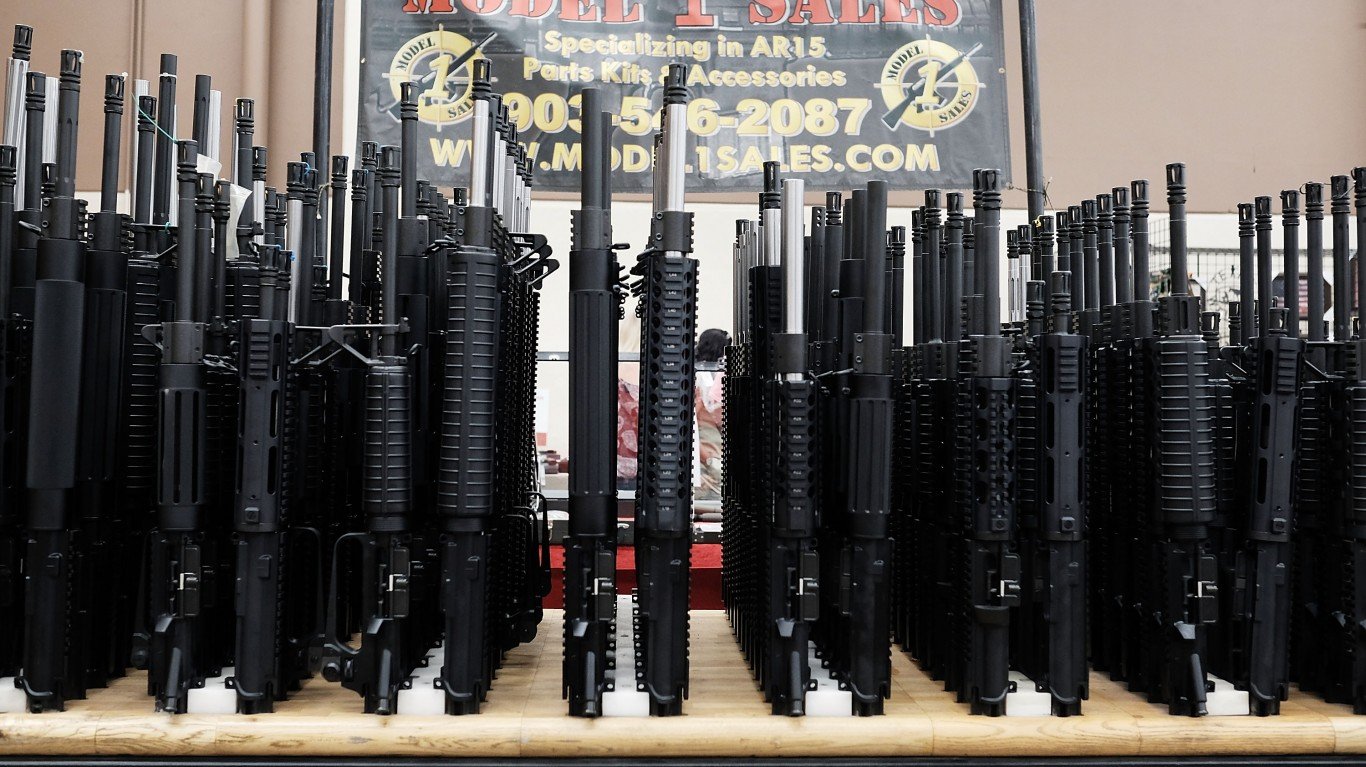
Americans have more guns than anywhere else in the world, and gun sales in the U.S. continue to eclipse those in any other country. This is true both in terms of absolute sales and gun ownership by person. The fact that both measures are true is staggering. America, without any question, is the gun sales and gun ownership capital of the world.
The FBI has tracked gun background checks since the 1990s, and it reports the results in its Firearms Background Check Database. Background check figures, often used as a proxy for gun sales, have risen in most years — and they have risen much faster than the American population has. (Many of the guns Americans buy come from other countries. Here are the countries exporting the most guns to the U.S.)
On the subject of gun ownership compared to the rest of the world, there are almost 400 million guns in the U.S — 1.2 per person — which is by far the most among all nations. By contrast, Canada’s figure is 0.34 per person. Gun violence levels in the U.S. are equally staggering. According to the Gun Violence Archive, there were 45,041 gun deaths last year. Slightly more than half of those were suicides. (These are 28 guns used the most to commit crimes in America.)
The pace of increased sales year over year has accelerated recently. Gun sales, which were already high by almost any standard, jumped at the start of the pandemic. The FBI data on background checks is often used as a proxy for trends in gun sales, although the FBI notes that the figures are not a one-to-one comparison. Based on these figures, there were 39,695,315 checks in 2020, up from 28,369,750 in 2019. They remained fairly high in 2021, at 38,876,6783.
The coronavirus pandemic, surging unemployment, and the civil rest across much of the country last summer following the murder of George Floyd stoked fears that helped fuel America’s gun sales.
Recently, however, there was a change in the two-year pattern of high background checks — and by most reports, gun sales. Checks have dropped sharply in 2022 compared to 2021. There have been a little over 18.2 million checks in the first seven months, down from 25.1 million in the same period last year. Gun sales were also not uniform nationwide.
Raw guns sales figures by state are not particularly helpful when it comes to an analysis of which states have the most gun sales activity. Sales in Kentucky are at or near the top of the FBI list most months. This is even more remarkable considering the state’s population is fairly small.
Using FBI data, 24/7 Wall St. looked at gun background checks (in the first seven months of the year) per 1,000 people by state. This paints a more detailed picture of where the velocity of gun sales is the greatest. We also looked at the change of this metric year over year in the January through July period.
Background checks range from 7.7 per 1,000 people in the state with the fewest gun sales per person to 542 per 1,000 people in the state with the most gun sales per capita. The state with the most gun sales per capita also had the largest year-over-year increase in gun sales.
Click here to see states with the most gun purchases per person.
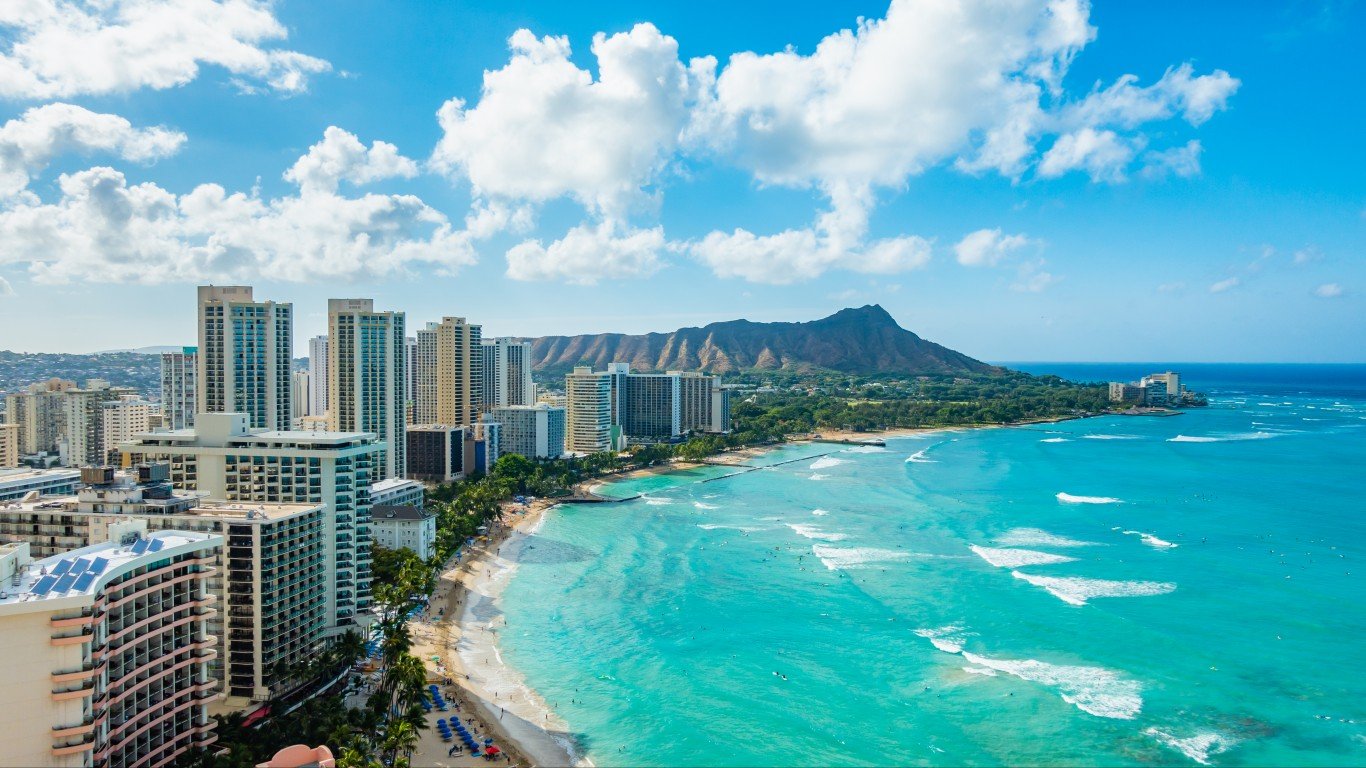
50. Hawaii
> Firearm background checks Jan-July 2022: 7.7 per 1,000 (10,950)
> Firearm background checks Jan-July 2021: 6.9 per 1,000 (the fewest)
> Change in background checks, first seven months year-to-date: +1,189 (+12.2% — 2nd largest increase)
> Population: 1,420,074 (11th smallest)
[in-text-ad]
49. New Jersey
> Firearm background checks Jan-July 2022: 10.8 per 1,000 (95,697)
> Firearm background checks Jan-July 2021: 17.0 per 1,000 (3rd fewest)
> Change in background checks, first seven months year-to-date: -55,444 (-36.7% — 3rd largest decrease)
> Population: 8,885,418 (11th largest)
[recirclink id=1158416]
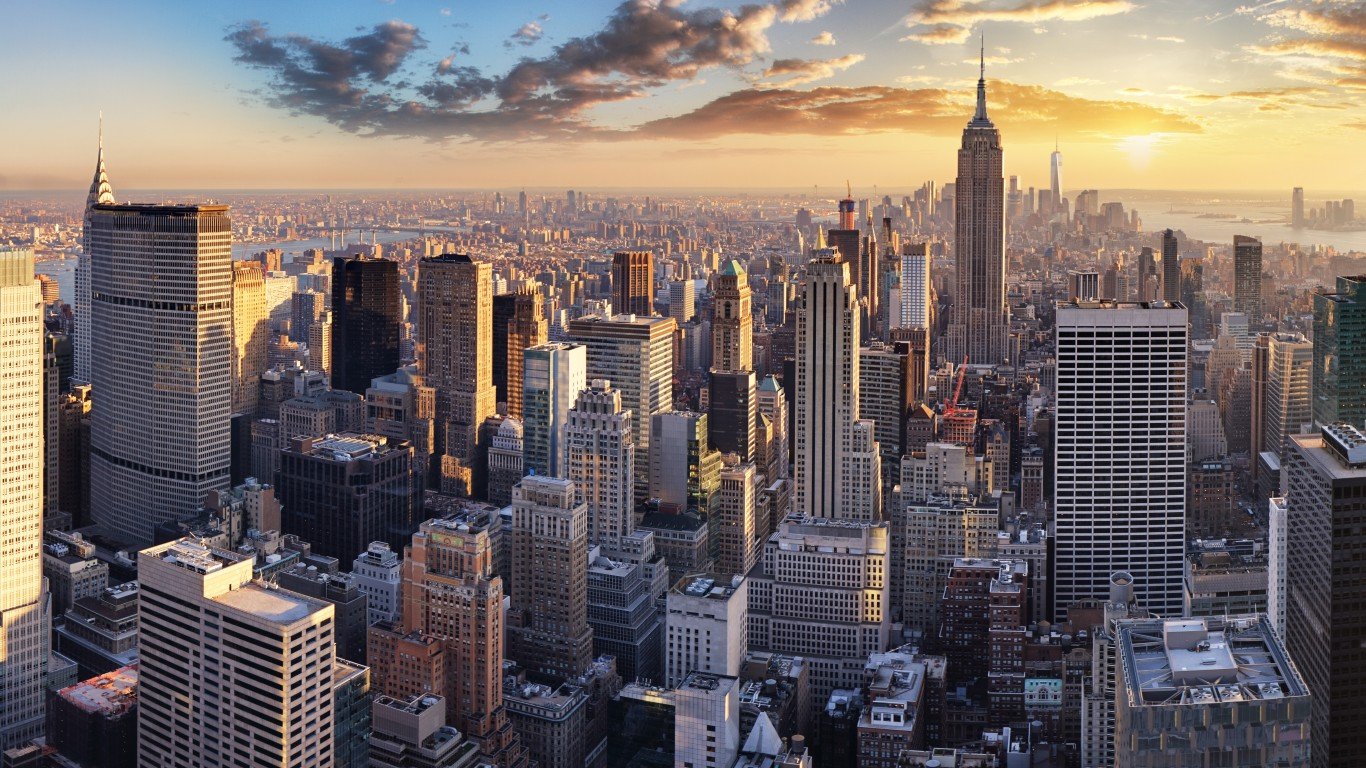
48. New York
> Firearm background checks Jan-July 2022: 13.3 per 1,000 (259,322)
> Firearm background checks Jan-July 2021: 14.3 per 1,000 (2nd fewest)
> Change in background checks, first seven months year-to-date: -18,936 (-6.8% — the smallest decrease)
> Population: 19,514,849 (4th largest)

47. Rhode Island
> Firearm background checks Jan-July 2022: 16.2 per 1,000 (17,097)
> Firearm background checks Jan-July 2021: 23.9 per 1,000 (6th fewest)
> Change in background checks, first seven months year-to-date: -8,164 (-32.3% — 5th largest decrease)
> Population: 1,057,798 (7th smallest)
[in-text-ad-2]

46. Massachusetts
> Firearm background checks Jan-July 2022: 19.3 per 1,000 (132,526)
> Firearm background checks Jan-July 2021: 23.8 per 1,000 (5th fewest)
> Change in background checks, first seven months year-to-date: -30,861 (-18.9% — 21st smallest decrease)
> Population: 6,873,003 (15th largest)

45. California
> Firearm background checks Jan-July 2022: 20.7 per 1,000 (812,650)
> Firearm background checks Jan-July 2021: 22.5 per 1,000 (4th fewest)
> Change in background checks, first seven months year-to-date: -73,642 (-8.3% — 3rd smallest decrease)
> Population: 39,346,023 (the largest)
[in-text-ad]
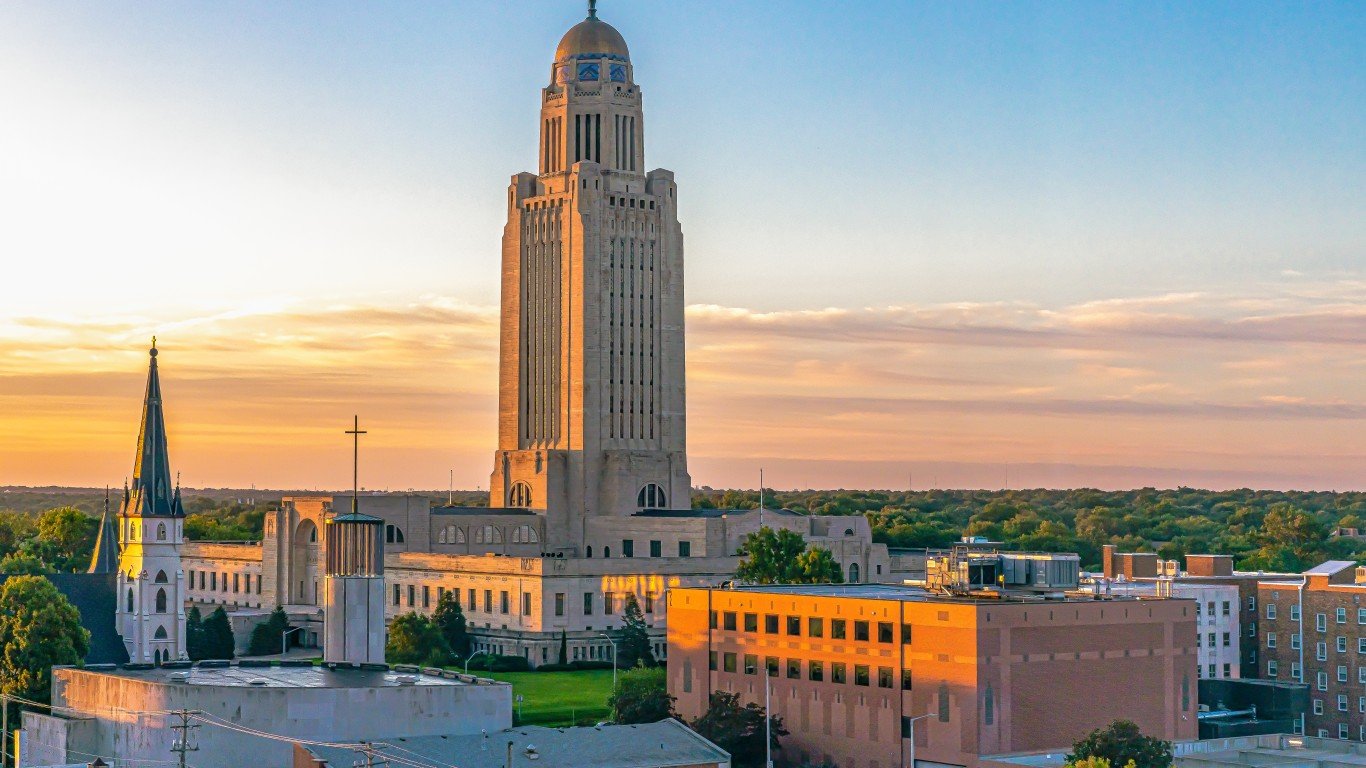
44. Nebraska
> Firearm background checks Jan-July 2022: 22.4 per 1,000 (43,158)
> Firearm background checks Jan-July 2021: 29.0 per 1,000 (8th fewest)
> Change in background checks, first seven months year-to-date: -12,573 (-22.6% — 12th largest decrease)
> Population: 1,923,826 (14th smallest)
[recirclink id=1157167]

43. Maryland
> Firearm background checks Jan-July 2022: 22.5 per 1,000 (135,997)
> Firearm background checks Jan-July 2021: 28.2 per 1,000 (7th fewest)
> Change in background checks, first seven months year-to-date: -34,050 (-20.0% — 22nd largest decrease)
> Population: 6,037,624 (19th largest)
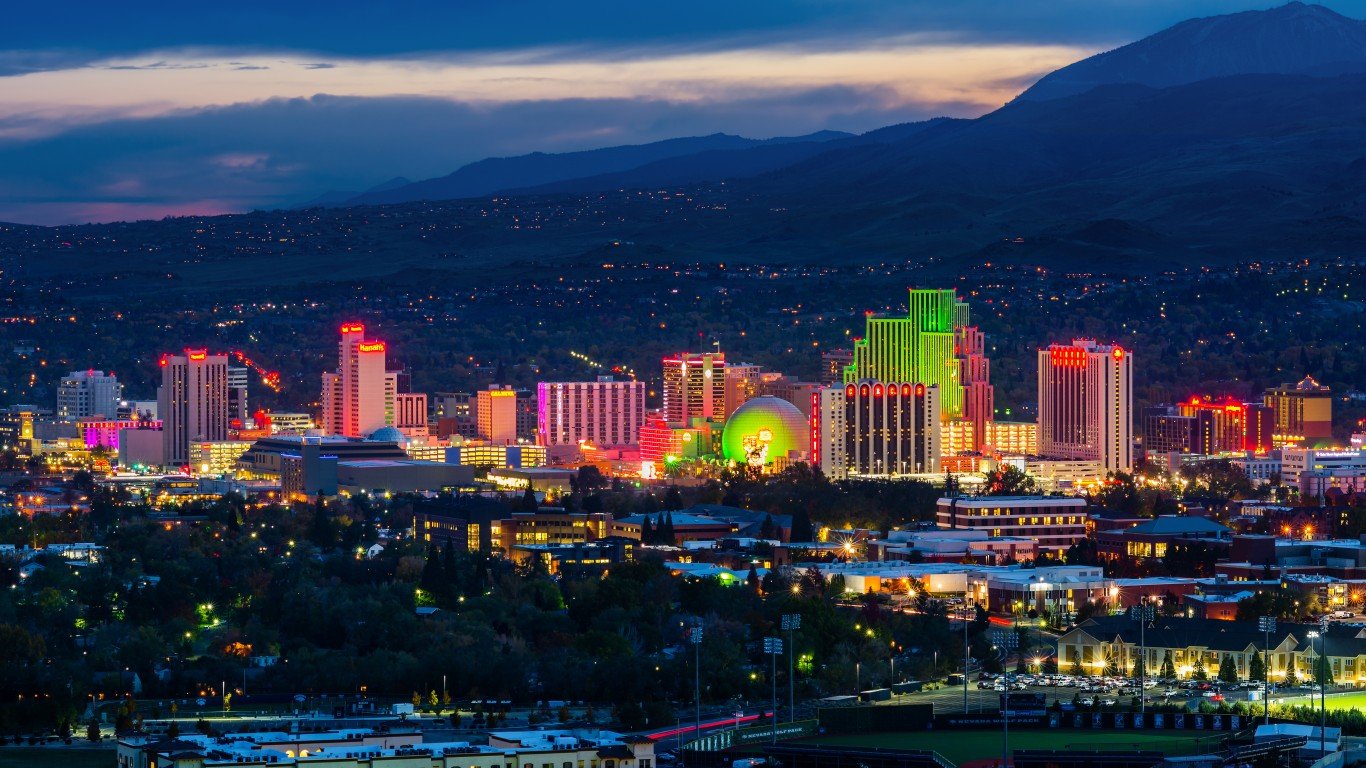
42. Nevada
> Firearm background checks Jan-July 2022: 30.6 per 1,000 (92,840)
> Firearm background checks Jan-July 2021: 39.1 per 1,000 (9th fewest)
> Change in background checks, first seven months year-to-date: -25,703 (-21.7% — 14th largest decrease)
> Population: 3,030,281 (19th smallest)
[in-text-ad-2]

41. Georgia
> Firearm background checks Jan-July 2022: 32.7 per 1,000 (343,966)
> Firearm background checks Jan-July 2021: 49.4 per 1,000 (16th fewest)
> Change in background checks, first seven months year-to-date: -175,176 (-33.7% — 4th largest decrease)
> Population: 10,516,579 (8th largest)

40. Ohio
> Firearm background checks Jan-July 2022: 33.1 per 1,000 (386,047)
> Firearm background checks Jan-July 2021: 45.4 per 1,000 (12th fewest)
> Change in background checks, first seven months year-to-date: -144,348 (-27.2% — 7th largest decrease)
> Population: 11,675,275 (7th largest)
[in-text-ad]
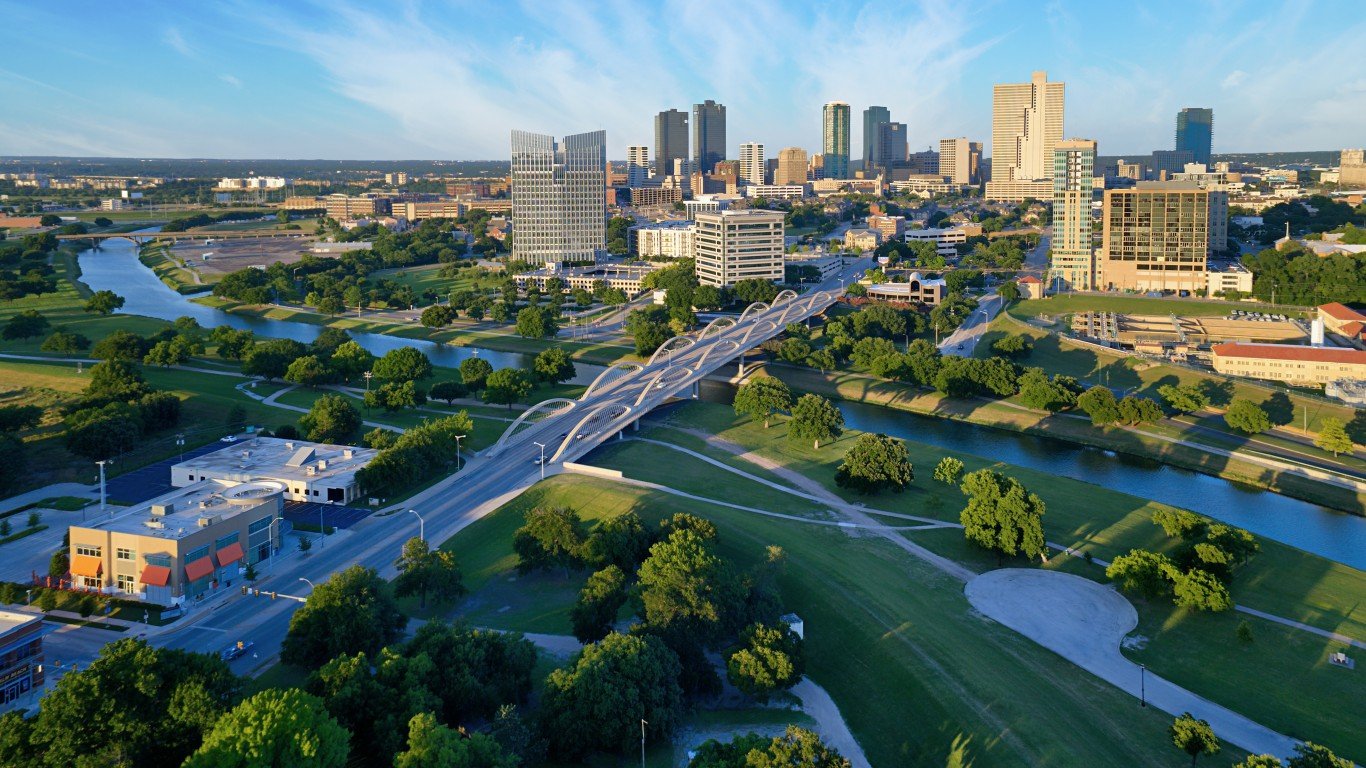
39. Texas
> Firearm background checks Jan-July 2022: 34.6 per 1,000 (991,759)
> Firearm background checks Jan-July 2021: 41.8 per 1,000 (10th fewest)
> Change in background checks, first seven months year-to-date: -206,208 (-17.2% — 13th smallest decrease)
> Population: 28,635,442 (2nd largest)
[recirclink id=1153671]
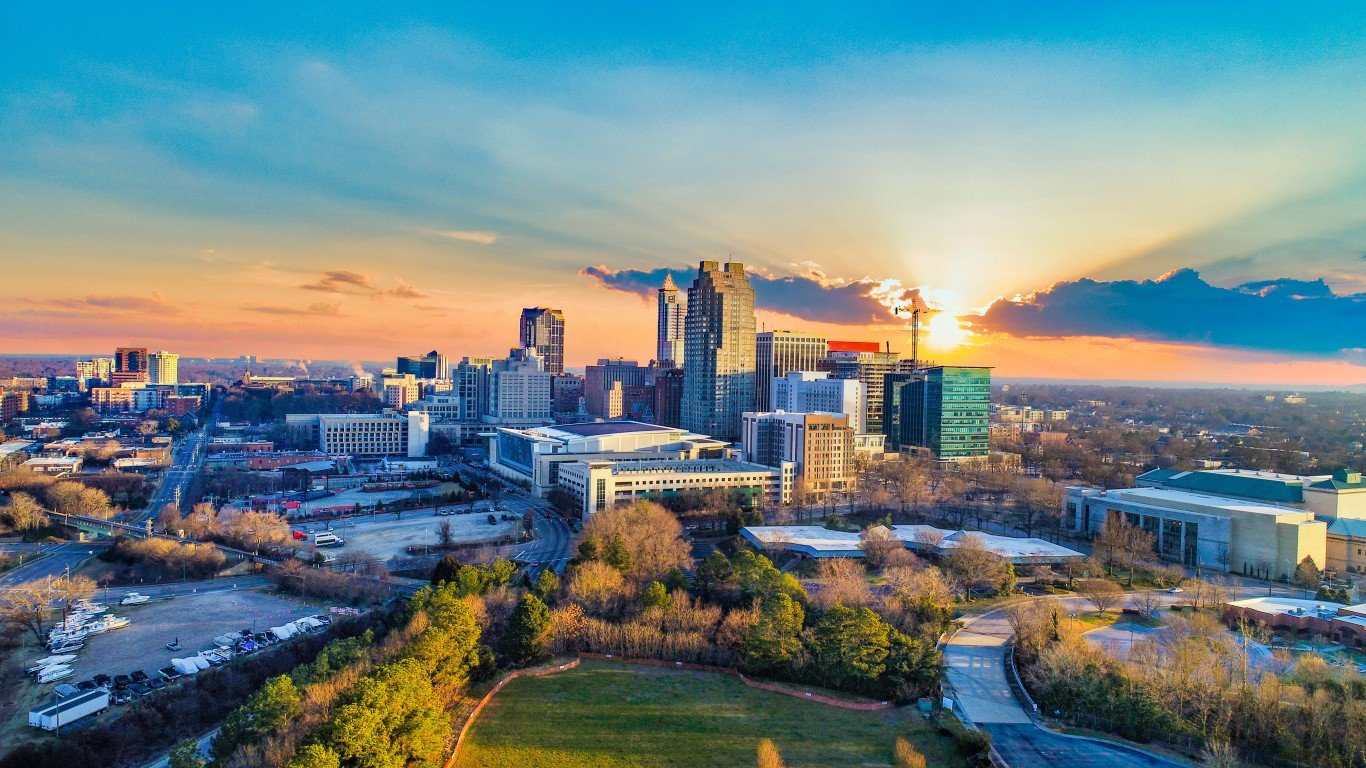
38. North Carolina
> Firearm background checks Jan-July 2022: 34.8 per 1,000 (361,510)
> Firearm background checks Jan-July 2021: 47.9 per 1,000 (15th fewest)
> Change in background checks, first seven months year-to-date: -135,789 (-27.3% — 6th largest decrease)
> Population: 10,386,227 (9th largest)
37. Kansas
> Firearm background checks Jan-July 2022: 37.5 per 1,000 (109,269)
> Firearm background checks Jan-July 2021: 47.2 per 1,000 (14th fewest)
> Change in background checks, first seven months year-to-date: -28,142 (-20.5% — 17th largest decrease)
> Population: 2,912,619 (16th smallest)
[in-text-ad-2]

36. Virginia
> Firearm background checks Jan-July 2022: 38.0 per 1,000 (322,937)
> Firearm background checks Jan-July 2021: 46.7 per 1,000 (13th fewest)
> Change in background checks, first seven months year-to-date: -74,581 (-18.8% — 20th smallest decrease)
> Population: 8,509,358 (12th largest)

35. Delaware
> Firearm background checks Jan-July 2022: 39.5 per 1,000 (38,241)
> Firearm background checks Jan-July 2021: 44.3 per 1,000 (11th fewest)
> Change in background checks, first seven months year-to-date: -4,664 (-10.9% — 4th smallest decrease)
> Population: 967,679 (6th smallest)
[in-text-ad]

34. Connecticut
> Firearm background checks Jan-July 2022: 40.3 per 1,000 (143,723)
> Firearm background checks Jan-July 2021: 50.6 per 1,000 (20th fewest)
> Change in background checks, first seven months year-to-date: -36,791 (-20.4% — 19th largest decrease)
> Population: 3,570,549 (22nd smallest)
[recirclink id=1153569]
33. Vermont
> Firearm background checks Jan-July 2022: 40.9 per 1,000 (25,530)
> Firearm background checks Jan-July 2021: 50.2 per 1,000 (18th fewest)
> Change in background checks, first seven months year-to-date: -5,810 (-18.5% — 19th smallest decrease)
> Population: 624,340 (2nd smallest)

32. Florida
> Firearm background checks Jan-July 2022: 41.0 per 1,000 (868,987)
> Firearm background checks Jan-July 2021: 49.9 per 1,000 (17th fewest)
> Change in background checks, first seven months year-to-date: -190,135 (-18.0% — 16th smallest decrease)
> Population: 21,216,924 (3rd largest)
[in-text-ad-2]
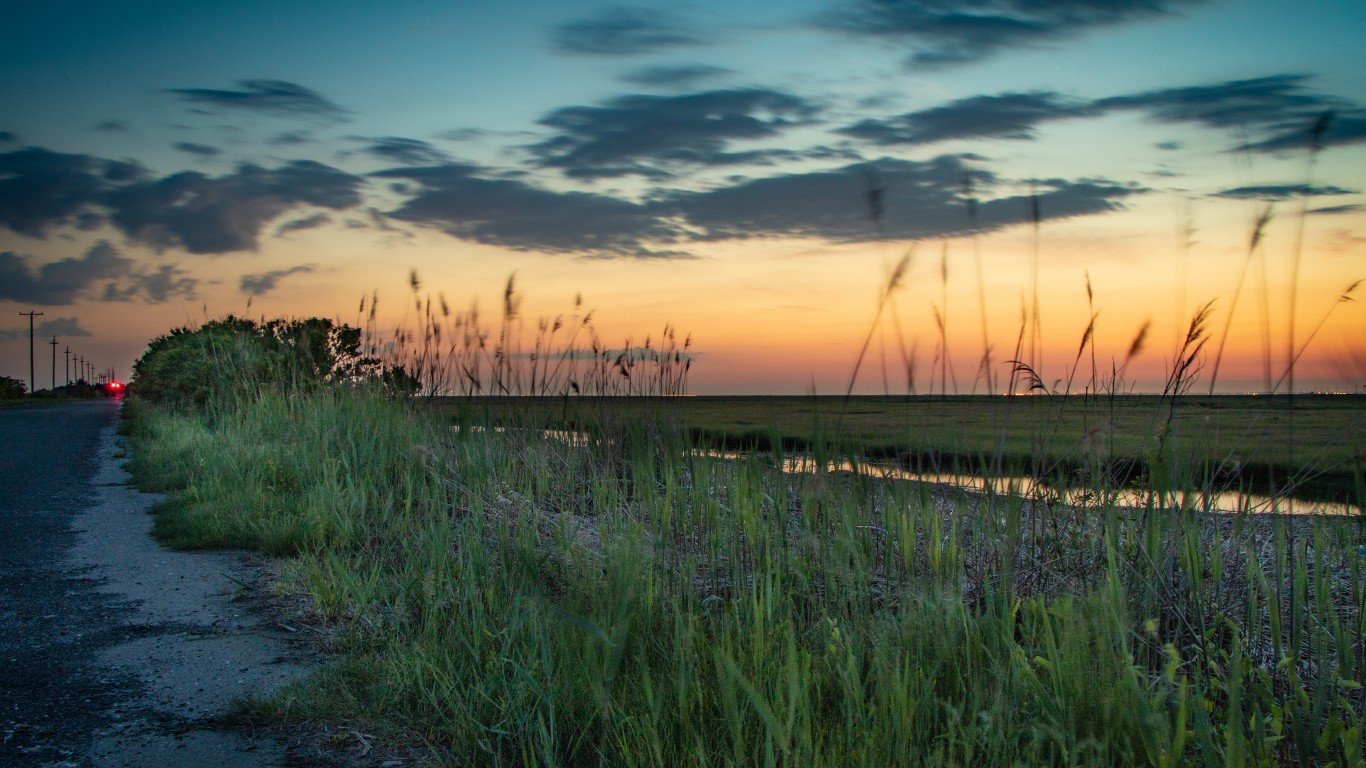
31. Louisiana
> Firearm background checks Jan-July 2022: 41.6 per 1,000 (194,208)
> Firearm background checks Jan-July 2021: 51.8 per 1,000 (21st fewest)
> Change in background checks, first seven months year-to-date: -47,309 (-19.6% — 23rd largest decrease)
> Population: 4,664,616 (25th largest)

30. Arkansas
> Firearm background checks Jan-July 2022: 43.1 per 1,000 (129,709)
> Firearm background checks Jan-July 2021: 57.8 per 1,000 (25th fewest)
> Change in background checks, first seven months year-to-date: -44,269 (-25.4% — 9th largest decrease)
> Population: 3,011,873 (18th smallest)
[in-text-ad]
29. Arizona
> Firearm background checks Jan-July 2022: 44.1 per 1,000 (316,018)
> Firearm background checks Jan-July 2021: 50.3 per 1,000 (19th fewest)
> Change in background checks, first seven months year-to-date: -44,906 (-12.4% — 5th smallest decrease)
> Population: 7,174,064 (14th largest)
[recirclink id=1152324]
28. Iowa
> Firearm background checks Jan-July 2022: 44.7 per 1,000 (140,667)
> Firearm background checks Jan-July 2021: 55.4 per 1,000 (23rd fewest)
> Change in background checks, first seven months year-to-date: -33,851 (-19.4% — 24th largest decrease)
> Population: 3,150,011 (20th smallest)

27. Michigan
> Firearm background checks Jan-July 2022: 46.2 per 1,000 (461,270)
> Firearm background checks Jan-July 2021: 61.2 per 1,000 (23rd most)
> Change in background checks, first seven months year-to-date: -148,759 (-24.4% — 11th largest decrease)
> Population: 9,973,907 (10th largest)
[in-text-ad-2]
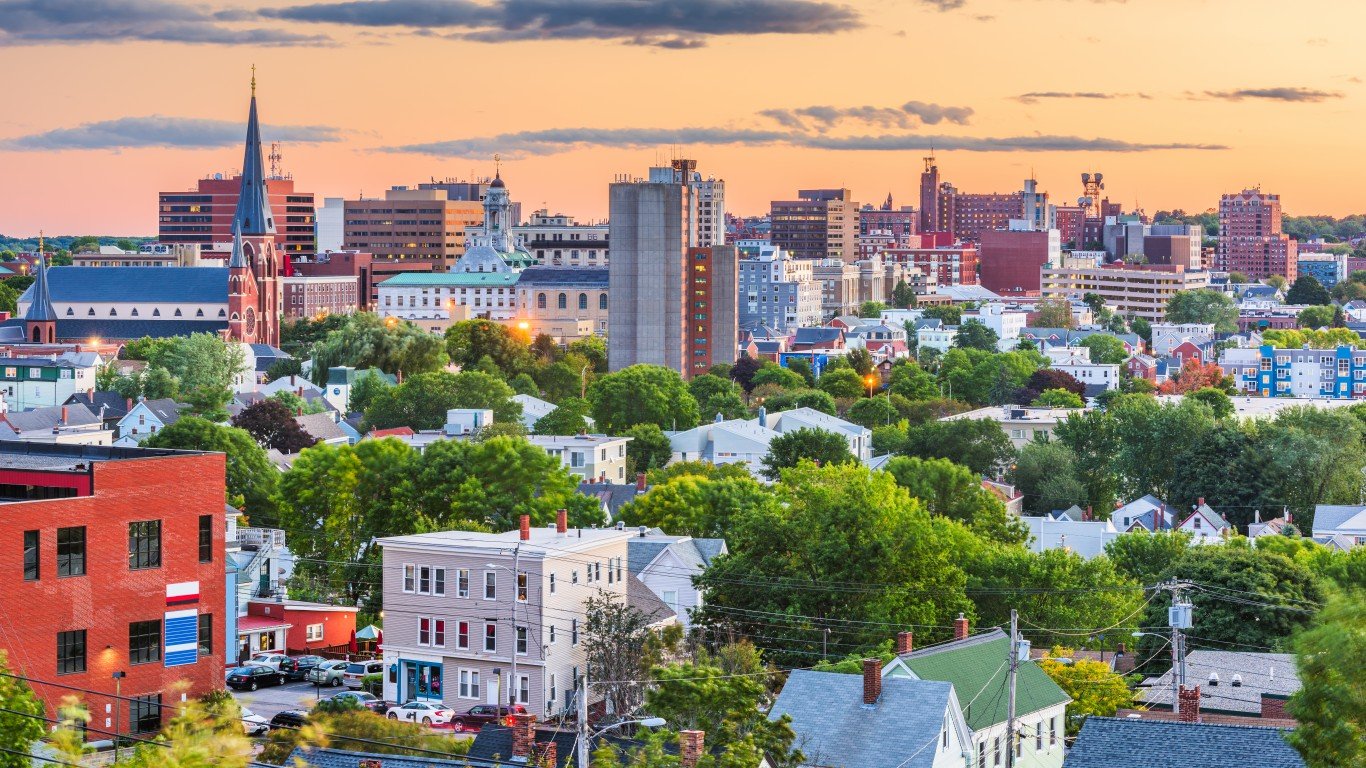
26. Maine
> Firearm background checks Jan-July 2022: 46.6 per 1,000 (62,506)
> Firearm background checks Jan-July 2021: 55.3 per 1,000 (22nd fewest)
> Change in background checks, first seven months year-to-date: -11,598 (-15.7% — 8th smallest decrease)
> Population: 1,340,825 (9th smallest)

25. South Carolina
> Firearm background checks Jan-July 2022: 47.1 per 1,000 (239,709)
> Firearm background checks Jan-July 2021: 58.9 per 1,000 (24th most)
> Change in background checks, first seven months year-to-date: -60,085 (-20.0% — 21st largest decrease)
> Population: 5,091,517 (23rd largest)
[in-text-ad]
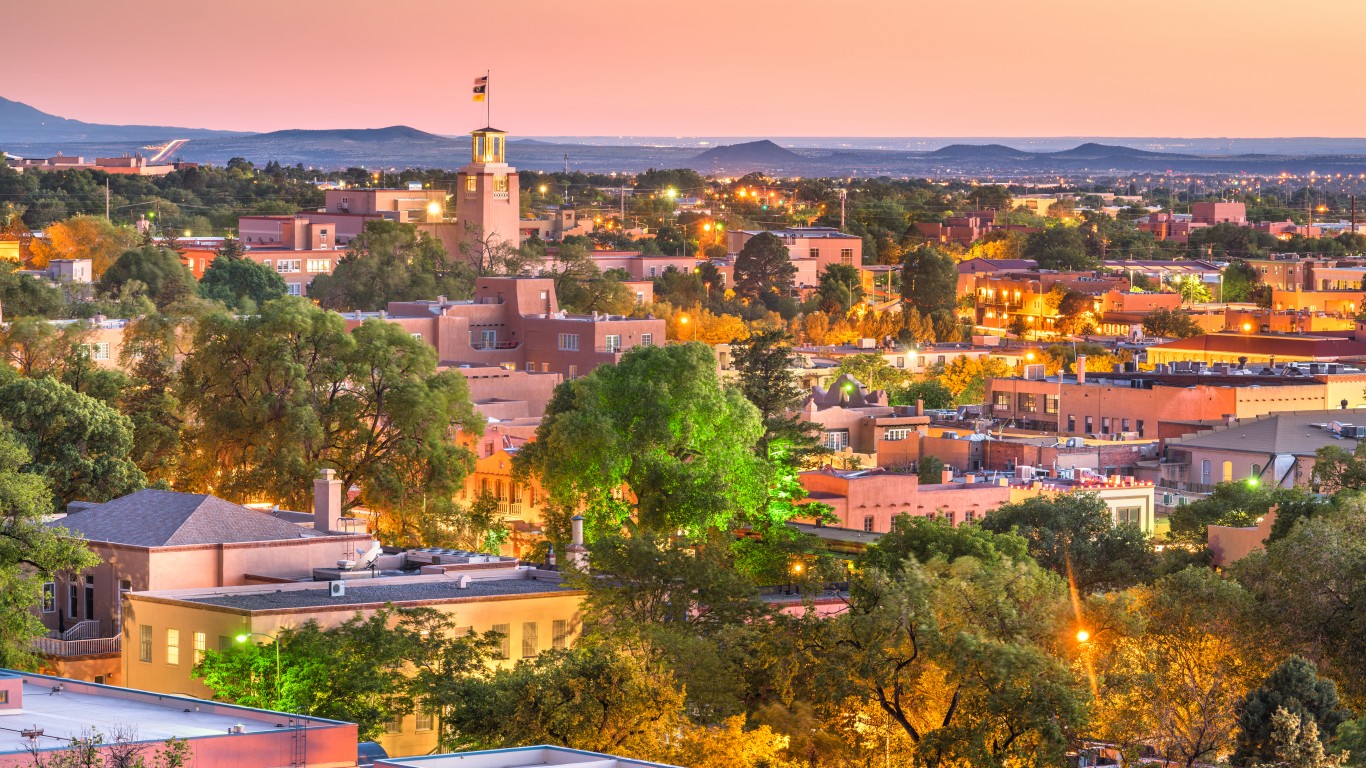
24. New Mexico
> Firearm background checks Jan-July 2022: 47.4 per 1,000 (99,349)
> Firearm background checks Jan-July 2021: 57.1 per 1,000 (24th fewest)
> Change in background checks, first seven months year-to-date: -20,407 (-17.0% — 12th smallest decrease)
> Population: 2,097,021 (15th smallest)
[recirclink id=1158416]
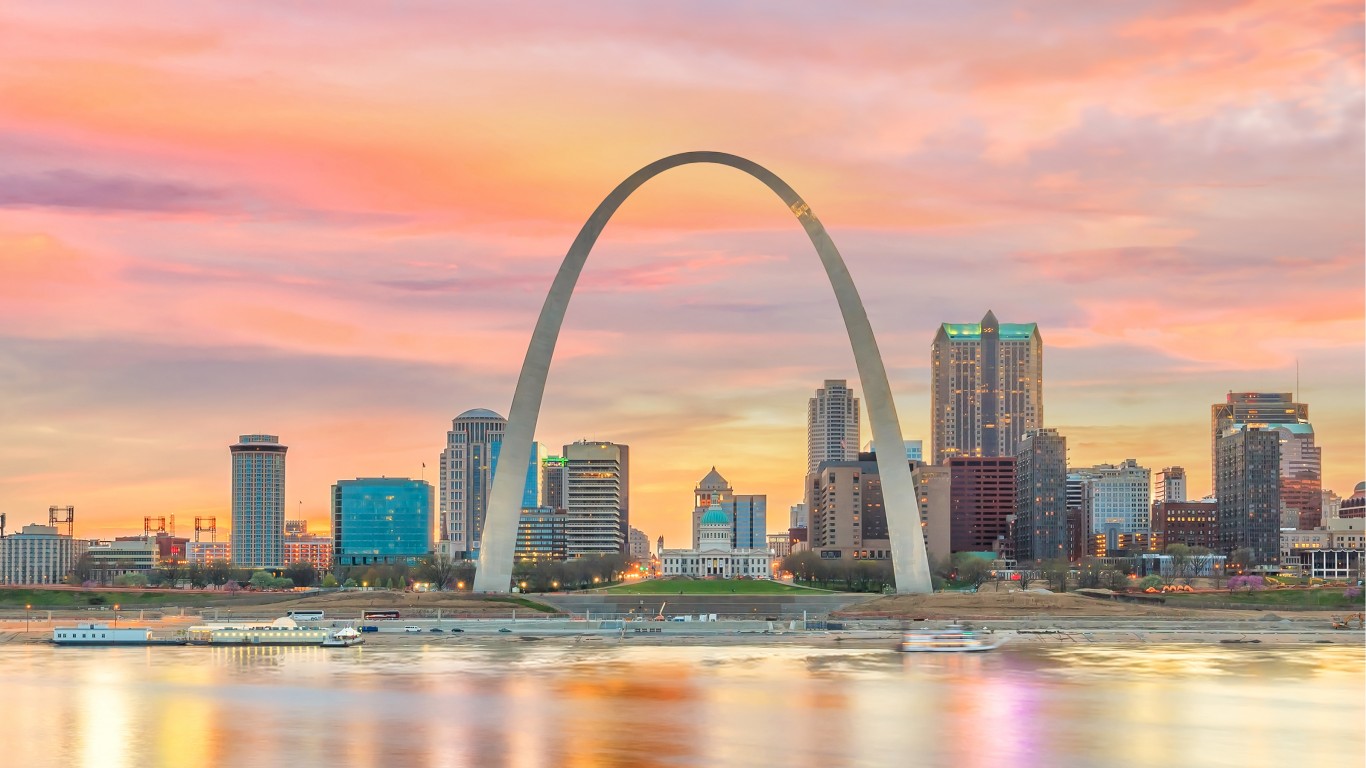
23. Missouri
> Firearm background checks Jan-July 2022: 49.1 per 1,000 (300,841)
> Firearm background checks Jan-July 2021: 63.4 per 1,000 (19th most)
> Change in background checks, first seven months year-to-date: -87,158 (-22.5% — 13th largest decrease)
> Population: 6,124,160 (18th largest)
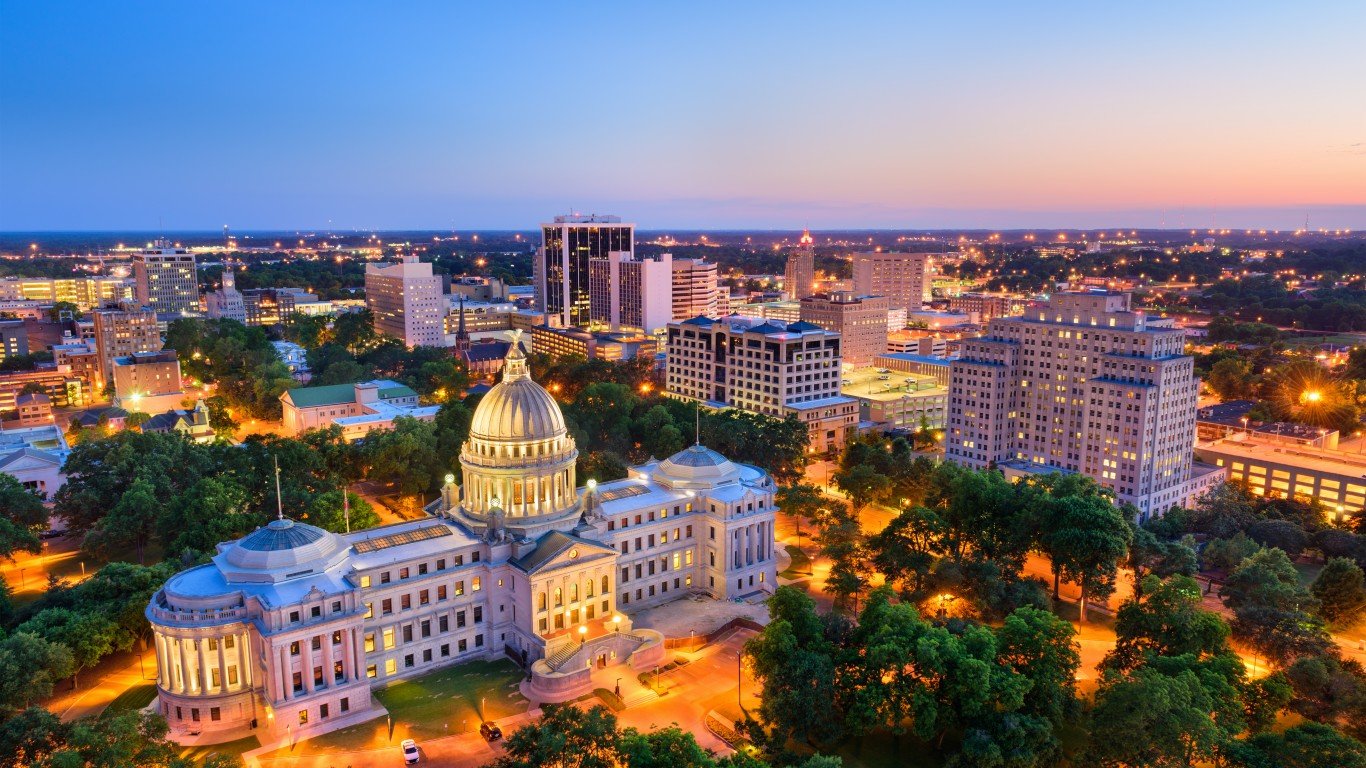
22. Mississippi
> Firearm background checks Jan-July 2022: 51.4 per 1,000 (153,309)
> Firearm background checks Jan-July 2021: 63.1 per 1,000 (21st most)
> Change in background checks, first seven months year-to-date: -34,749 (-18.5% — 18th smallest decrease)
> Population: 2,981,835 (17th smallest)
[in-text-ad-2]
21. Oklahoma
> Firearm background checks Jan-July 2022: 52.7 per 1,000 (208,191)
> Firearm background checks Jan-July 2021: 63.2 per 1,000 (20th most)
> Change in background checks, first seven months year-to-date: -41,317 (-16.6% — 11th smallest decrease)
> Population: 3,949,342 (23rd smallest)

20. Colorado
> Firearm background checks Jan-July 2022: 54.1 per 1,000 (307,624)
> Firearm background checks Jan-July 2021: 67.9 per 1,000 (16th most)
> Change in background checks, first seven months year-to-date: -78,414 (-20.3% — 20th largest decrease)
> Population: 5,684,926 (21st largest)
[in-text-ad]

19. North Dakota
> Firearm background checks Jan-July 2022: 54.4 per 1,000 (41,349)
> Firearm background checks Jan-July 2021: 62.9 per 1,000 (22nd most)
> Change in background checks, first seven months year-to-date: -6,507 (-13.6% — 6th smallest decrease)
> Population: 760,394 (4th smallest)
[recirclink id=1157167]

18. South Dakota
> Firearm background checks Jan-July 2022: 54.6 per 1,000 (48,008)
> Firearm background checks Jan-July 2021: 72.5 per 1,000 (14th most)
> Change in background checks, first seven months year-to-date: -15,709 (-24.7% — 10th largest decrease)
> Population: 879,336 (5th smallest)

17. Oregon
> Firearm background checks Jan-July 2022: 55.5 per 1,000 (231,636)
> Firearm background checks Jan-July 2021: 65.9 per 1,000 (18th most)
> Change in background checks, first seven months year-to-date: -43,553 (-15.8% — 10th smallest decrease)
> Population: 4,176,346 (24th smallest)
[in-text-ad-2]

16. Pennsylvania
> Firearm background checks Jan-July 2022: 55.8 per 1,000 (713,491)
> Firearm background checks Jan-July 2021: 67.5 per 1,000 (17th most)
> Change in background checks, first seven months year-to-date: -150,423 (-17.4% — 14th smallest decrease)
> Population: 12,794,885 (5th largest)
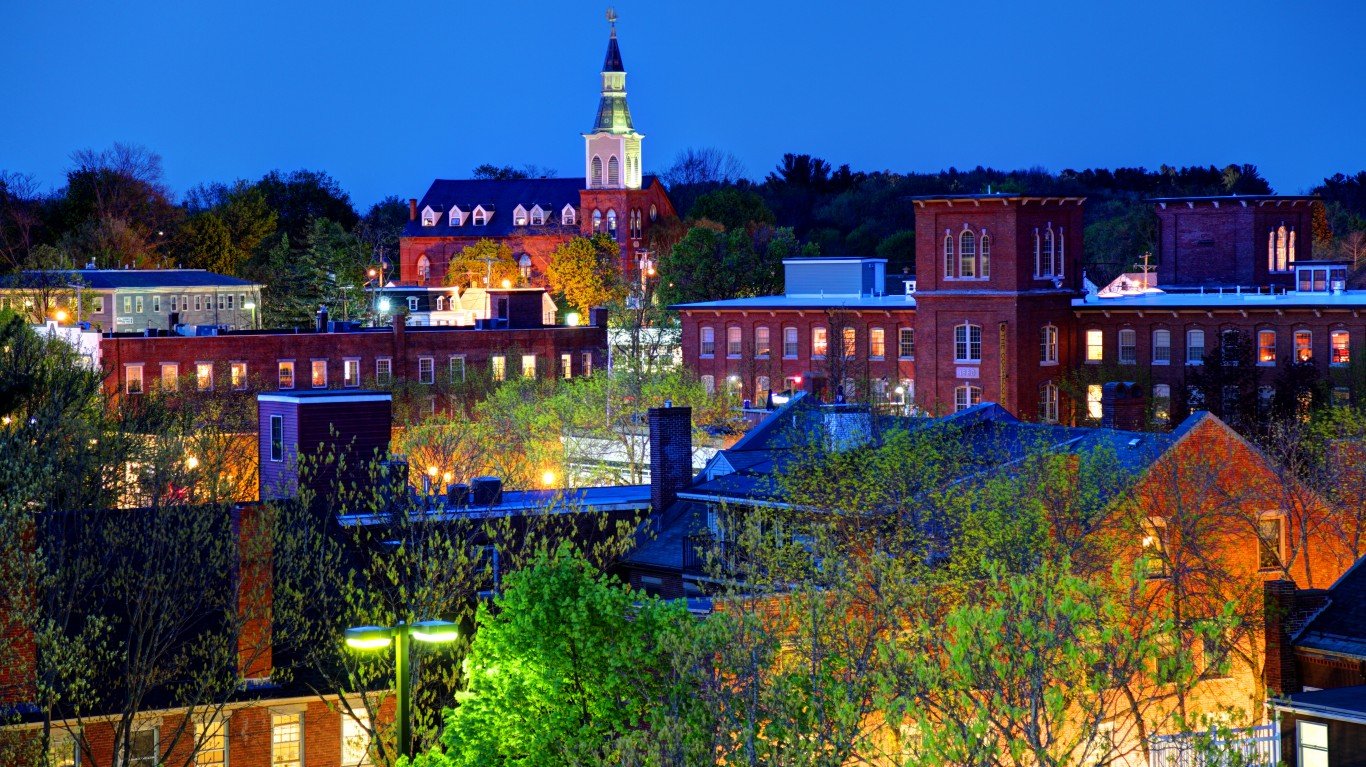
15. New Hampshire
> Firearm background checks Jan-July 2022: 56.4 per 1,000 (76,431)
> Firearm background checks Jan-July 2021: 69.9 per 1,000 (15th most)
> Change in background checks, first seven months year-to-date: -18,296 (-19.3% — 23rd smallest decrease)
> Population: 1,355,244 (10th smallest)
[in-text-ad]
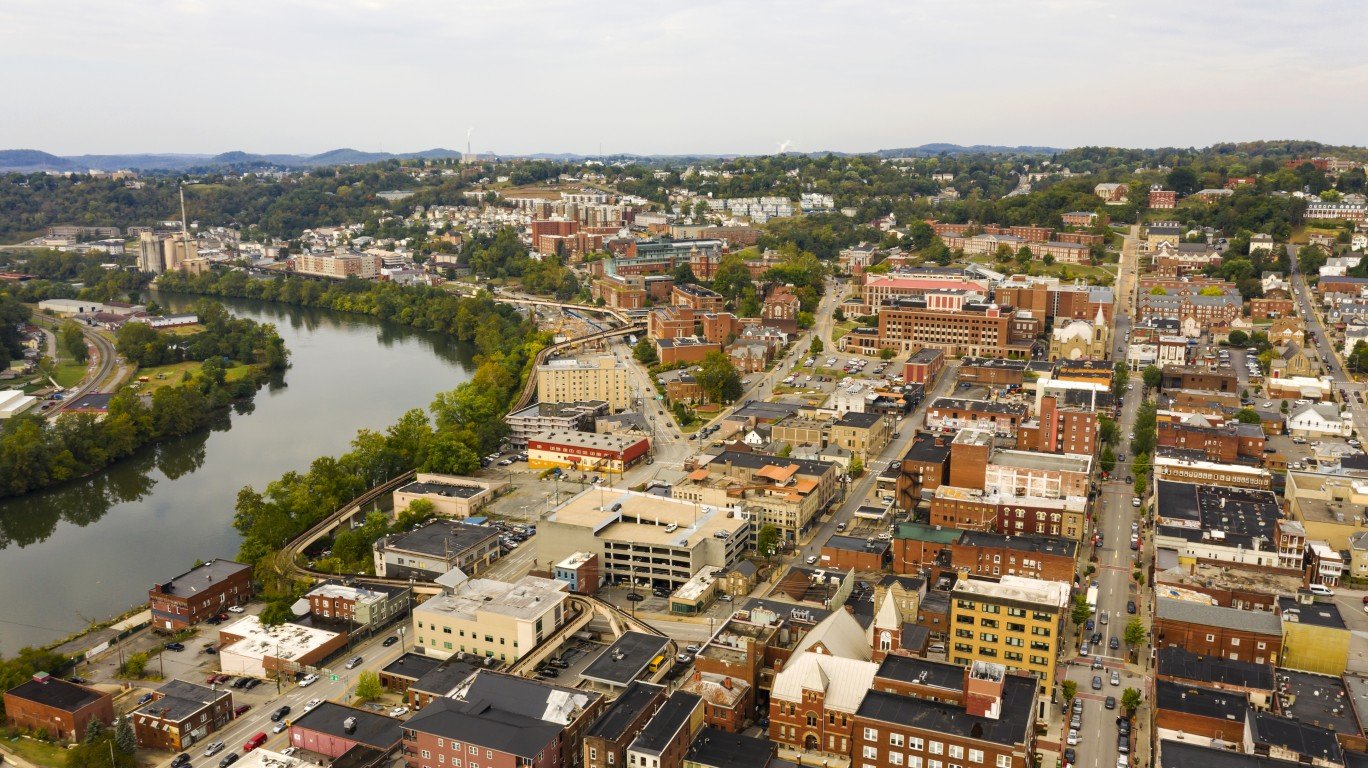
14. West Virginia
> Firearm background checks Jan-July 2022: 58.8 per 1,000 (106,284)
> Firearm background checks Jan-July 2021: 74.3 per 1,000 (13th most)
> Change in background checks, first seven months year-to-date: -27,947 (-20.8% — 15th largest decrease)
> Population: 1,807,426 (13th smallest)
[recirclink id=1153671]

13. Washington
> Firearm background checks Jan-July 2022: 60.7 per 1,000 (455,979)
> Firearm background checks Jan-July 2021: 58.3 per 1,000 (25th most)
> Change in background checks, first seven months year-to-date: +17,636 (+4.0% — 3rd largest increase)
> Population: 7,512,465 (13th largest)
12. Wisconsin
> Firearm background checks Jan-July 2022: 62.4 per 1,000 (362,292)
> Firearm background checks Jan-July 2021: 78.4 per 1,000 (11th most)
> Change in background checks, first seven months year-to-date: -93,145 (-20.5% — 18th largest decrease)
> Population: 5,806,975 (20th largest)
[in-text-ad-2]
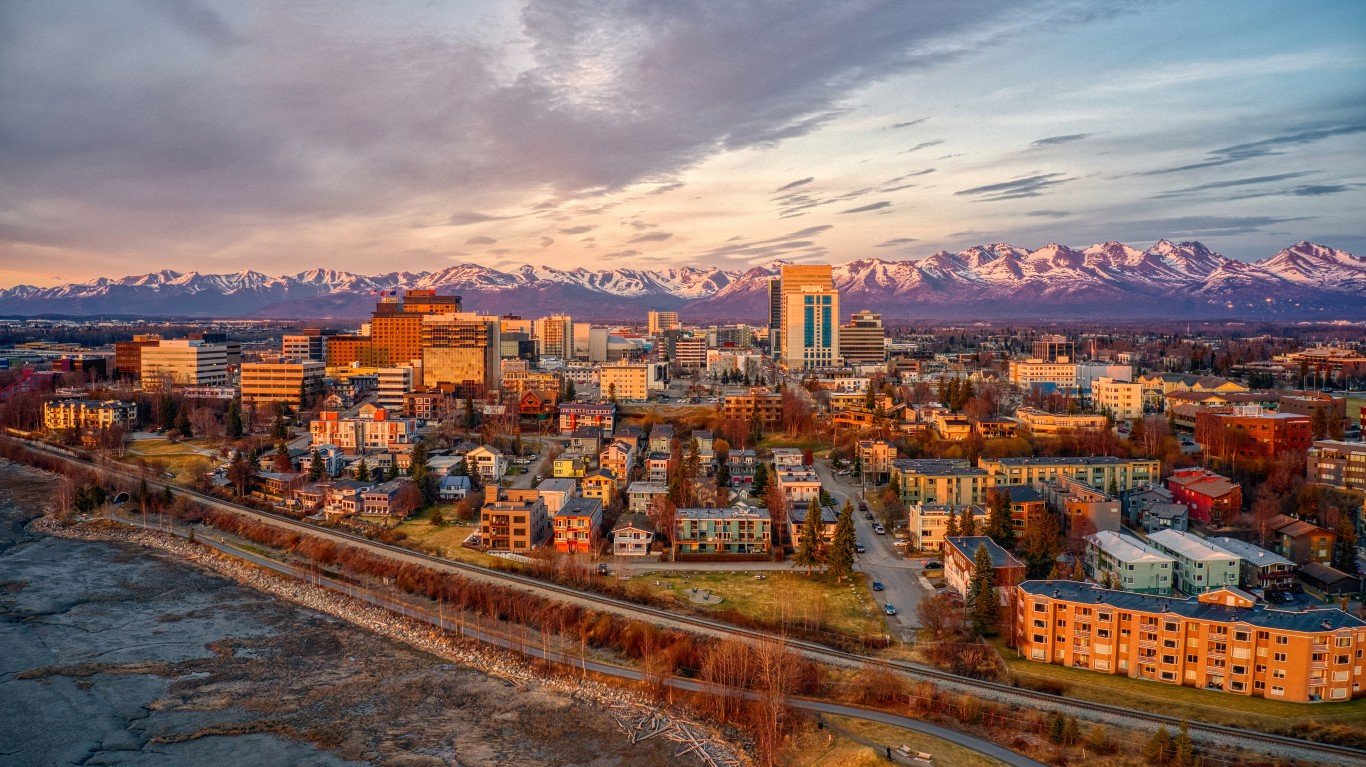
11. Alaska
> Firearm background checks Jan-July 2022: 62.9 per 1,000 (46,391)
> Firearm background checks Jan-July 2021: 74.8 per 1,000 (12th most)
> Change in background checks, first seven months year-to-date: -8,722 (-15.8% — 9th smallest decrease)
> Population: 736,990 (3rd smallest)
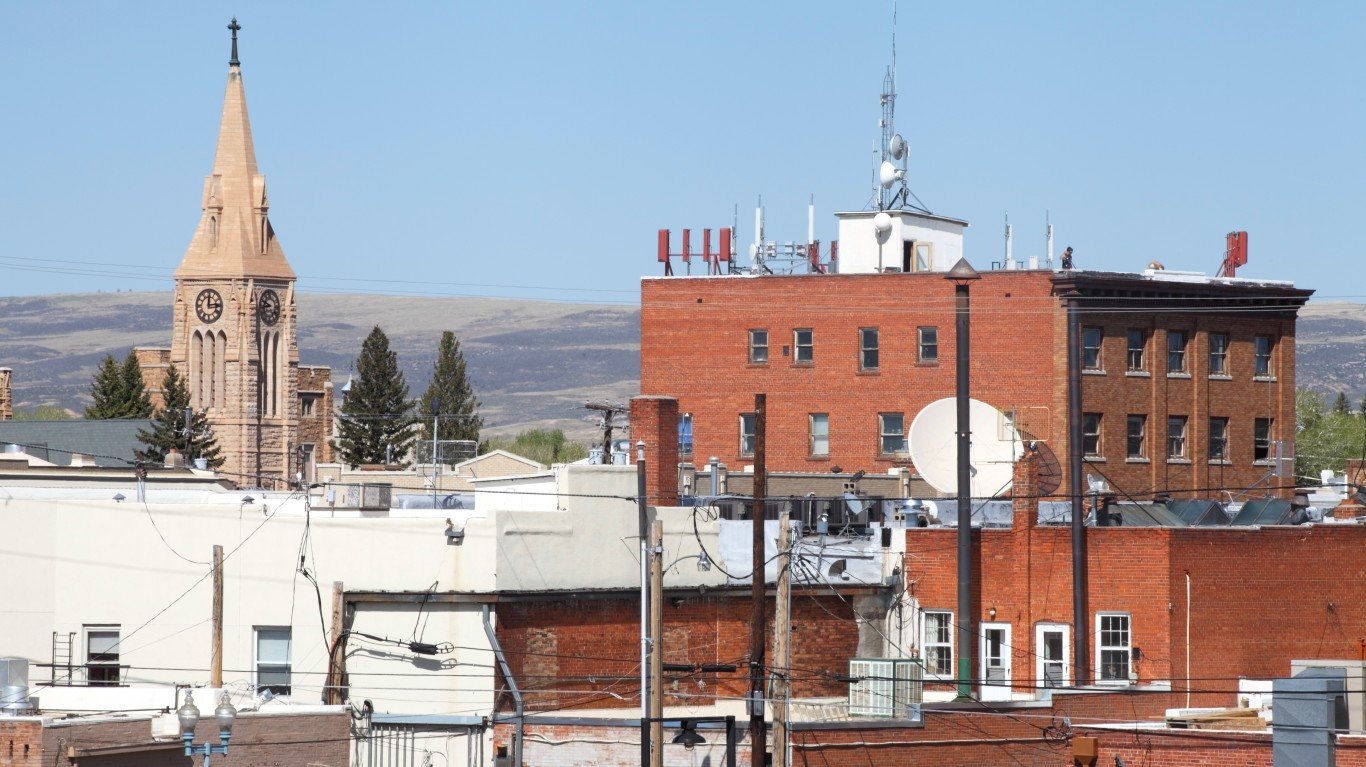
10. Wyoming
> Firearm background checks Jan-July 2022: 69.5 per 1,000 (40,392)
> Firearm background checks Jan-July 2021: 87.6 per 1,000 (9th most)
> Change in background checks, first seven months year-to-date: -10,515 (-20.7% — 16th largest decrease)
> Population: 581,348 (the smallest)
[in-text-ad]

9. Tennessee
> Firearm background checks Jan-July 2022: 71.4 per 1,000 (483,652)
> Firearm background checks Jan-July 2021: 87.2 per 1,000 (10th most)
> Change in background checks, first seven months year-to-date: -106,845 (-18.1% — 17th smallest decrease)
> Population: 6,772,268 (16th largest)
[recirclink id=1153569]
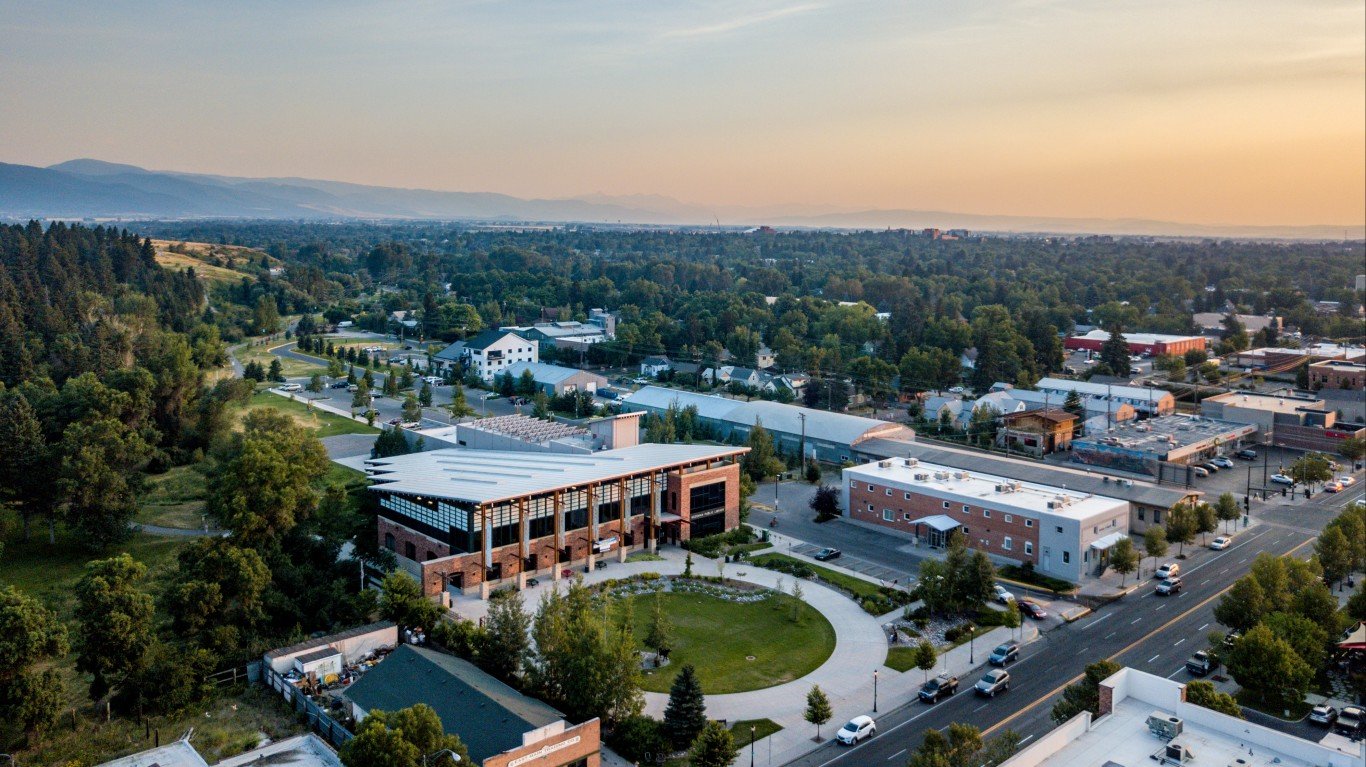
8. Montana
> Firearm background checks Jan-July 2022: 76.4 per 1,000 (81,120)
> Firearm background checks Jan-July 2021: 89.8 per 1,000 (8th most)
> Change in background checks, first seven months year-to-date: -14,227 (-14.9% — 7th smallest decrease)
> Population: 1,061,705 (8th smallest)
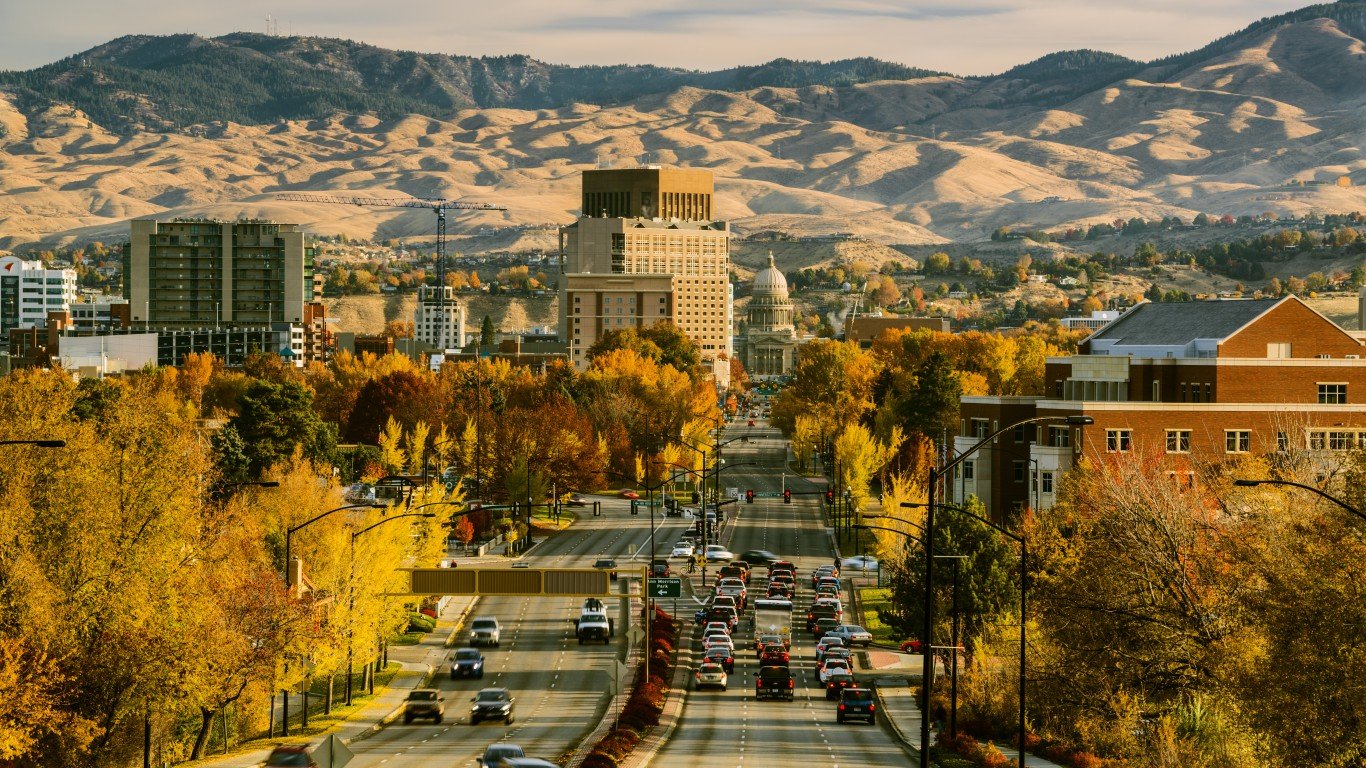
7. Idaho
> Firearm background checks Jan-July 2022: 78.6 per 1,000 (137,864)
> Firearm background checks Jan-July 2021: 95.5 per 1,000 (7th most)
> Change in background checks, first seven months year-to-date: -29,608 (-17.7% — 15th smallest decrease)
> Population: 1,754,367 (12th smallest)
[in-text-ad-2]
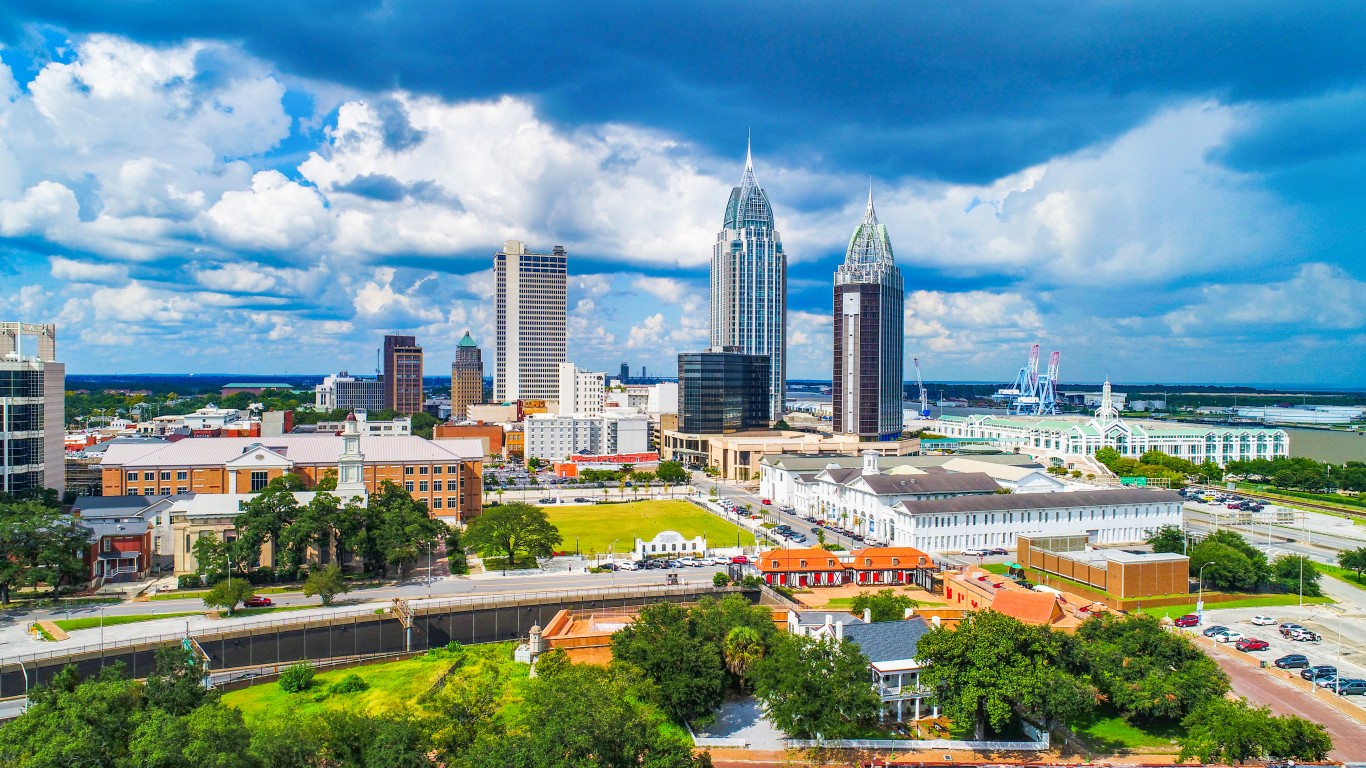
6. Alabama
> Firearm background checks Jan-July 2022: 87.6 per 1,000 (428,403)
> Firearm background checks Jan-July 2021: 118.8 per 1,000 (5th most)
> Change in background checks, first seven months year-to-date: -152,887 (-26.3% — 8th largest decrease)
> Population: 4,893,186 (24th largest)

5. Minnesota
> Firearm background checks Jan-July 2022: 93.7 per 1,000 (524,882)
> Firearm background checks Jan-July 2021: 101.6 per 1,000 (6th most)
> Change in background checks, first seven months year-to-date: -43,970 (-7.7% — 2nd smallest decrease)
> Population: 5,600,166 (22nd largest)
[in-text-ad]
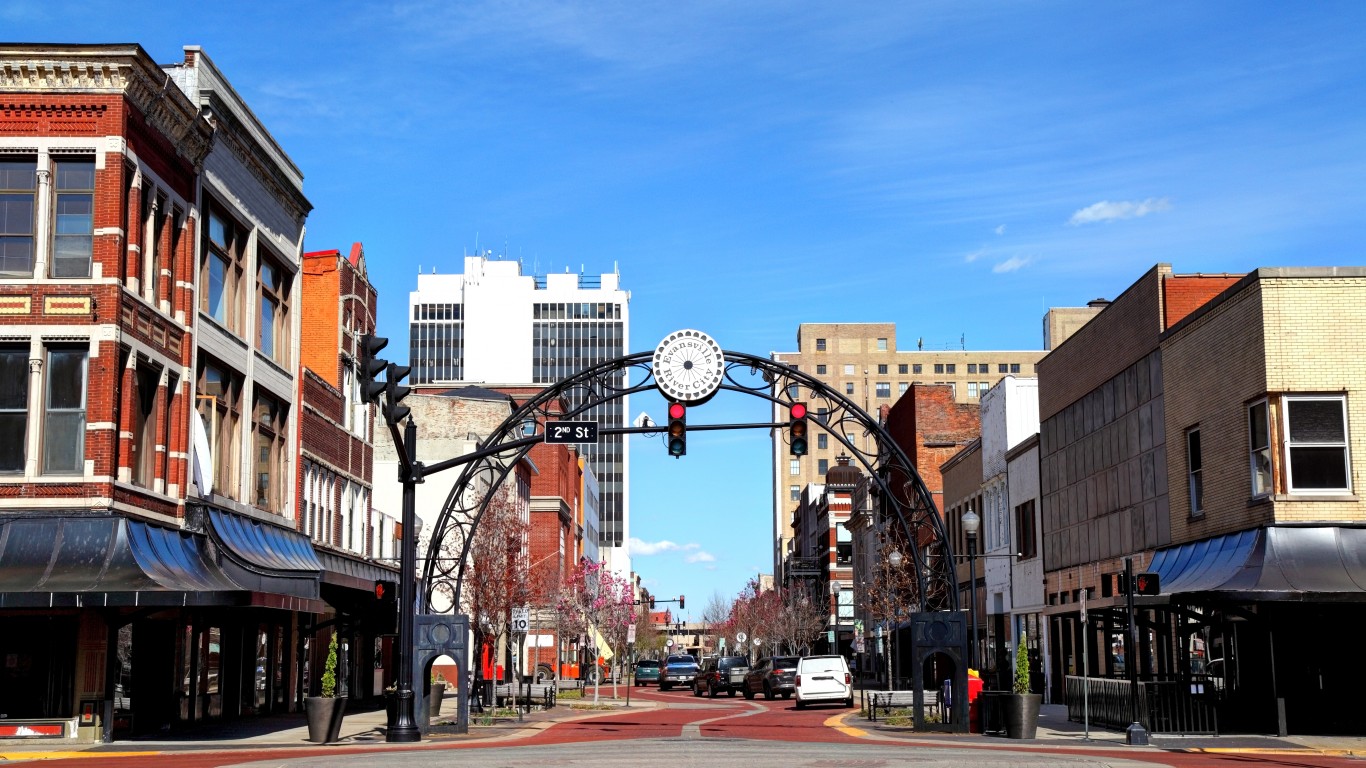
4. Indiana
> Firearm background checks Jan-July 2022: 105.8 per 1,000 (708,359)
> Firearm background checks Jan-July 2021: 185.8 per 1,000 (4th most)
> Change in background checks, first seven months year-to-date: -535,707 (-43.1% — 2nd largest decrease)
> Population: 6,696,893 (17th largest)
[recirclink id=1152324]

3. Utah
> Firearm background checks Jan-July 2022: 188.0 per 1,000 (592,276)
> Firearm background checks Jan-July 2021: 232.9 per 1,000 (3rd most)
> Change in background checks, first seven months year-to-date: -141,514 (-19.3% — 22nd smallest decrease)
> Population: 3,151,239 (21st smallest)

2. Illinois
> Firearm background checks Jan-July 2022: 188.1 per 1,000 (2,391,483)
> Firearm background checks Jan-July 2021: 527.5 per 1,000 (the most)
> Change in background checks, first seven months year-to-date: -4,315,999 (-64.3% — the largest decrease)
> Population: 12,716,164 (6th largest)
[in-text-ad-2]

1. Kentucky
> Firearm background checks Jan-July 2022: 542.3 per 1,000 (2,419,871)
> Firearm background checks Jan-July 2021: 444.7 per 1,000 (2nd most)
> Change in background checks, first seven months year-to-date: +435,483 (+21.9% — the largest increase)
> Population: 4,461,952 (25th smallest)
Contact [email protected] for any questions or corrections.