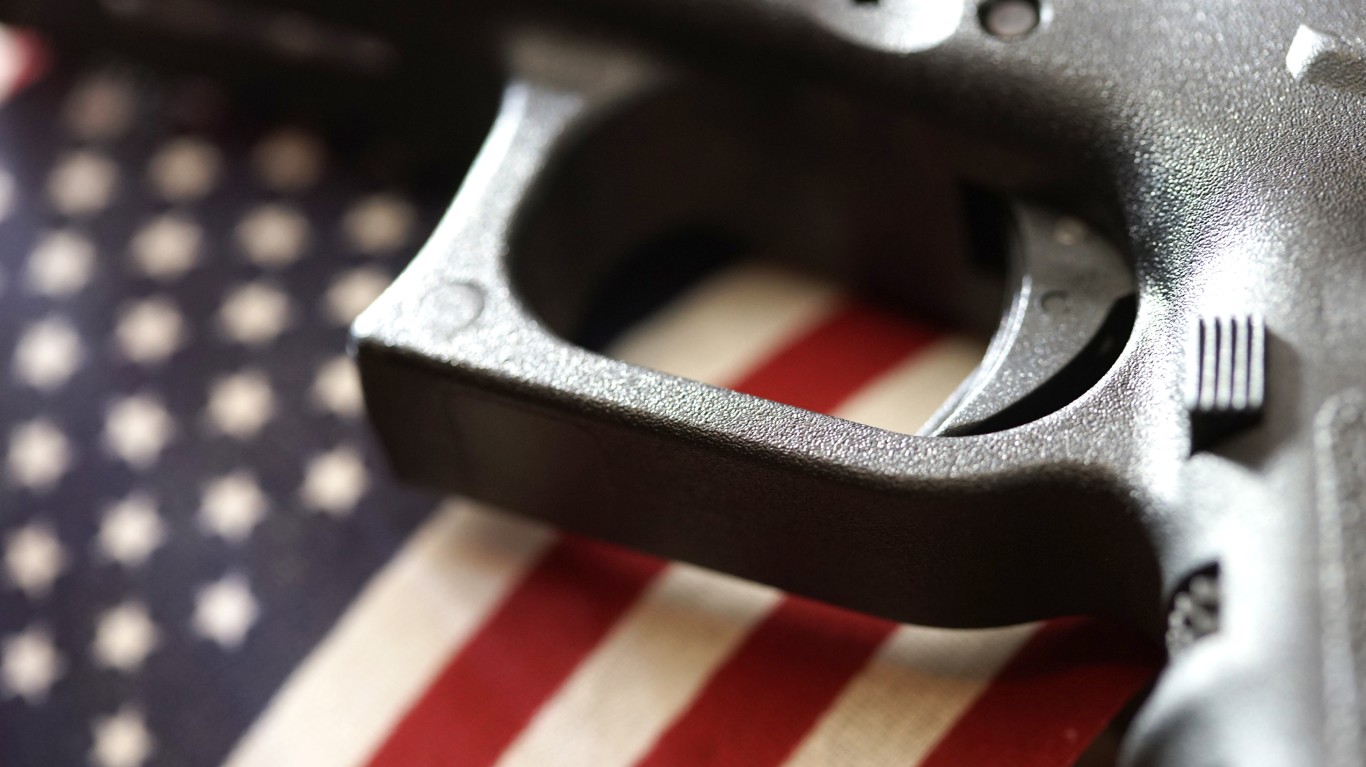
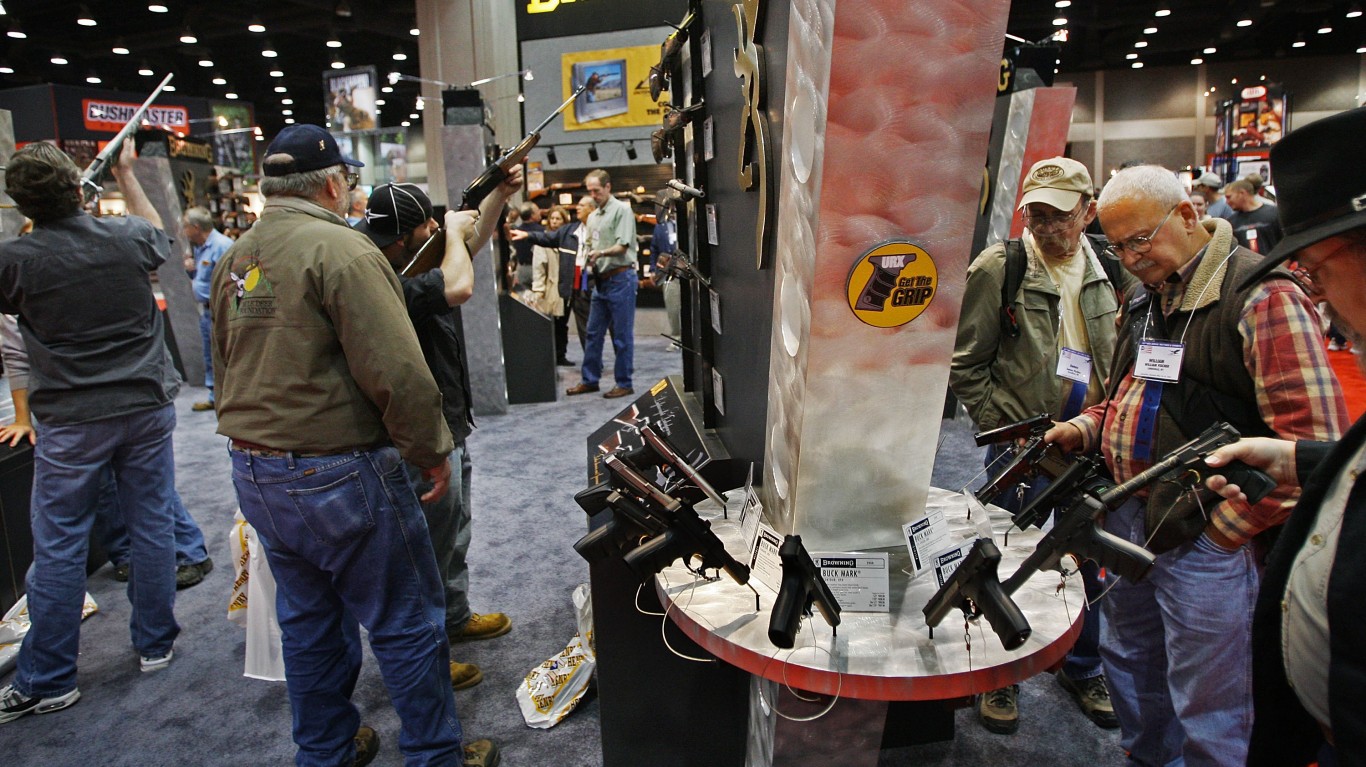
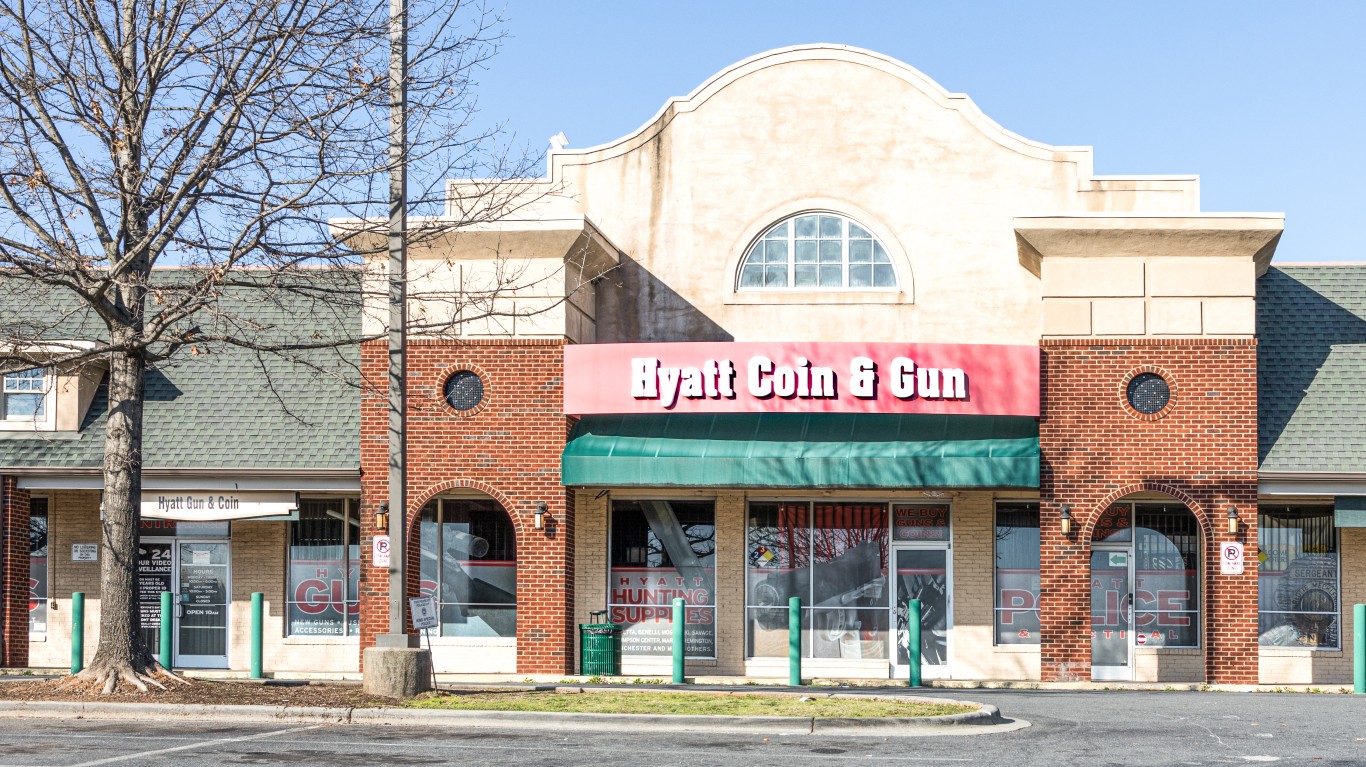
President Joe Biden signed on Tuesday a new executive order intended to increase the likelihood a background check is conducted before the sale of guns in the United States. Though many polls show that the vast majority of Americans support universal background checks, Biden’s order does not go that far but directs the attorney general to make sure gun dealers are complying with existing background check laws. The White House said the order would move “the U.S. as close to universal background checks as possible without additional legislation.”
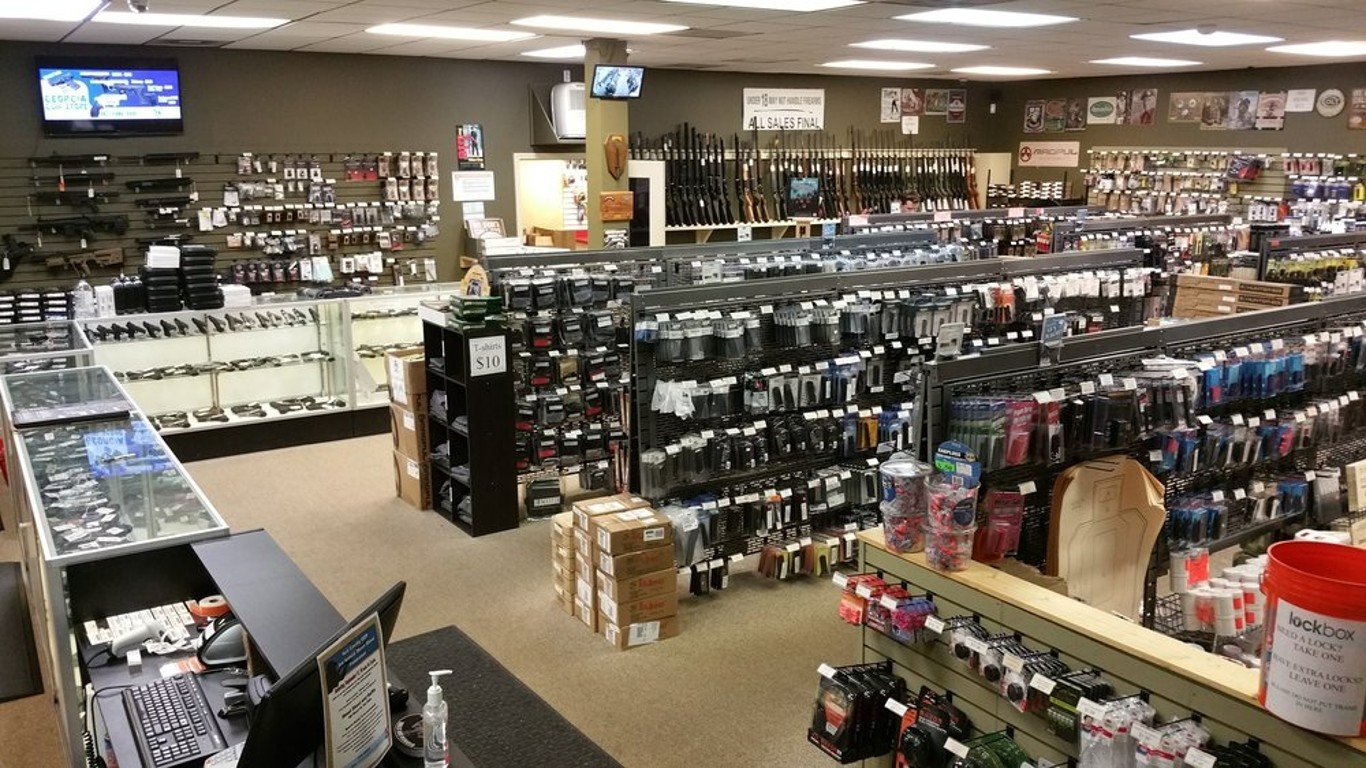
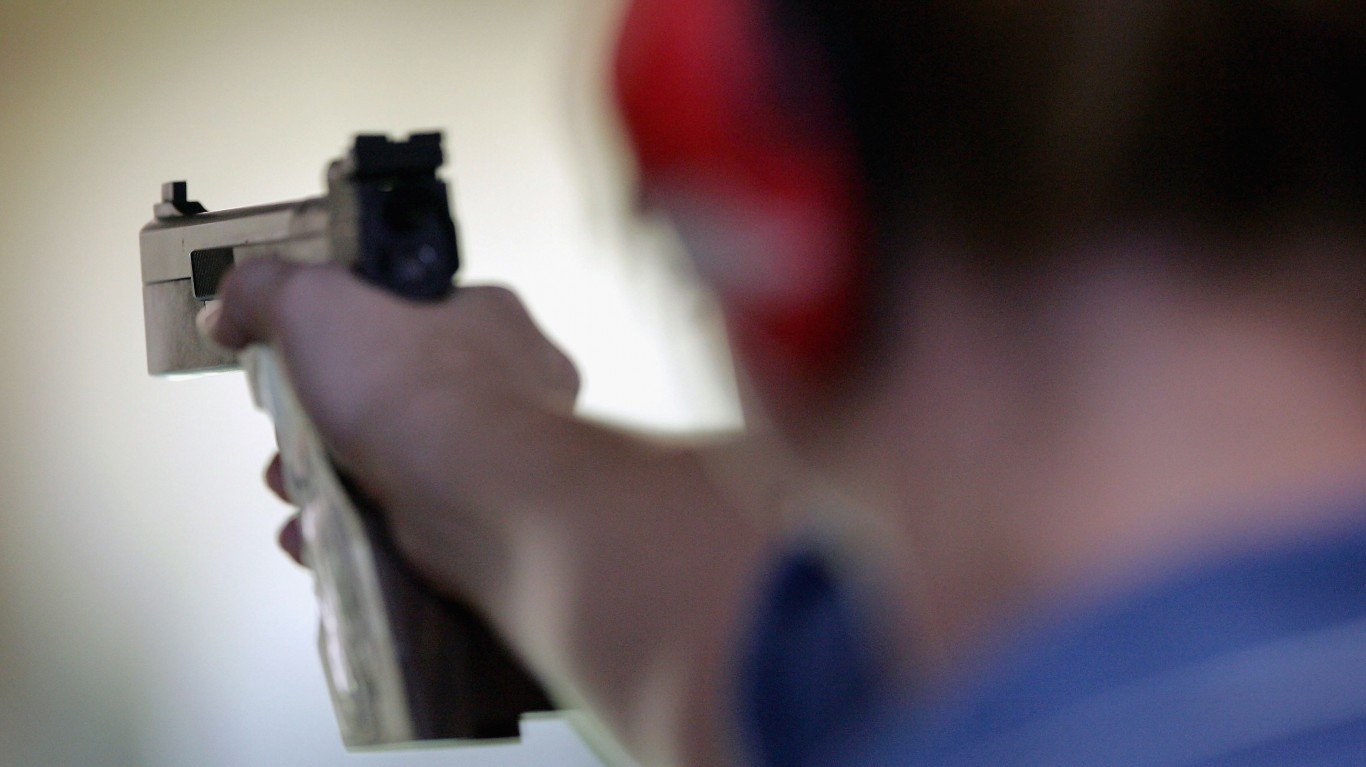
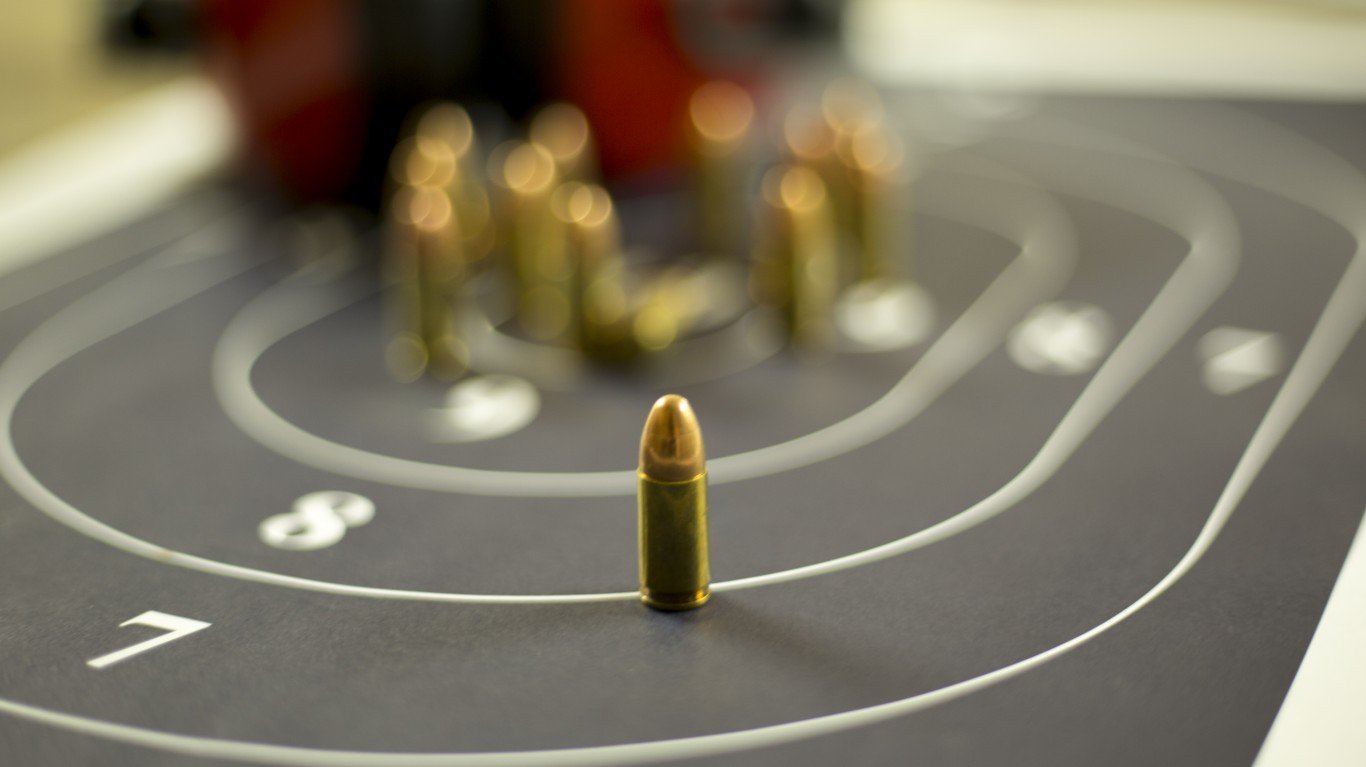
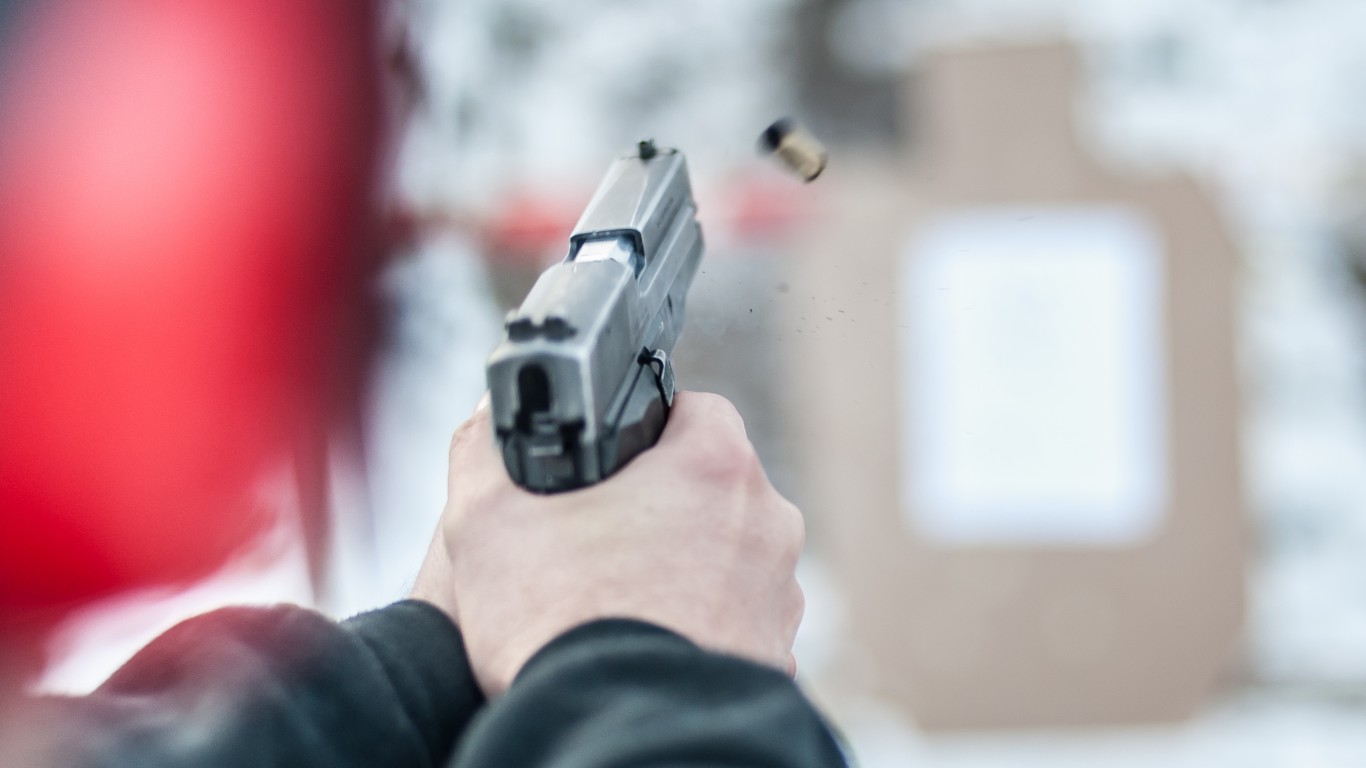
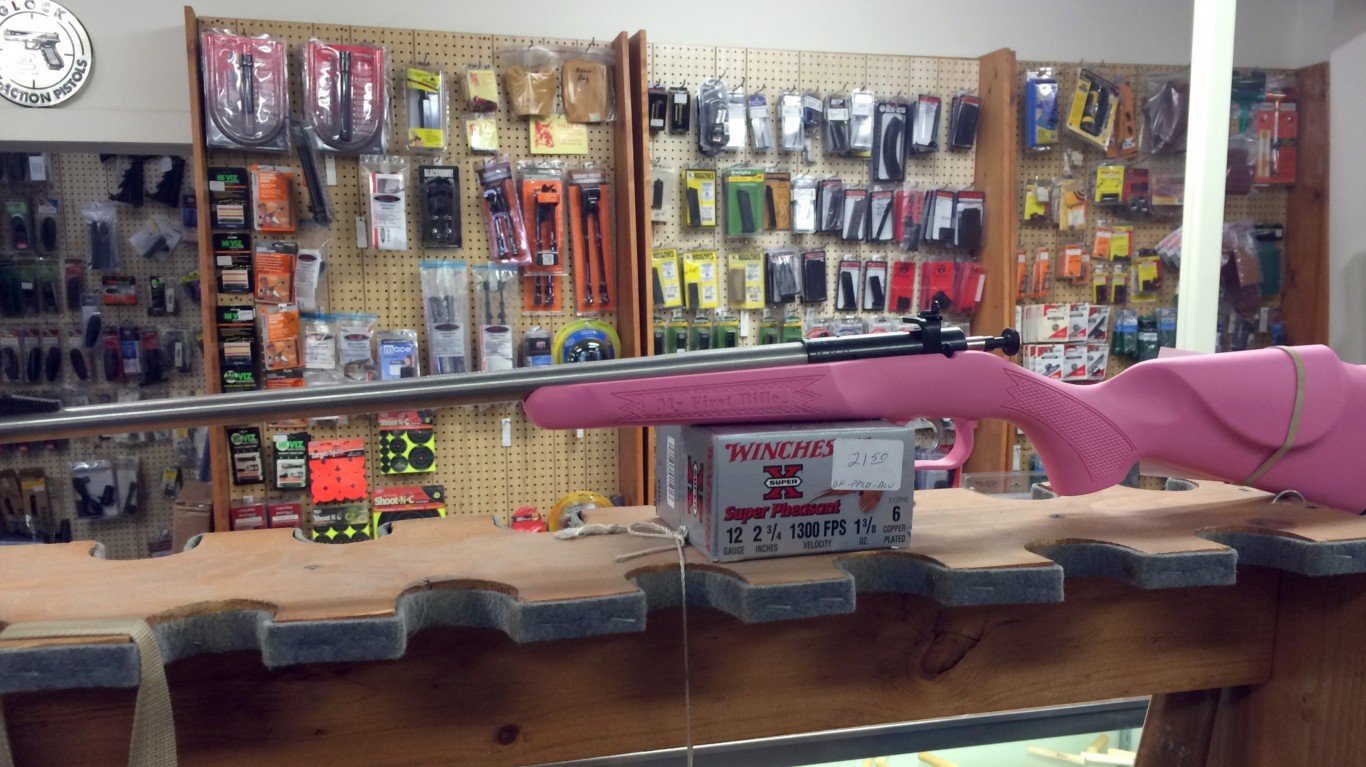
Last month, about 2.5 million firearm background checks were conducted in the United States, according to data compiled by the FBI. That figure represents a slight decline compared to January, when 2.6 million checks were conducted but is in line with the number of checks conducted in February 2022. Background checks are often used to approximate the level of gun sales. However, background checks can also be initiated for reasons that are not tied to gun sales, including rentals and pawn shop transactions. (Also see, guns with the most online sales in 2022.)
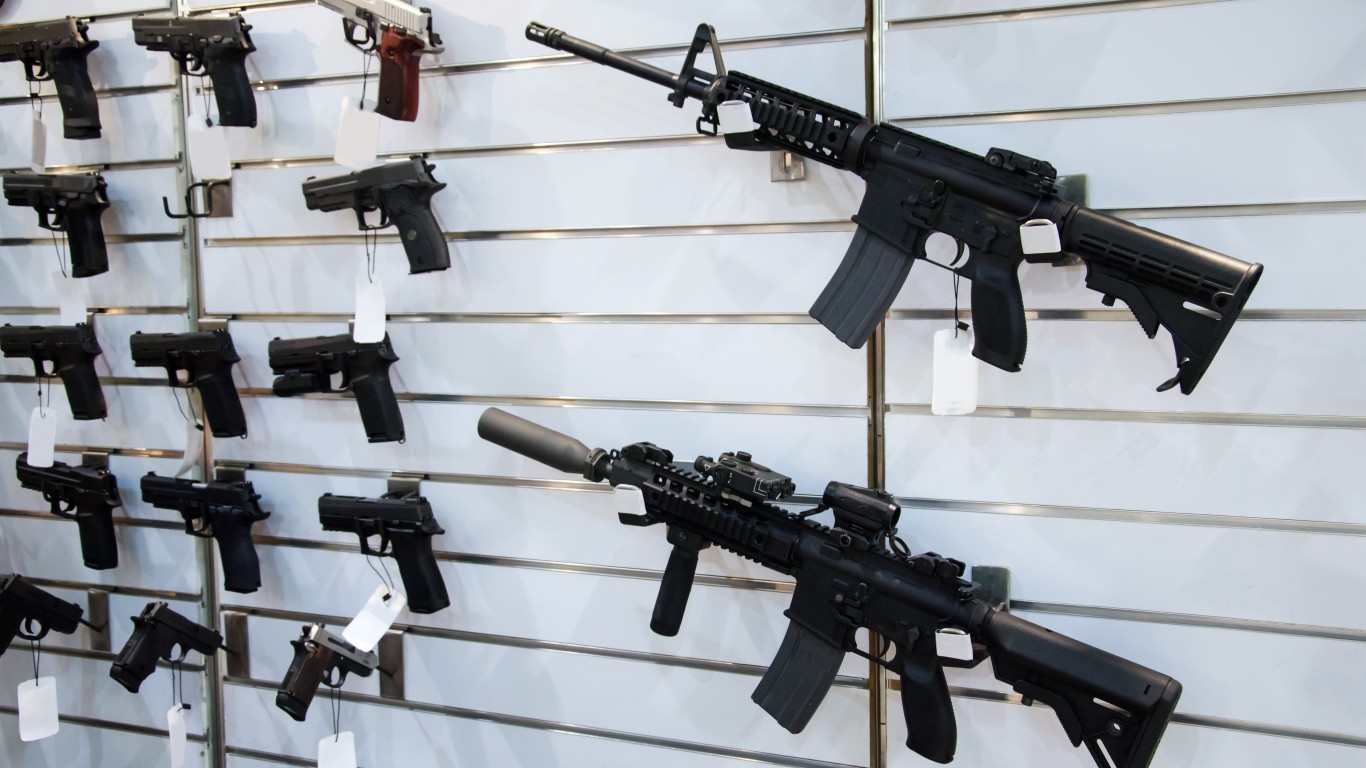
To identify the states where gun sales are decreasing fastest, 24/7 Wall St. used FBI data from its National Instant Criminal Background Check System, looking at the 20 states with the largest percentage decrease in adjusted-firearm background checks in February 2023 compared to February 2022. To reach a closer approximation of gun sales, we excluded categories of checks such as for pawn shop transactions, returns, rentals, and rechecks (which are conducted periodically by some states on existing permit holders).
Even after removing some types of checks that are clearly unrelated to a new firearm purchase, because every state has different background checks laws and accounting practices, background checks still serve only as a rough approximation.
The states with the highest reported decreases in background checks in February compared to the same period in 2022 include both states that tend to rank relatively low each month in checks per capita and those that rank among the highest.
For example, Alabama, which had the largest decrease in background checks, at 24.0%, had the third most adjusted background checks per capita in February at 9.7 per 1,000 residents. Conversely Delaware, which had the fourth largest decline in background checks, at 15.2%, had the 10th fewest adjusted background checks per capita in February at 4.1 per 1,000 residents. (These are the states where the most people bought guns last month.)
Click here to see the states where gun sales are decreasing the most.
Click here to read our detailed methodology.

20. Montana
> Change in background checks, Feb 2022- Feb 2023: -2.5% (-243 — 3rd smallest decrease)
> Firearm background checks, Feb 2023: 9,650 — 11th fewest
> Firearm background checks, Feb 2022: 9,893 — 11th fewest
> Firearm background checks per 1,000 residents, Feb 2023: 8.6 — 7th most
> Firearm background checks per 1,000 residents, Feb 2022: 8.8 — 6th most
> Most common type of firearm check, Feb 2023: Handguns
> 2022 Population: 1,122,867 — 8th smallest
[in-text-ad]
19. Kansas
> Change in background checks, Feb 2022- Feb 2023: -2.9% (-463 — 9th smallest decrease)
> Firearm background checks, Feb 2023: 15,349 — 17th fewest
> Firearm background checks, Feb 2022: 15,812 — 18th fewest
> Firearm background checks per 1,000 residents, Feb 2023: 5.2 — 19th fewest
> Firearm background checks per 1,000 residents, Feb 2022: 5.4 — 20th fewest
> Most common type of firearm check, Feb 2023: Handguns
> 2022 Population: 2,937,150 — 16th smallest
[recirclink id=1204832]

18. Florida
> Change in background checks, Feb 2022- Feb 2023: -3.2% (-3,659 — 5th largest decrease)
> Firearm background checks, Feb 2023: 111,089 — 2nd most
> Firearm background checks, Feb 2022: 114,748 — 2nd most
> Firearm background checks per 1,000 residents, Feb 2023: 5.0 — 16th fewest
> Firearm background checks per 1,000 residents, Feb 2022: 5.2 — 18th fewest
> Most common type of firearm check, Feb 2023: Handguns
> 2022 Population: 22,244,823 — 3rd largest

17. Rhode Island
> Change in background checks, Feb 2022- Feb 2023: -3.3% (-80 — the smallest decrease)
> Firearm background checks, Feb 2023: 2,335 — 2nd fewest
> Firearm background checks, Feb 2022: 2,415 — 2nd fewest
> Firearm background checks per 1,000 residents, Feb 2023: 2.1 — 4th fewest
> Firearm background checks per 1,000 residents, Feb 2022: 2.2 — 4th fewest
> Most common type of firearm check, Feb 2023: Handguns
> 2022 Population: 1,093,734 — 7th smallest
[in-text-ad-2]
16. Kentucky
> Change in background checks, Feb 2022- Feb 2023: -4.7% (-1,195 — 13th largest decrease)
> Firearm background checks, Feb 2023: 23,985 — 25th most
> Firearm background checks, Feb 2022: 25,180 — 25th most
> Firearm background checks per 1,000 residents, Feb 2023: 5.3 — 21st fewest
> Firearm background checks per 1,000 residents, Feb 2022: 5.6 — 23rd fewest
> Most common type of firearm check, Feb 2023: Handguns
> 2022 Population: 4,512,310 — 25th smallest
15. Wisconsin
> Change in background checks, Feb 2022- Feb 2023: -4.8% (-2,554 — 7th largest decrease)
> Firearm background checks, Feb 2023: 50,901 — 10th most
> Firearm background checks, Feb 2022: 53,455 — 10th most
> Firearm background checks per 1,000 residents, Feb 2023: 8.6 — 6th most
> Firearm background checks per 1,000 residents, Feb 2022: 9.1 — 5th most
> Most common type of firearm check, Feb 2023: Handguns
> 2022 Population: 5,892,539 — 20th largest
[in-text-ad]
14. Georgia
> Change in background checks, Feb 2022- Feb 2023: -4.9% (-2,486 — 8th largest decrease)
> Firearm background checks, Feb 2023: 48,372 — 13th most
> Firearm background checks, Feb 2022: 50,858 — 13th most
> Firearm background checks per 1,000 residents, Feb 2023: 4.4 — 12th fewest
> Firearm background checks per 1,000 residents, Feb 2022: 4.7 — 13th fewest
> Most common type of firearm check, Feb 2023: Handguns
> 2022 Population: 10,912,876 — 8th largest
[recirclink id=1211295]

13. New York
> Change in background checks, Feb 2022- Feb 2023: -5.2% (-1,591 — 12th largest decrease)
> Firearm background checks, Feb 2023: 28,790 — 22nd most
> Firearm background checks, Feb 2022: 30,381 — 22nd most
> Firearm background checks per 1,000 residents, Feb 2023: 1.5 — 3rd fewest
> Firearm background checks per 1,000 residents, Feb 2022: 1.5 — 3rd fewest
> Most common type of firearm check, Feb 2023: Long guns
> 2022 Population: 19,677,151 — 4th largest
12. Minnesota
> Change in background checks, Feb 2022- Feb 2023: -5.9% (-2,193 — 9th largest decrease)
> Firearm background checks, Feb 2023: 34,776 — 20th most
> Firearm background checks, Feb 2022: 36,969 — 18th most
> Firearm background checks per 1,000 residents, Feb 2023: 6.1 — 22nd most
> Firearm background checks per 1,000 residents, Feb 2022: 6.5 — 20th most
> Most common type of firearm check, Feb 2023: Handguns
> 2022 Population: 5,717,184 — 22nd largest
[in-text-ad-2]
11. North Carolina
> Change in background checks, Feb 2022- Feb 2023: -6.6% (-3,461 — 6th largest decrease)
> Firearm background checks, Feb 2023: 48,956 — 12th most
> Firearm background checks, Feb 2022: 52,417 — 12th most
> Firearm background checks per 1,000 residents, Feb 2023: 4.6 — 13th fewest
> Firearm background checks per 1,000 residents, Feb 2022: 4.9 — 17th fewest
> Most common type of firearm check, Feb 2023: Long guns
> 2022 Population: 10,698,973 — 9th largest

10. Alaska
> Change in background checks, Feb 2022- Feb 2023: -6.7% (-380 — 7th smallest decrease)
> Firearm background checks, Feb 2023: 5,299 — 6th fewest
> Firearm background checks, Feb 2022: 5,679 — 7th fewest
> Firearm background checks per 1,000 residents, Feb 2023: 7.2 — 13th most
> Firearm background checks per 1,000 residents, Feb 2022: 7.7 — 10th most
> Most common type of firearm check, Feb 2023: Handguns
> 2022 Population: 733,583 — 3rd smallest
[in-text-ad]
9. Mississippi
> Change in background checks, Feb 2022- Feb 2023: -8.9% (-2,104 — 10th largest decrease)
> Firearm background checks, Feb 2023: 21,451 — 24th fewest
> Firearm background checks, Feb 2022: 23,555 — 25th fewest
> Firearm background checks per 1,000 residents, Feb 2023: 7.3 — 12th most
> Firearm background checks per 1,000 residents, Feb 2022: 8.0 — 9th most
> Most common type of firearm check, Feb 2023: Handguns
> 2022 Population: 2,940,057 — 17th smallest
[recirclink id=1211564]

8. Connecticut
> Change in background checks, Feb 2022- Feb 2023: -9.4% (-1,888 — 11th largest decrease)
> Firearm background checks, Feb 2023: 18,156 — 20th fewest
> Firearm background checks, Feb 2022: 20,044 — 23rd fewest
> Firearm background checks per 1,000 residents, Feb 2023: 5.0 — 17th fewest
> Firearm background checks per 1,000 residents, Feb 2022: 5.5 — 22nd fewest
> Most common type of firearm check, Feb 2023: Handguns
> 2022 Population: 3,626,205 — 22nd smallest
7. Tennessee
> Change in background checks, Feb 2022- Feb 2023: -11.0% (-8,376 — 2nd largest decrease)
> Firearm background checks, Feb 2023: 67,628 — 6th most
> Firearm background checks, Feb 2022: 76,004 — 5th most
> Firearm background checks per 1,000 residents, Feb 2023: 9.6 — 4th most
> Firearm background checks per 1,000 residents, Feb 2022: 10.8 — 2nd most
> Most common type of firearm check, Feb 2023: Handguns
> 2022 Population: 7,051,339 — 15th largest
[in-text-ad-2]
6. Wyoming
> Change in background checks, Feb 2022- Feb 2023: -12.5% (-677 — 10th smallest decrease)
> Firearm background checks, Feb 2023: 4,723 — 5th fewest
> Firearm background checks, Feb 2022: 5,400 — 6th fewest
> Firearm background checks per 1,000 residents, Feb 2023: 8.1 — 8th most
> Firearm background checks per 1,000 residents, Feb 2022: 9.3 — 4th most
> Most common type of firearm check, Feb 2023: Handguns
> 2022 Population: 581,381 — the smallest
5. South Dakota
> Change in background checks, Feb 2022- Feb 2023: -14.2% (-994 — 13th smallest decrease)
> Firearm background checks, Feb 2023: 5,984 — 8th fewest
> Firearm background checks, Feb 2022: 6,978 — 9th fewest
> Firearm background checks per 1,000 residents, Feb 2023: 6.6 — 18th most
> Firearm background checks per 1,000 residents, Feb 2022: 7.7 — 11th most
> Most common type of firearm check, Feb 2023: Long guns
> 2022 Population: 909,824 — 5th smallest
[in-text-ad]
4. Delaware
> Change in background checks, Feb 2022- Feb 2023: -15.2% (-757 — 11th smallest decrease)
> Firearm background checks, Feb 2023: 4,214 — 4th fewest
> Firearm background checks, Feb 2022: 4,971 — 4th fewest
> Firearm background checks per 1,000 residents, Feb 2023: 4.1 — 10th fewest
> Firearm background checks per 1,000 residents, Feb 2022: 4.9 — 16th fewest
> Most common type of firearm check, Feb 2023: Handguns
> 2022 Population: 1,018,396 — 6th smallest
[recirclink id=1207370]

3. South Carolina
> Change in background checks, Feb 2022- Feb 2023: -21.5% (-7,832 — 3rd largest decrease)
> Firearm background checks, Feb 2023: 28,585 — 23rd most
> Firearm background checks, Feb 2022: 36,417 — 19th most
> Firearm background checks per 1,000 residents, Feb 2023: 5.4 — 23rd fewest
> Firearm background checks per 1,000 residents, Feb 2022: 6.9 — 16th most
> Most common type of firearm check, Feb 2023: Handguns
> 2022 Population: 5,282,634 — 23rd largest
2. Louisiana
> Change in background checks, Feb 2022- Feb 2023: -21.5% (-6,162 — 4th largest decrease)
> Firearm background checks, Feb 2023: 22,434 — 25th fewest
> Firearm background checks, Feb 2022: 28,596 — 23rd most
> Firearm background checks per 1,000 residents, Feb 2023: 4.9 — 15th fewest
> Firearm background checks per 1,000 residents, Feb 2022: 6.2 — 22nd most
> Most common type of firearm check, Feb 2023: Handguns
> 2022 Population: 4,590,241 — 25th largest
[in-text-ad-2]
1. Alabama
> Change in background checks, Feb 2022- Feb 2023: -24.0% (-15,453 — the largest decrease)
> Firearm background checks, Feb 2023: 48,981 — 11th most
> Firearm background checks, Feb 2022: 64,434 — 6th most
> Firearm background checks per 1,000 residents, Feb 2023: 9.7 — 3rd most
> Firearm background checks per 1,000 residents, Feb 2022: 12.7 — the most
> Most common type of firearm check, Feb 2023: Handguns
> 2022 Population: 5,074,296 — 24th largest
Contact [email protected] for any questions or corrections.