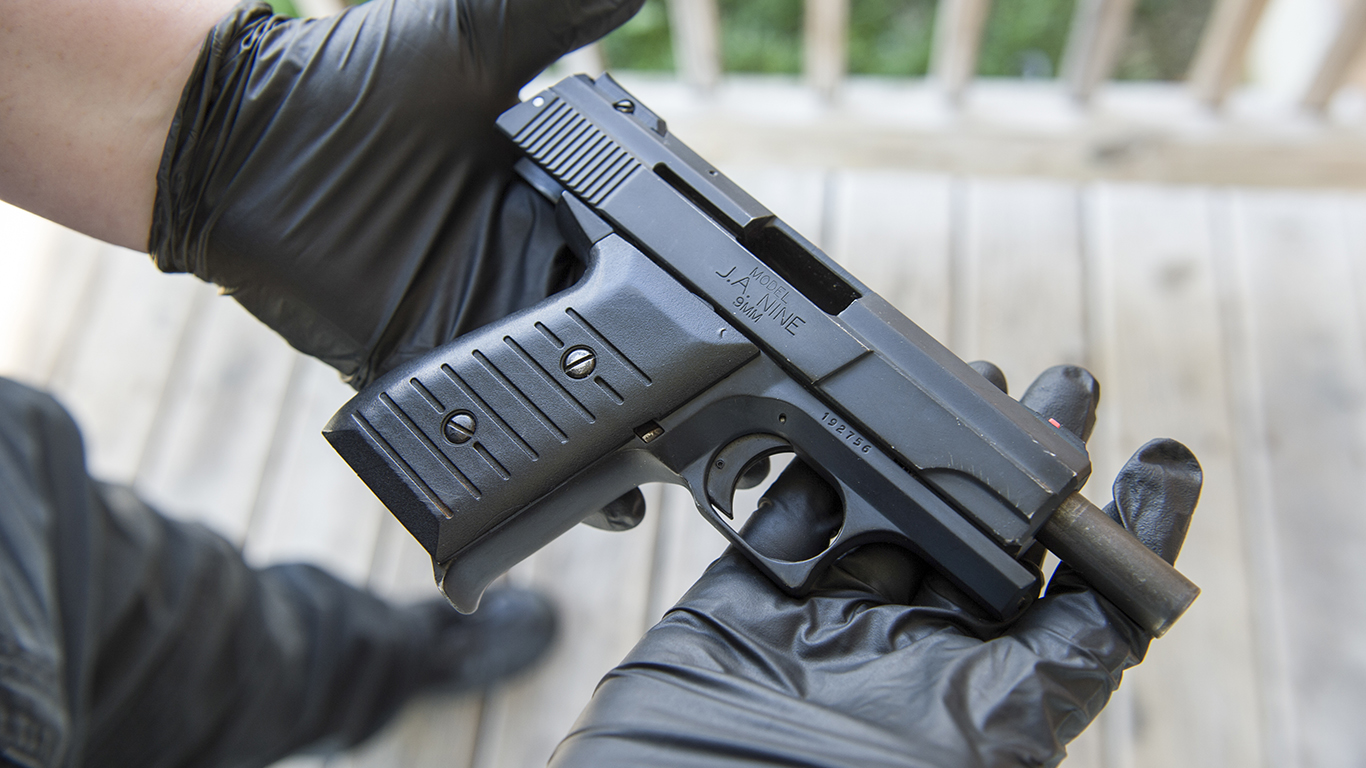
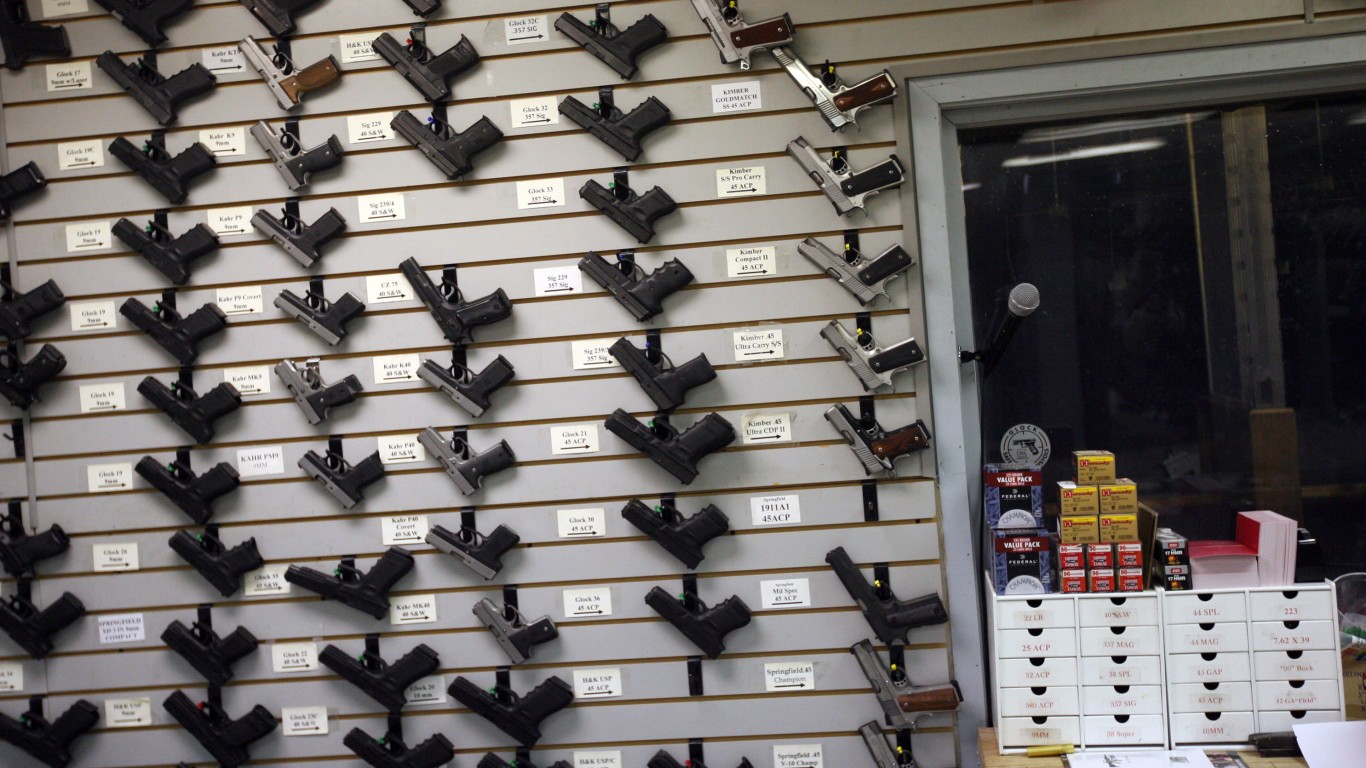
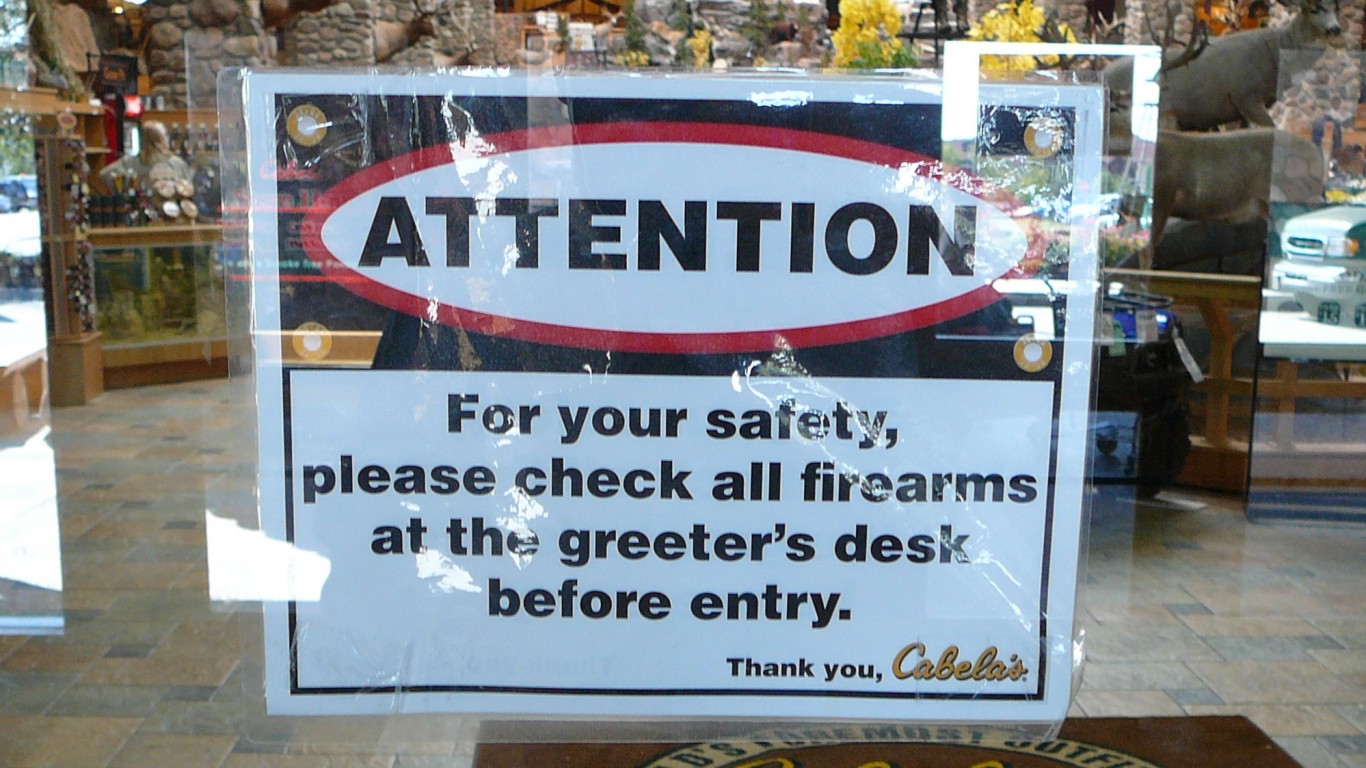
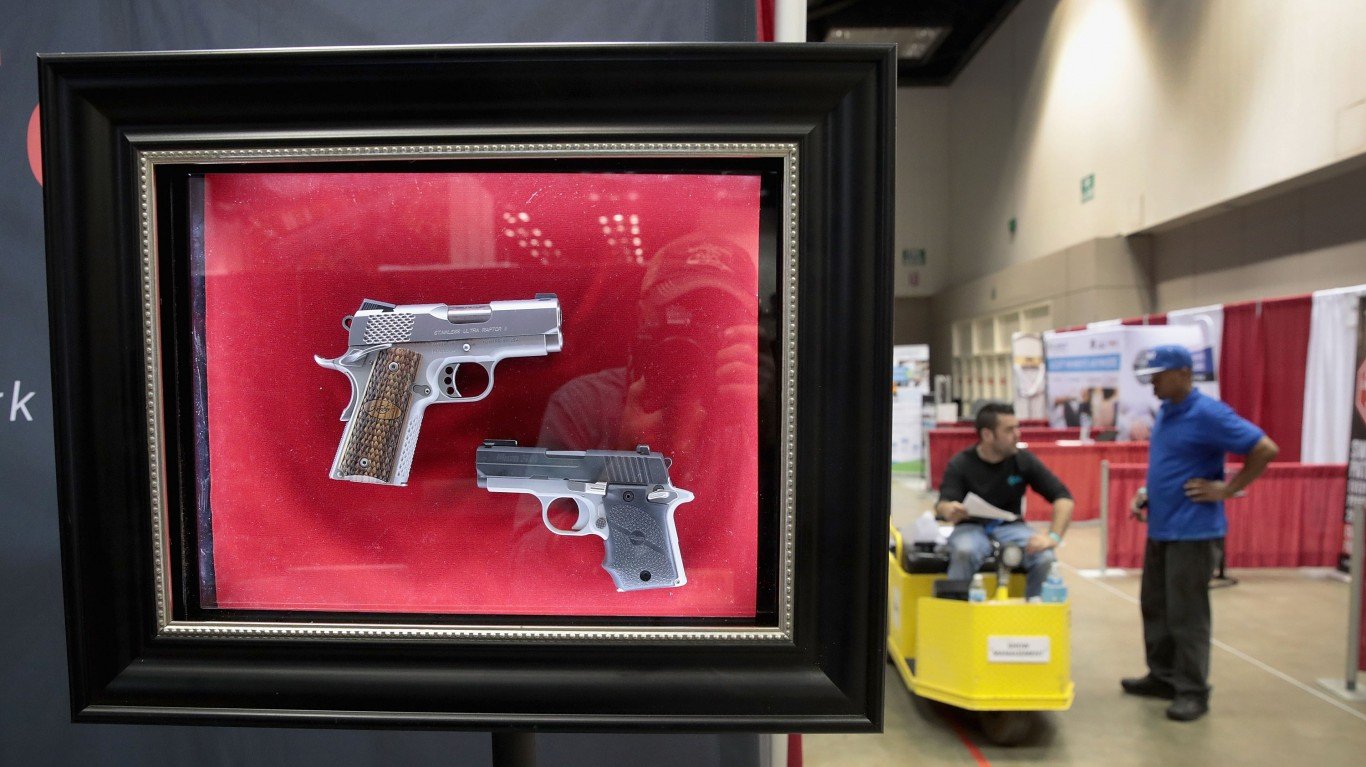
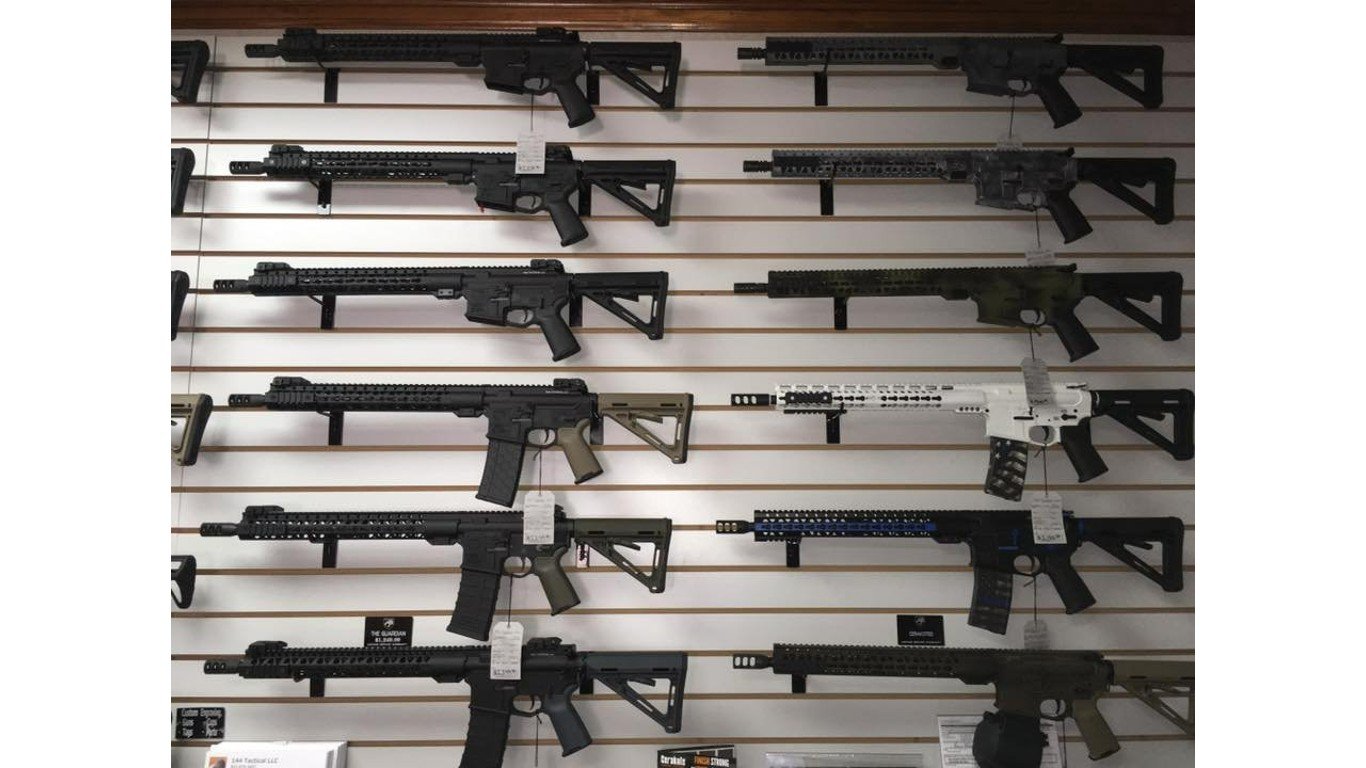
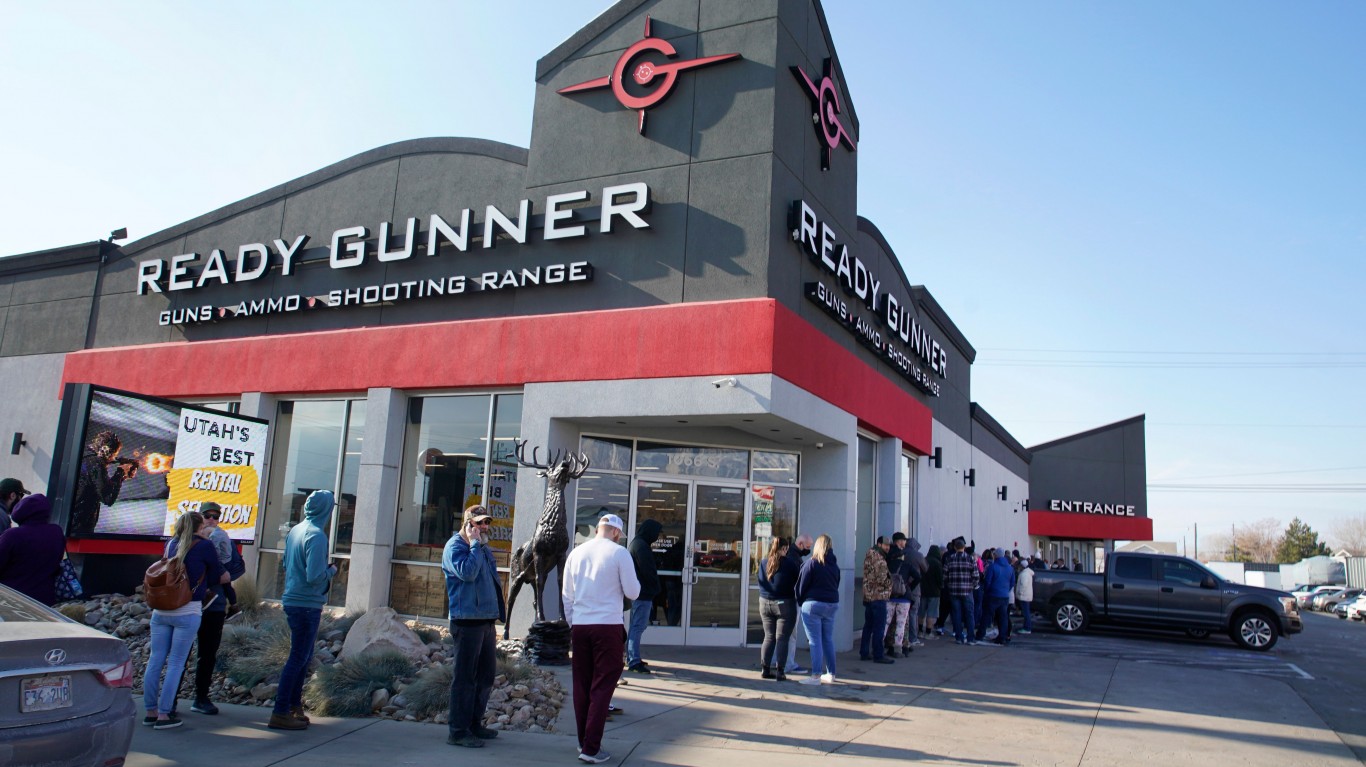
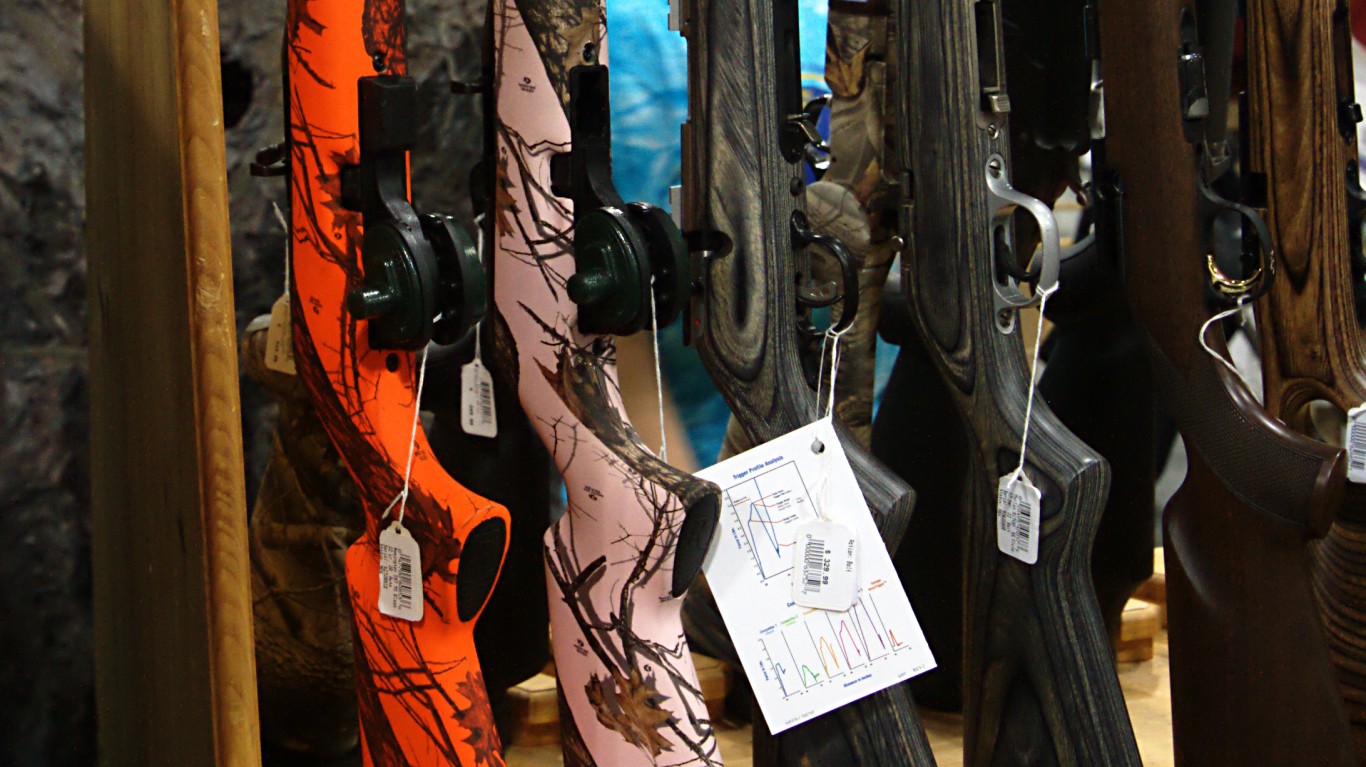
Nearly 18 million firearm background checks were conducted in the United States this year through July, according to data compiled by the FBI. That figure is more or less in line with the same period in 2022, when the FBI performed 31.6 million background checks in the entire year. Since 1998, the year with the most background checks was 2020 — the first year of the pandemic — when the FBI managed 39.7 million background checks. Firearm background checks are often used to approximate the level of gun sales in the United States. (These are America’s most popular .22 handgun companies.)
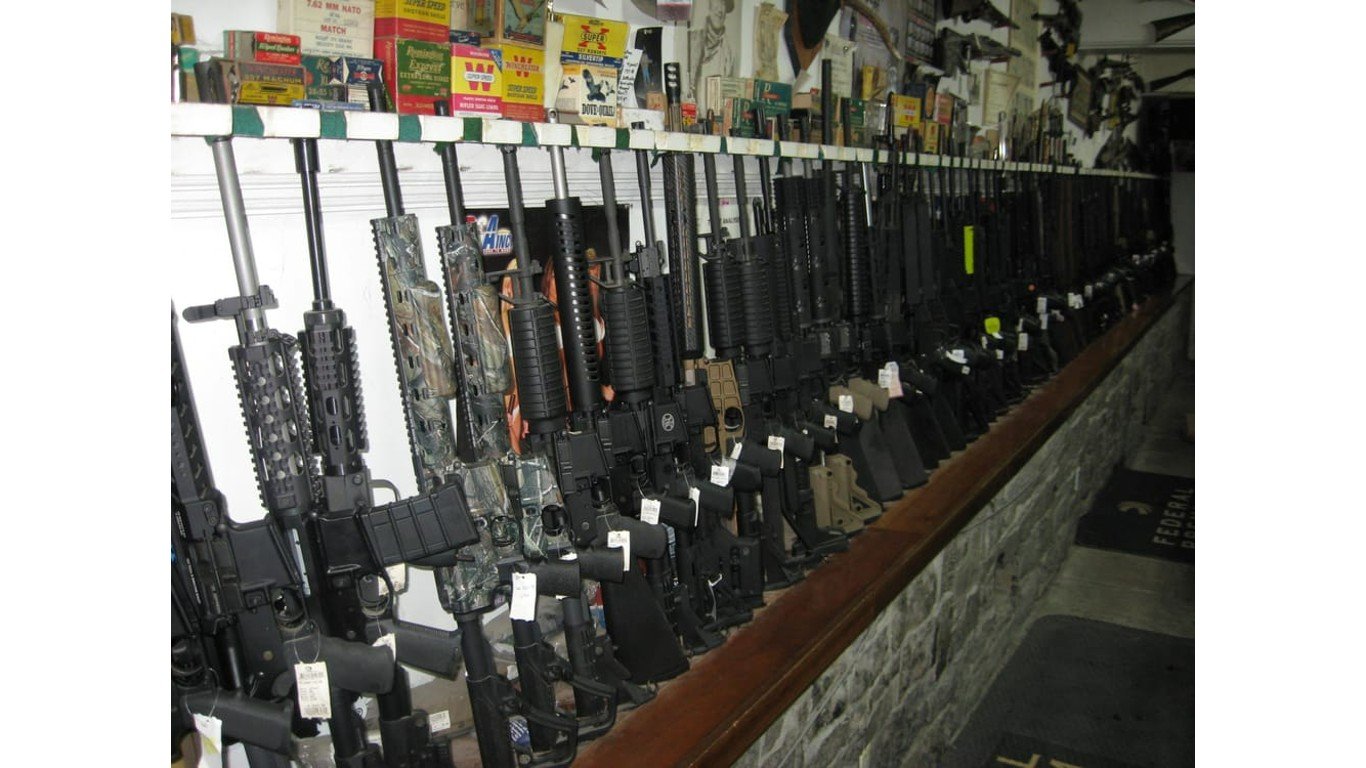
There are, however, many reasons to initiate a background check, some of which are not tied to gun sales, including pawn shop transactions and rentals. After controlling for some of these non-purchase causes, the adjusted figure is more likely tied to the acquisition of a firearm, and in the first seven months of the year, there were 11.2 million adjusted background checks, or 33.6 per 1,000 Americans. (These are America’s largest gun makers.)
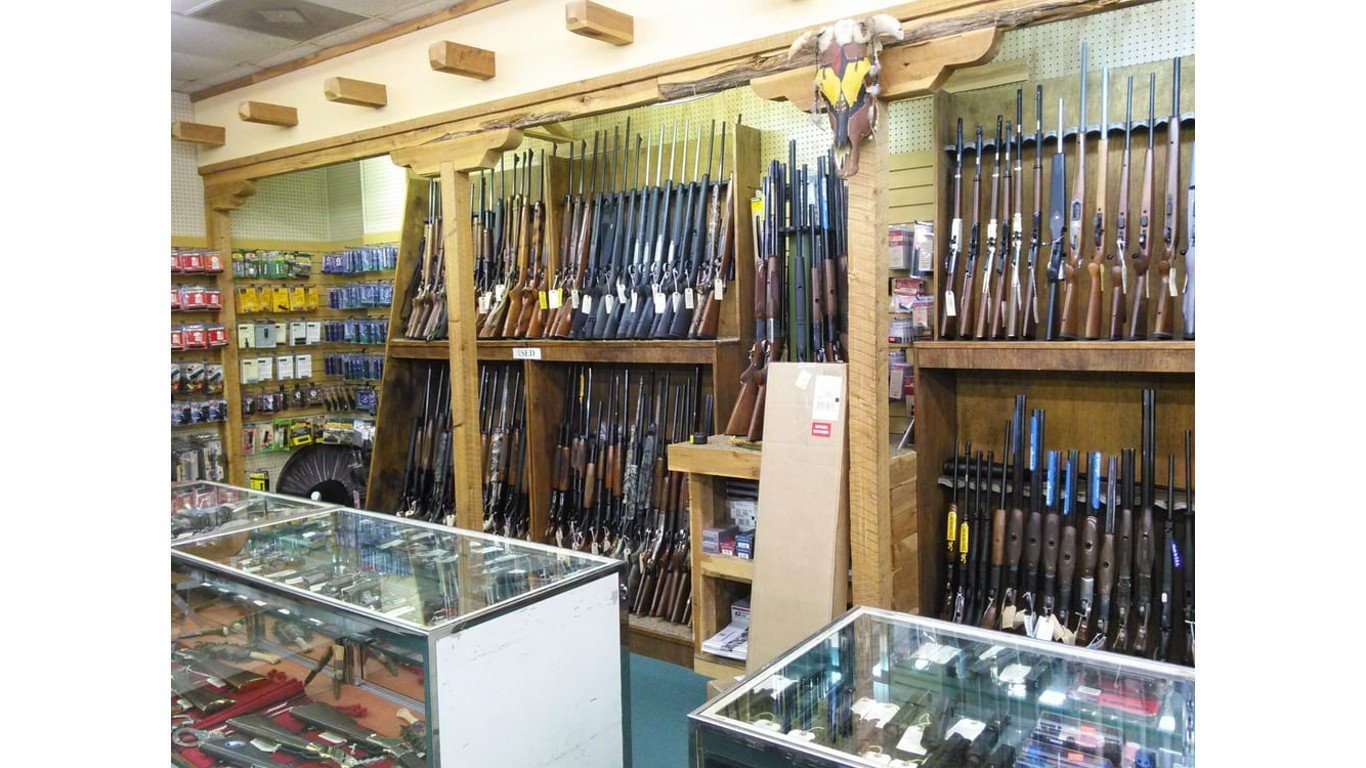
To find the states where the most people bought guns so far this year, 24/7 Wall St. used data from the FBI’s National Instant Criminal Background Check System. States are ranked based on the number of background gun checks per 1,000 people in the first seven months of 2023, adjusted by removing several categories of checks, including pawn shop transactions, returns, rentals, and rechecks (which are conducted periodically by some states on existing permit holders).
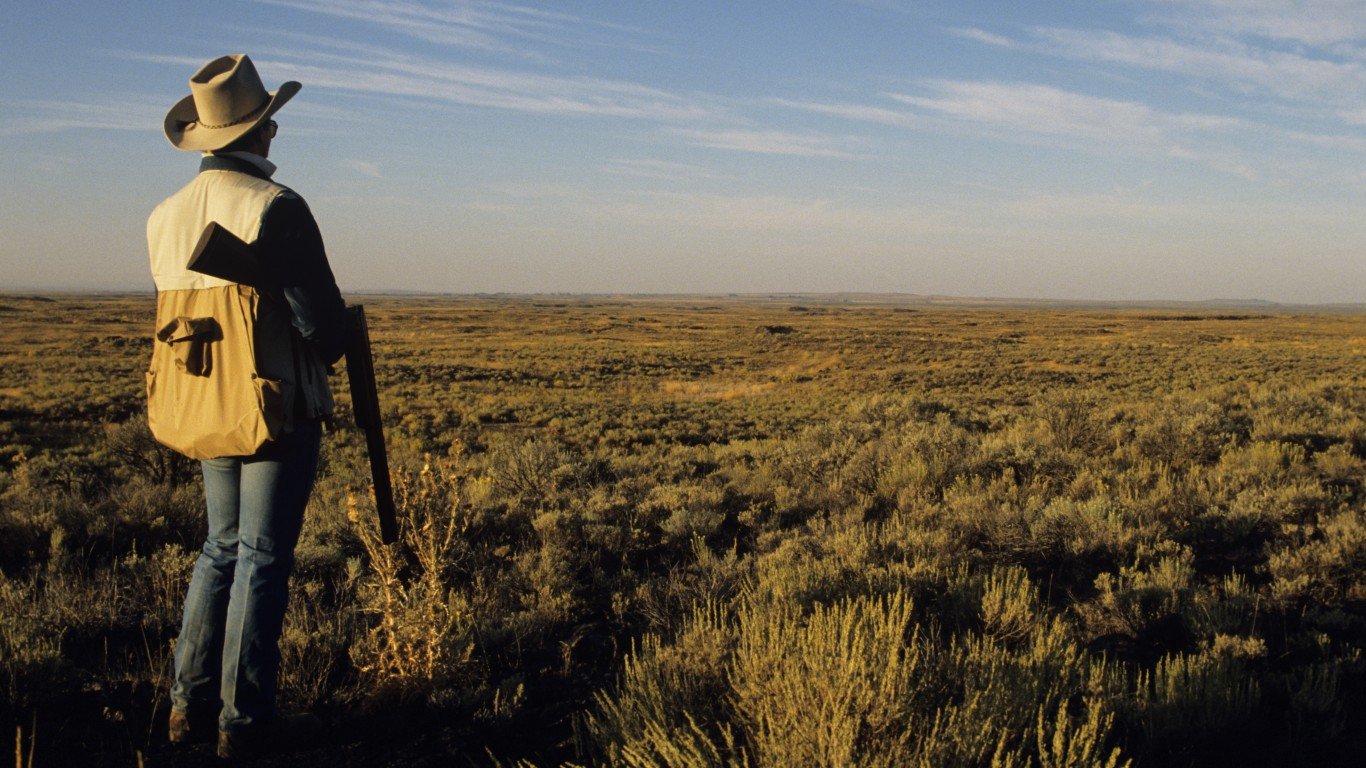
Last November, voters in Oregon passed a measure that banned the use of firearm magazines holding more than 10 bullets among other regulations that would add safeguards to who can buy and operate a gun in the state. Gun rights advocates have challenged the legislation, and a circuit court judge placed a stay on the measure. The legislation will remain blocked until the resolution of a state court trial, which is slated to resume in September.
That pending legislation is likely a factor behind the rush to buy guns in the state. No state bought more guns per capita so far this year than Oregon. From January through July, an estimated 308,000 background checks that are likely tied directly to the sale of a gun were conducted in Oregon, equal to 72.7 per 1,000 state residents. That figure is a 35.3% increase compared with the same period in 2022, the second largest in the nation.
Four other Western states have among the highest percentages of background checks, among them Idaho, Montana, Wyoming, and Alaska.
Click here to see states where the most people have bought guns so far this year.
50. Hawaii
> Firearm background checks per 1,000 residents, Jan-July 2023: 9.2
> Firearm background checks, Jan-July 2023: 13,200 — the fewest
> Most common type of firearm check: No data available
> Firearm background checks per 1,000 residents, Jan-July 2022: 7.6 — the fewest
> Firearm background checks, Jan-July 2022: 10,922 — the fewest
> Change in background checks, Jan-July 2022 – Jan-July 2023: +2,278 (+20.9% — 3rd largest increase)
> 2022 Population: 1.4 million — 11th smallest
[in-text-ad]
49. New York
> Firearm background checks per 1,000 residents, Jan-July 2023: 10.2
> Firearm background checks, Jan-July 2023: 199,873 — 22nd most
> Most common type of firearm check: Long guns
> Firearm background checks per 1,000 residents, Jan-July 2022: 12.1 — 3rd fewest
> Firearm background checks, Jan-July 2022: 238,334 — 20th most
> Change in background checks, Jan-July 2022 – Jan-July 2023: -38,461 (-16.1% — 5th largest decrease)
> 2022 Population: 19.7 million — 4th largest
[recirclink id=1259310]
48. New Jersey
> Firearm background checks per 1,000 residents, Jan-July 2023: 10.4
> Firearm background checks, Jan-July 2023: 96,065 — 16th fewest
> Most common type of firearm check: Handguns
> Firearm background checks per 1,000 residents, Jan-July 2022: 10.3 — 2nd fewest
> Firearm background checks, Jan-July 2022: 95,670 — 16th fewest
> Change in background checks, Jan-July 2022 – Jan-July 2023: +395 (+0.4% — 2nd smallest increase)
> 2022 Population: 9.3 million — 11th largest
47. Rhode Island
> Firearm background checks per 1,000 residents, Jan-July 2023: 13.1
> Firearm background checks, Jan-July 2023: 14,288 — 2nd fewest
> Most common type of firearm check: Handguns
> Firearm background checks per 1,000 residents, Jan-July 2022: 15.4 — 4th fewest
> Firearm background checks, Jan-July 2022: 16,864 — 2nd fewest
> Change in background checks, Jan-July 2022 – Jan-July 2023: -2,576 (-15.3% — 6th largest decrease)
> 2022 Population: 1.1 million — 7th smallest
[in-text-ad-2]
46. California
> Firearm background checks per 1,000 residents, Jan-July 2023: 17.8
> Firearm background checks, Jan-July 2023: 693,517 — 3rd most
> Most common type of firearm check: Handguns
> Firearm background checks per 1,000 residents, Jan-July 2022: 18.1 — 5th fewest
> Firearm background checks, Jan-July 2022: 704,566 — 4th most
> Change in background checks, Jan-July 2022 – Jan-July 2023: -11,049 (-1.6% — 4th smallest decrease)
> 2022 Population: 39.0 million — the largest

45. Massachusetts
> Firearm background checks per 1,000 residents, Jan-July 2023: 18.7
> Firearm background checks, Jan-July 2023: 130,867 — 22nd fewest
> Most common type of firearm check: Handguns
> Firearm background checks per 1,000 residents, Jan-July 2022: 19.0 — 6th fewest
> Firearm background checks, Jan-July 2022: 132,315 — 20th fewest
> Change in background checks, Jan-July 2022 – Jan-July 2023: -1,448 (-1.1% — 3rd smallest decrease)
> 2022 Population: 7.0 million — 16th largest
[in-text-ad]
44. Nebraska
> Firearm background checks per 1,000 residents, Jan-July 2023: 22.6
> Firearm background checks, Jan-July 2023: 44,390 — 9th fewest
> Most common type of firearm check: Long guns
> Firearm background checks per 1,000 residents, Jan-July 2022: 21.5 — 7th fewest
> Firearm background checks, Jan-July 2022: 42,213 — 7th fewest
> Change in background checks, Jan-July 2022 – Jan-July 2023: +2,177 (+5.2% — 5th smallest increase)
> 2022 Population: 2.0 million — 14th smallest
[recirclink id=1302769]
43. Iowa
> Firearm background checks per 1,000 residents, Jan-July 2023: 22.8
> Firearm background checks, Jan-July 2023: 73,029 — 13th fewest
> Most common type of firearm check: Handguns
> Firearm background checks per 1,000 residents, Jan-July 2022: 22.6 — 9th fewest
> Firearm background checks, Jan-July 2022: 72,362 — 11th fewest
> Change in background checks, Jan-July 2022 – Jan-July 2023: +667 (+0.9% — 3rd smallest increase)
> 2022 Population: 3.2 million — 20th smallest
42. Nevada
> Firearm background checks per 1,000 residents, Jan-July 2023: 25.3
> Firearm background checks, Jan-July 2023: 80,263 — 14th fewest
> Most common type of firearm check: Handguns
> Firearm background checks per 1,000 residents, Jan-July 2022: 28.6 — 10th fewest
> Firearm background checks, Jan-July 2022: 90,787 — 14th fewest
> Change in background checks, Jan-July 2022 – Jan-July 2023: -10,524 (-11.6% — 9th largest decrease)
> 2022 Population: 3.2 million — 19th smallest
[in-text-ad-2]
41. Georgia
> Firearm background checks per 1,000 residents, Jan-July 2023: 27.3
> Firearm background checks, Jan-July 2023: 297,508 — 16th most
> Most common type of firearm check: Handguns
> Firearm background checks per 1,000 residents, Jan-July 2022: 29.7 — 11th fewest
> Firearm background checks, Jan-July 2022: 324,654 — 13th most
> Change in background checks, Jan-July 2022 – Jan-July 2023: -27,146 (-8.4% — 19th smallest decrease)
> 2022 Population: 10.9 million — 8th largest
40. Texas
> Firearm background checks per 1,000 residents, Jan-July 2023: 27.8
> Firearm background checks, Jan-July 2023: 835,509 — the most
> Most common type of firearm check: Handguns
> Firearm background checks per 1,000 residents, Jan-July 2022: 30.7 — 12th fewest
> Firearm background checks, Jan-July 2022: 920,776 — the most
> Change in background checks, Jan-July 2022 – Jan-July 2023: -85,267 (-9.3% — 17th largest decrease)
> 2022 Population: 30.0 million — 2nd largest
[in-text-ad]
39. Delaware
> Firearm background checks per 1,000 residents, Jan-July 2023: 28.9
> Firearm background checks, Jan-July 2023: 29,418 — 4th fewest
> Most common type of firearm check: Handguns
> Firearm background checks per 1,000 residents, Jan-July 2022: 36.8 — 19th fewest
> Firearm background checks, Jan-July 2022: 37,486 — 4th fewest
> Change in background checks, Jan-July 2022 – Jan-July 2023: -8,068 (-21.5% — 2nd largest decrease)
> 2022 Population: 1.0 million — 6th smallest
[recirclink id=1301559]

38. Ohio
> Firearm background checks per 1,000 residents, Jan-July 2023: 29.1
> Firearm background checks, Jan-July 2023: 342,586 — 10th most
> Most common type of firearm check: Handguns
> Firearm background checks per 1,000 residents, Jan-July 2022: 31.5 — 14th fewest
> Firearm background checks, Jan-July 2022: 370,867 — 10th most
> Change in background checks, Jan-July 2022 – Jan-July 2023: -28,281 (-7.6% — 17th smallest decrease)
> 2022 Population: 11.8 million — 7th largest
37. Kentucky
> Firearm background checks per 1,000 residents, Jan-July 2023: 31.2
> Firearm background checks, Jan-July 2023: 140,978 — 24th fewest
> Most common type of firearm check: Handguns
> Firearm background checks per 1,000 residents, Jan-July 2022: 34.2 — 15th fewest
> Firearm background checks, Jan-July 2022: 154,262 — 25th fewest
> Change in background checks, Jan-July 2022 – Jan-July 2023: -13,284 (-8.6% — 20th largest decrease)
> 2022 Population: 4.5 million — 25th smallest
[in-text-ad-2]
36. Louisiana
> Firearm background checks per 1,000 residents, Jan-July 2023: 32.2
> Firearm background checks, Jan-July 2023: 147,693 — 25th fewest
> Most common type of firearm check: Handguns
> Firearm background checks per 1,000 residents, Jan-July 2022: 39.5 — 24th fewest
> Firearm background checks, Jan-July 2022: 181,529 — 24th most
> Change in background checks, Jan-July 2022 – Jan-July 2023: -33,836 (-18.6% — 3rd largest decrease)
> 2022 Population: 4.6 million — 25th largest

35. Maryland
> Firearm background checks per 1,000 residents, Jan-July 2023: 32.9
> Firearm background checks, Jan-July 2023: 202,773 — 21st most
> Most common type of firearm check: Handguns
> Firearm background checks per 1,000 residents, Jan-July 2022: 21.7 — 8th fewest
> Firearm background checks, Jan-July 2022: 133,511 — 22nd fewest
> Change in background checks, Jan-July 2022 – Jan-July 2023: +69,262 (+51.9% — the largest increase)
> 2022 Population: 6.2 million — 19th largest
[in-text-ad]
34. Kansas
> Firearm background checks per 1,000 residents, Jan-July 2023: 33.0
> Firearm background checks, Jan-July 2023: 96,862 — 18th fewest
> Most common type of firearm check: Handguns
> Firearm background checks per 1,000 residents, Jan-July 2022: 35.0 — 16th fewest
> Firearm background checks, Jan-July 2022: 102,803 — 18th fewest
> Change in background checks, Jan-July 2022 – Jan-July 2023: -5,941 (-5.8% — 9th smallest decrease)
> 2022 Population: 2.9 million — 16th smallest
[recirclink id=1301069]
33. Florida
> Firearm background checks per 1,000 residents, Jan-July 2023: 34.1
> Firearm background checks, Jan-July 2023: 759,276 — 2nd most
> Most common type of firearm check: Handguns
> Firearm background checks per 1,000 residents, Jan-July 2022: 37.2 — 21st fewest
> Firearm background checks, Jan-July 2022: 826,849 — 2nd most
> Change in background checks, Jan-July 2022 – Jan-July 2023: -67,573 (-8.2% — 18th smallest decrease)
> 2022 Population: 22.2 million — 3rd largest

32. Virginia
> Firearm background checks per 1,000 residents, Jan-July 2023: 34.3
> Firearm background checks, Jan-July 2023: 298,268 — 15th most
> Most common type of firearm check: Handguns
> Firearm background checks per 1,000 residents, Jan-July 2022: 36.6 — 18th fewest
> Firearm background checks, Jan-July 2022: 317,999 — 14th most
> Change in background checks, Jan-July 2022 – Jan-July 2023: -19,731 (-6.2% — 12th smallest decrease)
> 2022 Population: 8.7 million — 12th largest
[in-text-ad-2]
31. Connecticut
> Firearm background checks per 1,000 residents, Jan-July 2023: 34.4
> Firearm background checks, Jan-July 2023: 124,583 — 21st fewest
> Most common type of firearm check: Handguns
> Firearm background checks per 1,000 residents, Jan-July 2022: 38.4 — 22nd fewest
> Firearm background checks, Jan-July 2022: 139,312 — 24th fewest
> Change in background checks, Jan-July 2022 – Jan-July 2023: -14,729 (-10.6% — 11th largest decrease)
> 2022 Population: 3.6 million — 22nd smallest
30. South Carolina
> Firearm background checks per 1,000 residents, Jan-July 2023: 35.6
> Firearm background checks, Jan-July 2023: 188,089 — 23rd most
> Most common type of firearm check: Handguns
> Firearm background checks per 1,000 residents, Jan-July 2022: 42.8 — 23rd most
> Firearm background checks, Jan-July 2022: 226,300 — 22nd most
> Change in background checks, Jan-July 2022 – Jan-July 2023: -38,211 (-16.9% — 4th largest decrease)
> 2022 Population: 5.3 million — 23rd largest
[in-text-ad]
29. Indiana
> Firearm background checks per 1,000 residents, Jan-July 2023: 36.7
> Firearm background checks, Jan-July 2023: 250,604 — 19th most
> Most common type of firearm check: Handguns
> Firearm background checks per 1,000 residents, Jan-July 2022: 41.1 — 25th most
> Firearm background checks, Jan-July 2022: 281,070 — 18th most
> Change in background checks, Jan-July 2022 – Jan-July 2023: -30,466 (-10.8% — 10th largest decrease)
> 2022 Population: 6.8 million — 17th largest
[recirclink id=1254010]
28. Vermont
> Firearm background checks per 1,000 residents, Jan-July 2023: 36.9
> Firearm background checks, Jan-July 2023: 23,862 — 3rd fewest
> Most common type of firearm check: Handguns
> Firearm background checks per 1,000 residents, Jan-July 2022: 39.2 — 23rd fewest
> Firearm background checks, Jan-July 2022: 25,354 — 3rd fewest
> Change in background checks, Jan-July 2022 – Jan-July 2023: -1,492 (-5.9% — 10th smallest decrease)
> 2022 Population: 647,064 — 2nd smallest
27. Arkansas
> Firearm background checks per 1,000 residents, Jan-July 2023: 36.9
> Firearm background checks, Jan-July 2023: 112,326 — 19th fewest
> Most common type of firearm check: Handguns
> Firearm background checks per 1,000 residents, Jan-July 2022: 37.1 — 20th fewest
> Firearm background checks, Jan-July 2022: 113,050 — 19th fewest
> Change in background checks, Jan-July 2022 – Jan-July 2023: -724 (-0.6% — 2nd smallest decrease)
> 2022 Population: 3.0 million — 18th smallest
[in-text-ad-2]
26. Arizona
> Firearm background checks per 1,000 residents, Jan-July 2023: 37.6
> Firearm background checks, Jan-July 2023: 276,494 — 17th most
> Most common type of firearm check: Handguns
> Firearm background checks per 1,000 residents, Jan-July 2022: 40.2 — 25th fewest
> Firearm background checks, Jan-July 2022: 295,727 — 16th most
> Change in background checks, Jan-July 2022 – Jan-July 2023: -19,233 (-6.5% — 15th smallest decrease)
> 2022 Population: 7.4 million — 14th largest
25. North Carolina
> Firearm background checks per 1,000 residents, Jan-July 2023: 37.7
> Firearm background checks, Jan-July 2023: 403,483 — 7th most
> Most common type of firearm check: Handguns
> Firearm background checks per 1,000 residents, Jan-July 2022: 31.2 — 13th fewest
> Firearm background checks, Jan-July 2022: 334,041 — 12th most
> Change in background checks, Jan-July 2022 – Jan-July 2023: +69,442 (+20.8% — 4th largest increase)
> 2022 Population: 10.7 million — 9th largest
[in-text-ad]
24. Illinois
> Firearm background checks per 1,000 residents, Jan-July 2023: 39.3
> Firearm background checks, Jan-July 2023: 494,741 — 5th most
> Most common type of firearm check: Handguns
> Firearm background checks per 1,000 residents, Jan-July 2022: 35.2 — 17th fewest
> Firearm background checks, Jan-July 2022: 443,103 — 7th most
> Change in background checks, Jan-July 2022 – Jan-July 2023: +51,637 (+11.7% — 5th largest increase)
> 2022 Population: 12.6 million — 6th largest
[recirclink id=1259310]

23. Michigan
> Firearm background checks per 1,000 residents, Jan-July 2023: 40.2
> Firearm background checks, Jan-July 2023: 403,395 — 8th most
> Most common type of firearm check: Handguns
> Firearm background checks per 1,000 residents, Jan-July 2022: 41.6 — 24th most
> Firearm background checks, Jan-July 2022: 417,254 — 8th most
> Change in background checks, Jan-July 2022 – Jan-July 2023: -13,859 (-3.3% — 7th smallest decrease)
> 2022 Population: 10.0 million — 10th largest
22. Maine
> Firearm background checks per 1,000 residents, Jan-July 2023: 41.1
> Firearm background checks, Jan-July 2023: 56,986 — 10th fewest
> Most common type of firearm check: Handguns
> Firearm background checks per 1,000 residents, Jan-July 2022: 44.3 — 22nd most
> Firearm background checks, Jan-July 2022: 61,374 — 10th fewest
> Change in background checks, Jan-July 2022 – Jan-July 2023: -4,388 (-7.1% — 16th smallest decrease)
> 2022 Population: 1.4 million — 9th smallest
[in-text-ad-2]
21. Missouri
> Firearm background checks per 1,000 residents, Jan-July 2023: 41.3
> Firearm background checks, Jan-July 2023: 254,914 — 18th most
> Most common type of firearm check: Handguns
> Firearm background checks per 1,000 residents, Jan-July 2022: 46.1 — 20th most
> Firearm background checks, Jan-July 2022: 284,520 — 17th most
> Change in background checks, Jan-July 2022 – Jan-July 2023: -29,606 (-10.4% — 12th largest decrease)
> 2022 Population: 6.2 million — 18th largest
20. Mississippi
> Firearm background checks per 1,000 residents, Jan-July 2023: 41.9
> Firearm background checks, Jan-July 2023: 123,293 — 20th fewest
> Most common type of firearm check: Handguns
> Firearm background checks per 1,000 residents, Jan-July 2022: 46.5 — 19th most
> Firearm background checks, Jan-July 2022: 136,802 — 23rd fewest
> Change in background checks, Jan-July 2022 – Jan-July 2023: -13,509 (-9.9% — 14th largest decrease)
> 2022 Population: 2.9 million — 17th smallest
[in-text-ad]

19. New Mexico
> Firearm background checks per 1,000 residents, Jan-July 2023: 43.1
> Firearm background checks, Jan-July 2023: 91,041 — 15th fewest
> Most common type of firearm check: Handguns
> Firearm background checks per 1,000 residents, Jan-July 2022: 44.3 — 21st most
> Firearm background checks, Jan-July 2022: 93,689 — 15th fewest
> Change in background checks, Jan-July 2022 – Jan-July 2023: -2,648 (-2.8% — 5th smallest decrease)
> 2022 Population: 2.1 million — 15th smallest
[recirclink id=1302769]
18. South Dakota
> Firearm background checks per 1,000 residents, Jan-July 2023: 43.1
> Firearm background checks, Jan-July 2023: 39,208 — 7th fewest
> Most common type of firearm check: Long guns
> Firearm background checks per 1,000 residents, Jan-July 2022: 50.6 — 15th most
> Firearm background checks, Jan-July 2022: 46,034 — 9th fewest
> Change in background checks, Jan-July 2022 – Jan-July 2023: -6,826 (-14.8% — 7th largest decrease)
> 2022 Population: 909,824 — 5th smallest
17. Minnesota
> Firearm background checks per 1,000 residents, Jan-July 2023: 43.1
> Firearm background checks, Jan-July 2023: 246,553 — 20th most
> Most common type of firearm check: Handguns
> Firearm background checks per 1,000 residents, Jan-July 2022: 47.5 — 16th most
> Firearm background checks, Jan-July 2022: 271,559 — 19th most
> Change in background checks, Jan-July 2022 – Jan-July 2023: -25,006 (-9.2% — 19th largest decrease)
> 2022 Population: 5.7 million — 22nd largest
[in-text-ad-2]

16. Oklahoma
> Firearm background checks per 1,000 residents, Jan-July 2023: 44.0
> Firearm background checks, Jan-July 2023: 177,041 — 24th most
> Most common type of firearm check: Handguns
> Firearm background checks per 1,000 residents, Jan-July 2022: 46.9 — 17th most
> Firearm background checks, Jan-July 2022: 188,473 — 23rd most
> Change in background checks, Jan-July 2022 – Jan-July 2023: -11,432 (-6.1% — 11th smallest decrease)
> 2022 Population: 4.0 million — 23rd smallest
15. North Dakota
> Firearm background checks per 1,000 residents, Jan-July 2023: 46.5
> Firearm background checks, Jan-July 2023: 36,243 — 6th fewest
> Most common type of firearm check: Long guns
> Firearm background checks per 1,000 residents, Jan-July 2022: 51.7 — 14th most
> Firearm background checks, Jan-July 2022: 40,293 — 6th fewest
> Change in background checks, Jan-July 2022 – Jan-July 2023: -4,050 (-10.1% — 13th largest decrease)
> 2022 Population: 779,261 — 4th smallest
[in-text-ad]
14. Utah
> Firearm background checks per 1,000 residents, Jan-July 2023: 51.3
> Firearm background checks, Jan-July 2023: 173,537 — 25th most
> Most common type of firearm check: Handguns
> Firearm background checks per 1,000 residents, Jan-July 2022: 46.7 — 18th most
> Firearm background checks, Jan-July 2022: 157,854 — 25th most
> Change in background checks, Jan-July 2022 – Jan-July 2023: +15,683 (+9.9% — 6th largest increase)
> 2022 Population: 3.4 million — 21st smallest
[recirclink id=1301559]

13. Pennsylvania
> Firearm background checks per 1,000 residents, Jan-July 2023: 51.6
> Firearm background checks, Jan-July 2023: 669,223 — 4th most
> Most common type of firearm check: Handguns
> Firearm background checks per 1,000 residents, Jan-July 2022: 54.5 — 9th most
> Firearm background checks, Jan-July 2022: 707,518 — 3rd most
> Change in background checks, Jan-July 2022 – Jan-July 2023: -38,295 (-5.4% — 8th smallest decrease)
> 2022 Population: 13.0 million — 5th largest
12. Washington
> Firearm background checks per 1,000 residents, Jan-July 2023: 51.8
> Firearm background checks, Jan-July 2023: 403,077 — 9th most
> Most common type of firearm check: Handguns
> Firearm background checks per 1,000 residents, Jan-July 2022: 57.0 — 8th most
> Firearm background checks, Jan-July 2022: 443,979 — 6th most
> Change in background checks, Jan-July 2022 – Jan-July 2023: -40,902 (-9.2% — 18th largest decrease)
> 2022 Population: 7.8 million — 13th largest
[in-text-ad-2]

11. Colorado
> Firearm background checks per 1,000 residents, Jan-July 2023: 52.1
> Firearm background checks, Jan-July 2023: 304,311 — 14th most
> Most common type of firearm check: Handguns
> Firearm background checks per 1,000 residents, Jan-July 2022: 52.2 — 13th most
> Firearm background checks, Jan-July 2022: 304,762 — 15th most
> Change in background checks, Jan-July 2022 – Jan-July 2023: -451 (-0.1% — the smallest decrease)
> 2022 Population: 5.8 million — 21st largest
10. New Hampshire
> Firearm background checks per 1,000 residents, Jan-July 2023: 52.3
> Firearm background checks, Jan-July 2023: 73,001 — 12th fewest
> Most common type of firearm check: Handguns
> Firearm background checks per 1,000 residents, Jan-July 2022: 54.1 — 11th most
> Firearm background checks, Jan-July 2022: 75,447 — 13th fewest
> Change in background checks, Jan-July 2022 – Jan-July 2023: -2,446 (-3.2% — 6th smallest decrease)
> 2022 Population: 1.4 million — 10th smallest
[in-text-ad]
9. West Virginia
> Firearm background checks per 1,000 residents, Jan-July 2023: 54.2
> Firearm background checks, Jan-July 2023: 96,141 — 17th fewest
> Most common type of firearm check: Handguns
> Firearm background checks per 1,000 residents, Jan-July 2022: 54.1 — 10th most
> Firearm background checks, Jan-July 2022: 96,025 — 17th fewest
> Change in background checks, Jan-July 2022 – Jan-July 2023: +116 (+0.1% — the smallest increase)
> 2022 Population: 1.8 million — 12th smallest
[recirclink id=1301069]
8. Wisconsin
> Firearm background checks per 1,000 residents, Jan-July 2023: 54.2
> Firearm background checks, Jan-July 2023: 319,305 — 11th most
> Most common type of firearm check: Handguns
> Firearm background checks per 1,000 residents, Jan-July 2022: 60.0 — 7th most
> Firearm background checks, Jan-July 2022: 353,375 — 11th most
> Change in background checks, Jan-July 2022 – Jan-July 2023: -34,070 (-9.6% — 16th largest decrease)
> 2022 Population: 5.9 million — 20th largest
7. Alaska
> Firearm background checks per 1,000 residents, Jan-July 2023: 56.7
> Firearm background checks, Jan-July 2023: 41,584 — 8th fewest
> Most common type of firearm check: Handguns
> Firearm background checks per 1,000 residents, Jan-July 2022: 60.6 — 6th most
> Firearm background checks, Jan-July 2022: 44,436 — 8th fewest
> Change in background checks, Jan-July 2022 – Jan-July 2023: -2,852 (-6.4% — 14th smallest decrease)
> 2022 Population: 733,583 — 3rd smallest
[in-text-ad-2]

6. Wyoming
> Firearm background checks per 1,000 residents, Jan-July 2023: 59.1
> Firearm background checks, Jan-July 2023: 34,376 — 5th fewest
> Most common type of firearm check: Handguns
> Firearm background checks per 1,000 residents, Jan-July 2022: 65.5 — 5th most
> Firearm background checks, Jan-July 2022: 38,100 — 5th fewest
> Change in background checks, Jan-July 2022 – Jan-July 2023: -3,724 (-9.8% — 15th largest decrease)
> 2022 Population: 581,381 — the smallest
5. Tennessee
> Firearm background checks per 1,000 residents, Jan-July 2023: 60.1
> Firearm background checks, Jan-July 2023: 423,979 — 6th most
> Most common type of firearm check: Handguns
> Firearm background checks per 1,000 residents, Jan-July 2022: 68.2 — 3rd most
> Firearm background checks, Jan-July 2022: 480,630 — 5th most
> Change in background checks, Jan-July 2022 – Jan-July 2023: -56,651 (-11.8% — 8th largest decrease)
> 2022 Population: 7.1 million — 15th largest
[in-text-ad]
4. Alabama
> Firearm background checks per 1,000 residents, Jan-July 2023: 61.8
> Firearm background checks, Jan-July 2023: 313,353 — 12th most
> Most common type of firearm check: Handguns
> Firearm background checks per 1,000 residents, Jan-July 2022: 79.3 — the most
> Firearm background checks, Jan-July 2022: 402,237 — 9th most
> Change in background checks, Jan-July 2022 – Jan-July 2023: -88,884 (-22.1% — the largest decrease)
> 2022 Population: 5.1 million — 24th largest
[recirclink id=1254010]

3. Montana
> Firearm background checks per 1,000 residents, Jan-July 2023: 62.5
> Firearm background checks, Jan-July 2023: 70,220 — 11th fewest
> Most common type of firearm check: Handguns
> Firearm background checks per 1,000 residents, Jan-July 2022: 66.7 — 4th most
> Firearm background checks, Jan-July 2022: 74,898 — 12th fewest
> Change in background checks, Jan-July 2022 – Jan-July 2023: -4,678 (-6.2% — 13th smallest decrease)
> 2022 Population: 1.1 million — 8th smallest
2. Idaho
> Firearm background checks per 1,000 residents, Jan-July 2023: 69.9
> Firearm background checks, Jan-July 2023: 135,569 — 23rd fewest
> Most common type of firearm check: Handguns
> Firearm background checks per 1,000 residents, Jan-July 2022: 68.7 — 2nd most
> Firearm background checks, Jan-July 2022: 133,216 — 21st fewest
> Change in background checks, Jan-July 2022 – Jan-July 2023: +2,353 (+1.8% — 4th smallest increase)
> 2022 Population: 1.9 million — 13th smallest
[in-text-ad-2]

1. Oregon
> Firearm background checks per 1,000 residents, Jan-July 2023: 72.7
> Firearm background checks, Jan-July 2023: 308,048 — 13th most
> Most common type of firearm check: Handguns
> Firearm background checks per 1,000 residents, Jan-July 2022: 53.6 — 12th most
> Firearm background checks, Jan-July 2022: 227,266 — 21st most
> Change in background checks, Jan-July 2022 – Jan-July 2023: +80,782 (+35.5% — 2nd largest increase)
> 2022 Population: 4.2 million — 24th smallest
Contact [email protected] for any questions or corrections.