
The number of reported homicides in the U.S. surged by a record-breaking 30% in 2020, topping 20,000 for the first time since 1995. When incidents of deadly violence jump, there is rarely only one cause.
Crime rates in the United States are affected by a number of social and economic variables. According to the FBI, these include, but are not limited to, financial security, family cohesiveness, population density, law enforcement efficacy, and public attitudes toward crime. Both at an individual level, and across broad populations, these and other factors can have a meaningful impact on rates of every type of criminal activity — including homicide.
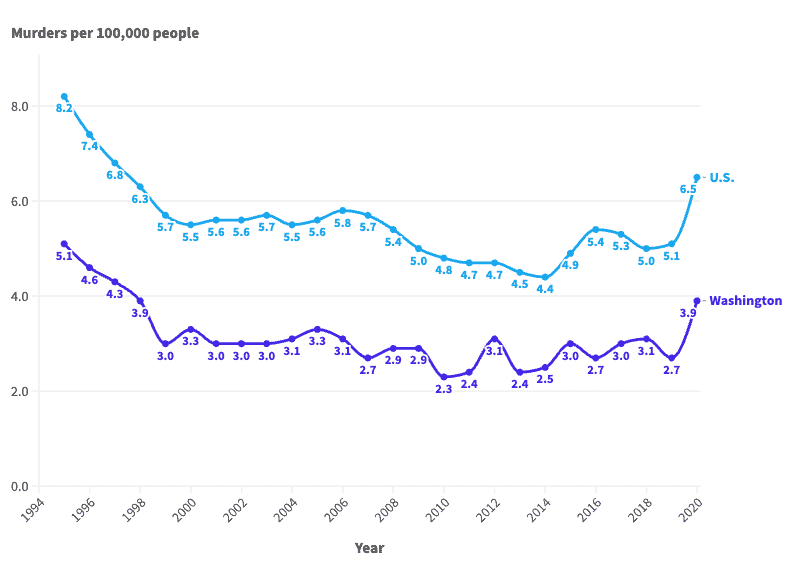
In the 26 years from 1995 to 2020, the number of murders reported annually in the U.S. ranged from about 14,200 to nearly 22,000. Over the same period, the national population adjusted homicide rate varied from 4.4 murders for every 100,000 people, to 8.2 per 100,000.
Similar fluctuations in rates of violence are also evident in Washington state. Since 1995, Washington’s annual murder rate has gone as high as 5.1 homicides per 100,000 people, down to 2.3 per 100,000. Meanwhile, the annual number of murders in the state peaked at 301, and fell as low as 154 over the same 26 year period.
Washington’s homicide rate has been lower than the national average every year since 1995 — and for most of the last two and a half decades, it has ranked among 20 lowest of the 50 states.
Using historical data from the FBI’s Uniform Crime Reporting Program, 24/7 Wall St. reviewed Washington’s murder rate every year since 1995.

1996: 4.6 homicides per 100,000 people

- Washington’s murder rate in 1996: 4.6 per 100,000 people (21st lowest among the 50 states)
- U.S. murder rate in 1996: 7.4 per 100,000 people
- Total murders in Washington in 1996: 255
- Total murders in U.S. in 1996: 19,645
1997: 4.3 homicides per 100,000 people

- Washington’s murder rate in 1997: 4.3 per 100,000 people (22nd lowest among the 50 states)
- U.S. murder rate in 1997: 6.8 per 100,000 people
- Total murders in Washington in 1997: 244
- Total murders in U.S. in 1997: 18,211
1998: 3.9 homicides per 100,000 people

- Washington’s murder rate in 1998: 3.9 per 100,000 people (18th lowest among the 50 states)
- U.S. murder rate in 1998: 6.3 per 100,000 people
- Total murders in Washington in 1998: 224
- Total murders in U.S. in 1998: 16,974
1999: 3.0 homicides per 100,000 people

- Washington’s murder rate in 1999: 3.0 per 100,000 people (14th lowest among the 50 states)
- U.S. murder rate in 1999: 5.7 per 100,000 people
- Total murders in Washington in 1999: 171
- Total murders in U.S. in 1999: 15,522
2000: 3.3 homicides per 100,000 people

- Washington’s murder rate in 2000: 3.3 per 100,000 people (20th lowest among the 50 states)
- U.S. murder rate in 2000: 5.5 per 100,000 people
- Total murders in Washington in 2000: 196
- Total murders in U.S. in 2000: 15,586
2001: 3.0 homicides per 100,000 people

- Washington’s murder rate in 2001: 3.0 per 100,000 people (17th lowest among the 50 states)
- U.S. murder rate in 2001: 5.6 per 100,000 people
- Total murders in Washington in 2001: 179
- Total murders in U.S. in 2001: 16,037
2002: 3.0 homicides per 100,000 people

- Washington’s murder rate in 2002: 3.0 per 100,000 people (19th lowest among the 50 states)
- U.S. murder rate in 2002: 5.6 per 100,000 people
- Total murders in Washington in 2002: 184
- Total murders in U.S. in 2002: 16,229
2003: 3.0 homicides per 100,000 people
- Washington’s murder rate in 2003: 3.0 per 100,000 people (16th lowest among the 50 states)
- U.S. murder rate in 2003: 5.7 per 100,000 people
- Total murders in Washington in 2003: 182
- Total murders in U.S. in 2003: 16,528
2004: 3.1 homicides per 100,000 people
- Washington’s murder rate in 2004: 3.1 per 100,000 people (18th lowest among the 50 states)
- U.S. murder rate in 2004: 5.5 per 100,000 people
- Total murders in Washington in 2004: 190
- Total murders in U.S. in 2004: 16,148
2005: 3.3 homicides per 100,000 people
- Washington’s murder rate in 2005: 3.3 per 100,000 people (18th lowest among the 50 states)
- U.S. murder rate in 2005: 5.6 per 100,000 people
- Total murders in Washington in 2005: 205
- Total murders in U.S. in 2005: 16,740
2006: 3.1 homicides per 100,000 people
- Washington’s murder rate in 2006: 3.1 per 100,000 people (16th lowest among the 50 states)
- U.S. murder rate in 2006: 5.8 per 100,000 people
- Total murders in Washington in 2006: 197
- Total murders in U.S. in 2006: 17,309
2007: 2.7 homicides per 100,000 people
- Washington’s murder rate in 2007: 2.7 per 100,000 people (11th lowest among the 50 states)
- U.S. murder rate in 2007: 5.7 per 100,000 people
- Total murders in Washington in 2007: 174
- Total murders in U.S. in 2007: 17,128
2008: 2.9 homicides per 100,000 people
- Washington’s murder rate in 2008: 2.9 per 100,000 people (14th lowest among the 50 states)
- U.S. murder rate in 2008: 5.4 per 100,000 people
- Total murders in Washington in 2008: 193
- Total murders in U.S. in 2008: 16,465
2009: 2.9 homicides per 100,000 people
- Washington’s murder rate in 2009: 2.9 per 100,000 people (15th lowest among the 50 states)
- U.S. murder rate in 2009: 5.0 per 100,000 people
- Total murders in Washington in 2009: 190
- Total murders in U.S. in 2009: 15,399
2010: 2.3 homicides per 100,000 people
- Washington’s murder rate in 2010: 2.3 per 100,000 people (11th lowest among the 50 states)
- U.S. murder rate in 2010: 4.8 per 100,000 people
- Total murders in Washington in 2010: 154
- Total murders in U.S. in 2010: 14,722
2011: 2.4 homicides per 100,000 people
- Washington’s murder rate in 2011: 2.4 per 100,000 people (11th lowest among the 50 states)
- U.S. murder rate in 2011: 4.7 per 100,000 people
- Total murders in Washington in 2011: 163
- Total murders in U.S. in 2011: 14,661
2012: 3.1 homicides per 100,000 people
- Washington’s murder rate in 2012: 3.1 per 100,000 people (19th lowest among the 50 states)
- U.S. murder rate in 2012: 4.7 per 100,000 people
- Total murders in Washington in 2012: 217
- Total murders in U.S. in 2012: 14,856
2013: 2.4 homicides per 100,000 people
- Washington’s murder rate in 2013: 2.4 per 100,000 people (14th lowest among the 50 states)
- U.S. murder rate in 2013: 4.5 per 100,000 people
- Total murders in Washington in 2013: 167
- Total murders in U.S. in 2013: 14,319
2014: 2.5 homicides per 100,000 people
- Washington’s murder rate in 2014: 2.5 per 100,000 people (13th lowest among the 50 states)
- U.S. murder rate in 2014: 4.4 per 100,000 people
- Total murders in Washington in 2014: 178
- Total murders in U.S. in 2014: 14,164
2015: 3.0 homicides per 100,000 people
- Washington’s murder rate in 2015: 3.0 per 100,000 people (14th lowest among the 50 states)
- U.S. murder rate in 2015: 4.9 per 100,000 people
- Total murders in Washington in 2015: 218
- Total murders in U.S. in 2015: 15,883
2016: 2.7 homicides per 100,000 people
- Washington’s murder rate in 2016: 2.7 per 100,000 people (12th lowest among the 50 states)
- U.S. murder rate in 2016: 5.4 per 100,000 people
- Total murders in Washington in 2016: 195
- Total murders in U.S. in 2016: 17,413
2017: 3.0 homicides per 100,000 people
- Washington’s murder rate in 2017: 3.0 per 100,000 people (16th lowest among the 50 states)
- U.S. murder rate in 2017: 5.3 per 100,000 people
- Total murders in Washington in 2017: 226
- Total murders in U.S. in 2017: 17,294
2018: 3.1 homicides per 100,000 people
- Washington’s murder rate in 2018: 3.1 per 100,000 people (19th lowest among the 50 states)
- U.S. murder rate in 2018: 5.0 per 100,000 people
- Total murders in Washington in 2018: 236
- Total murders in U.S. in 2018: 16,374
2019: 2.7 homicides per 100,000 people
- Washington’s murder rate in 2019: 2.7 per 100,000 people (14th lowest among the 50 states)
- U.S. murder rate in 2019: 5.1 per 100,000 people
- Total murders in Washington in 2019: 205
- Total murders in U.S. in 2019: 16,669
2020: 3.9 homicides per 100,000 people
- Washington’s murder rate in 2020: 3.9 per 100,000 people (16th lowest among the 50 states)
- U.S. murder rate in 2020: 6.5 per 100,000 people
- Total murders in Washington in 2020: 301
- Total murders in U.S. in 2020: 21,570
| Year | Murder per 100,000 people in Washington | Murder per 100,000 people in U.S. | Total murders in Washington | Total murders in U.S. |
|---|---|---|---|---|
| 1995 | 5.1 | 8.2 | 275 | 21,606 |
| 1996 | 4.6 | 7.4 | 255 | 19,645 |
| 1997 | 4.3 | 6.8 | 244 | 18,211 |
| 1998 | 3.9 | 6.3 | 224 | 16,974 |
| 1999 | 3.0 | 5.7 | 171 | 15,522 |
| 2000 | 3.3 | 5.5 | 196 | 15,586 |
| 2001 | 3.0 | 5.6 | 179 | 16,037 |
| 2002 | 3.0 | 5.6 | 184 | 16,229 |
| 2003 | 3.0 | 5.7 | 182 | 16,528 |
| 2004 | 3.1 | 5.5 | 190 | 16,148 |
| 2005 | 3.3 | 5.6 | 205 | 16,740 |
| 2006 | 3.1 | 5.8 | 197 | 17,309 |
| 2007 | 2.7 | 5.7 | 174 | 17,128 |
| 2008 | 2.9 | 5.4 | 193 | 16,465 |
| 2009 | 2.9 | 5.0 | 190 | 15,399 |
| 2010 | 2.3 | 4.8 | 154 | 14,722 |
| 2011 | 2.4 | 4.7 | 163 | 14,661 |
| 2012 | 3.1 | 4.7 | 217 | 14,856 |
| 2013 | 2.4 | 4.5 | 167 | 14,319 |
| 2014 | 2.5 | 4.4 | 178 | 14,164 |
| 2015 | 3.0 | 4.9 | 218 | 15,883 |
| 2016 | 2.7 | 5.4 | 195 | 17,413 |
| 2017 | 3.0 | 5.3 | 226 | 17,294 |
| 2018 | 3.1 | 5.0 | 236 | 16,374 |
| 2019 | 2.7 | 5.1 | 205 | 16,669 |
| 2020 | 3.9 | 6.5 | 301 | 21,570 |
Contact [email protected] for any questions or corrections.