The coordinated terrorist attacks of September 11, 2001, stand as one of the deadliest events in U.S. history. That day, nearly 3,000 Americans were violently killed in New York, Pennsylvania, and outside Washington, D.C. — the most in any single day since the Battle of Antietam 139 years earlier. While the United States has not suffered through anything approaching the scale of 9/11 in the years since, the FBI maintains that the threat of terrorism has expanded considerably in the last two decades.
The threat of terrorism — whether of international or domestic origin — has grown, in part, due to a shift toward individual offenders acting alone and away from large-scale conspiracies. Because lone offenders have no affiliation or communication with a larger group, they are more difficult for law enforcement to detect and prevent. The Internet and social media have fueled this trend by acting as platforms for radicalization and recruitment.
According to the Department of Homeland Security, domestic terrorism investigations have more than quadrupled in the last 10 years. Between 2010 and 2021 alone, there were 231 reported incidents of domestic terrorism in the United States. The largest share of these attacks — 35% — were determined to have been racially or ethnically motivated, and 32% were fueled by anti-government ideologies.
While violent terrorist plots have been carried out across the country in recent decades, the bulk of them have occurred in or around major metropolitan areas.
Using data from the National Consortium For the Study of Terrorism and Responses to Terrorism — or START, a joint project between the DHS and University of Maryland — 24/7 Wall St. identified the American cities with the most terrorist attacks. Cities in the U.S. are ranked by the total number of terrorist incidents between 1970 and 2021 as reported in the START Global Terrorism Database.
To be considered a terrorist act by START, an incident must have been intentional, carried out by a non-state actor, and have involved violence or the threat of violence. Additionally, to be counted, an incident must meet at least two of the following criteria: it is aimed at attaining a political, religious, social, or economic reform goal; it is intended to send a message to a broader audience than the immediate victims; or it occurs outside the context of legitimate war. Notably, this list includes some incidents for which it remains unclear whether these criteria were fully met.
Among the 35 cities on this list, the number of terrorist attacks reported between 1970 and 2021 ranges from 10 to nearly 480. Cumulatively, these cities account for 49% of all terrorist attacks in the U.S. over that period.
In most of these cities, bombings were the most common type of attack. Other types of terrorism reported in these places include armed assaults, assassinations, and attacks on infrastructure. Targets of these attacks have included abortion facilities, businesses, educational institutions, government officials, private citizens, religious figures, military and police buildings, and service members.
These are the U.S. cities most frequently targeted by terrorist attacks.
Why It Matters

The terrorist attacks of Sept. 11, 2001 killed nearly 3,000 people and forever altered the course of American history. In the more than two decades since, the threat terrorism poses to the United States has expanded, as attacks carried out by individuals acting alone have grown increasingly common. While the events of September 11 stand as the single deadliest terror attack in U.S. history, terrorism was a constant threat decades before 9/11, and remains so today.
35. Cambridge, Massachusetts

- Total terrorist attacks in city, 1970-2021: 10 (0.3% of all terrorist acts in U.S.)
- Total fatalities resulting from terror attacks, 1970-2021: 1 victim, 0 perpetrators
- Total non-fatally wounded in terror attacks, 1970-2021: 0
- Decade with the most terrorist attacks in city, 1970-2021: 1970s (6 terrorist attacks)
- Most common terrorist attack types in city: Bombing/Explosion (70.0% of total), Facility/Infrastructure Attack (10.0% of total)
- Most common terrorist attack targets in city: Educational Institutions (50.0% of total), Businesses (20.0% of total)
34. Olympia, Washington

- Total terrorist attacks in city, 1970-2021: 10 (0.3% of all terrorist acts in U.S.)
- Total fatalities resulting from terror attacks, 1970-2021: 0
- Total non-fatally wounded in terror attacks, 1970-2021: 2 victims, 1 perpetrator
- Decade with the most terrorist attacks in city, 1970-2021: 1990s (3 terrorist attacks)
- Most common terrorist attack types in city: Facility/Infrastructure Attack (60.0% of total), Bombing/Explosion (30.0% of total)
- Most common terrorist attack targets in city: Government Institutions (30.0% of total), Businesses (20.0% of total)
33. Milwaukee, Wisconsin

- Total terrorist attacks in city, 1970-2021: 10 (0.3% of all terrorist acts in U.S.)
- Total fatalities resulting from terror attacks, 1970-2021: 1 victim, 0 perpetrators
- Total non-fatally wounded in terror attacks, 1970-2021: 1 victim, 0 perpetrators
- Decade with the most terrorist attacks in city, 1970-2021: 1970s (7 terrorist attacks)
- Most common terrorist attack types in city: Bombing/Explosion (70.0% of total), Facility/Infrastructure Attack (20.0% of total)
- Most common terrorist attack targets in city: Businesses (30.0% of total), Government Institutions (10.0% of total)
32. Cincinnati, Ohio

- Total terrorist attacks in city, 1970-2021: 10 (0.3% of all terrorist acts in U.S.)
- Total fatalities resulting from terror attacks, 1970-2021: 2 victims, 0 perpetrators
- Total non-fatally wounded in terror attacks, 1970-2021: 0
- Decade with the most terrorist attacks in city, 1970-2021: 1980s (4 terrorist attacks)
- Most common terrorist attack types in city: Bombing/Explosion (50.0% of total), Facility/Infrastructure Attack (40.0% of total)
- Most common terrorist attack targets in city: Abortion Facilities (70.0% of total), Private Citizens & Property (10.0% of total)
31. Bloomington, Indiana

- Total terrorist attacks in city, 1970-2021: 10 (0.3% of all terrorist acts in U.S.)
- Total fatalities resulting from terror attacks, 1970-2021: 1 victim, 1 perpetrator
- Total non-fatally wounded in terror attacks, 1970-2021: 2 victims, 0 perpetrators
- Decade with the most terrorist attacks in city, 1970-2021: 2000s (7 terrorist attacks)
- Most common terrorist attack types in city: Facility/Infrastructure Attack (70.0% of total), Armed Assault (10.0% of total)
- Most common terrorist attack targets in city: Private Citizens & Property (40.0% of total), Religious Figures/Institutions (20.0% of total)
30. Palo Alto, California

- Total terrorist attacks in city, 1970-2021: 11 (0.4% of all terrorist acts in U.S.)
- Total fatalities resulting from terror attacks, 1970-2021: 0
- Total non-fatally wounded in terror attacks, 1970-2021: 0
- Decade with the most terrorist attacks in city, 1970-2021: 1970s (11 terrorist attacks)
- Most common terrorist attack types in city: Bombing/Explosion (54.5% of total), Facility/Infrastructure Attack (36.4% of total)
- Most common terrorist attack targets in city: Educational Institutions (63.6% of total), Businesses (18.2% of total)
29. Cairo, Illinois
- Total terrorist attacks in city, 1970-2021: 11 (0.4% of all terrorist acts in U.S.)
- Total fatalities resulting from terror attacks, 1970-2021: 1 victim, 0 perpetrators
- Total non-fatally wounded in terror attacks, 1970-2021: 5 victims, 1 perpetrator
- Decade with the most terrorist attacks in city, 1970-2021: 1970s (11 terrorist attacks)
- Most common terrorist attack types in city: Armed Assault (63.6% of total), Facility/Infrastructure Attack (27.3% of total)
- Most common terrorist attack targets in city: Police (54.5% of total), Government Institutions (18.2% of total)
28. Baton Rouge, Louisiana

- Total terrorist attacks in city, 1970-2021: 11 (0.4% of all terrorist acts in U.S.)
- Total fatalities resulting from terror attacks, 1970-2021: 5 victims, 1 perpetrator
- Total non-fatally wounded in terror attacks, 1970-2021: 3 victims, 0 perpetrators
- Decade with the most terrorist attacks in city, 1970-2021: 1970s (4 terrorist attacks)
- Most common terrorist attack types in city: Bombing/Explosion (36.4% of total), Armed Assault (36.4% of total)
- Most common terrorist attack targets in city: Abortion Facilities (27.3% of total), Private Citizens & Property (27.3% of total)
27. Dallas, Texas

- Total terrorist attacks in city, 1970-2021: 11 (0.4% of all terrorist acts in U.S.)
- Total fatalities resulting from terror attacks, 1970-2021: 7 victims, 2 perpetrators
- Total non-fatally wounded in terror attacks, 1970-2021: 11 victims, 0 perpetrators
- Decade with the most terrorist attacks in city, 1970-2021: 1980s (4 terrorist attacks)
- Most common terrorist attack types in city: Facility/Infrastructure Attack (45.5% of total), Armed Assault (36.4% of total)
- Most common terrorist attack targets in city: Abortion Facilities (27.3% of total), Government Institutions (18.2% of total)
26. Eugene, Oregon

- Total terrorist attacks in city, 1970-2021: 12 (0.4% of all terrorist acts in U.S.)
- Total fatalities resulting from terror attacks, 1970-2021: 0
- Total non-fatally wounded in terror attacks, 1970-2021: 1 victim, 0 perpetrators
- Decade with the most terrorist attacks in city, 1970-2021: 1970s (4 terrorist attacks)
- Most common terrorist attack types in city: Facility/Infrastructure Attack (75.0% of total), Bombing/Explosion (25.0% of total)
- Most common terrorist attack targets in city: Businesses (41.7% of total), Educational Institutions (33.3% of total)
25. Tampa, Florida

- Total terrorist attacks in city, 1970-2021: 12 (0.4% of all terrorist acts in U.S.)
- Total fatalities resulting from terror attacks, 1970-2021: 2 victims, 1 perpetrator
- Total non-fatally wounded in terror attacks, 1970-2021: 0
- Decade with the most terrorist attacks in city, 1970-2021: 2010s (6 terrorist attacks)
- Most common terrorist attack types in city: Facility/Infrastructure Attack (66.7% of total), Unknown (8.3% of total)
- Most common terrorist attack targets in city: Religious Figures/Institutions (33.3% of total), Businesses (16.7% of total)
24. Philadelphia, Pennsylvania

- Total terrorist attacks in city, 1970-2021: 12 (0.4% of all terrorist acts in U.S.)
- Total fatalities resulting from terror attacks, 1970-2021: 2 victims, 1 perpetrator
- Total non-fatally wounded in terror attacks, 1970-2021: 7 victims, 0 perpetrators
- Decade with the most terrorist attacks in city, 1970-2021: 1970s (4 terrorist attacks)
- Most common terrorist attack types in city: Facility/Infrastructure Attack (33.3% of total), Armed Assault (25.0% of total)
- Most common terrorist attack targets in city: Private Citizens & Property (25.0% of total), Religious Figures/Institutions (16.7% of total)
23. Pittsburgh, Pennsylvania

- Total terrorist attacks in city, 1970-2021: 12 (0.4% of all terrorist acts in U.S.)
- Total fatalities resulting from terror attacks, 1970-2021: 18 victims, 1 perpetrator
- Total non-fatally wounded in terror attacks, 1970-2021: 17 victims, 1 perpetrator
- Decade with the most terrorist attacks in city, 1970-2021: 2000s (6 terrorist attacks)
- Most common terrorist attack types in city: Armed Assault (66.7% of total), Bombing/Explosion (16.7% of total)
- Most common terrorist attack targets in city: Businesses (50.0% of total), Religious Figures/Institutions (25.0% of total)
22. Fresno, California

- Total terrorist attacks in city, 1970-2021: 14 (0.5% of all terrorist acts in U.S.)
- Total fatalities resulting from terror attacks, 1970-2021: 4 victims, 0 perpetrators
- Total non-fatally wounded in terror attacks, 1970-2021: 2 victims, 0 perpetrators
- Decade with the most terrorist attacks in city, 1970-2021: 1970s (6 terrorist attacks)
- Most common terrorist attack types in city: Bombing/Explosion (57.1% of total), Assassination (14.3% of total)
- Most common terrorist attack targets in city: Government Institutions (28.6% of total), Private Citizens & Property (21.4% of total)
21. Albuquerque, New Mexico

- Total terrorist attacks in city, 1970-2021: 15 (0.5% of all terrorist acts in U.S.)
- Total fatalities resulting from terror attacks, 1970-2021: 0
- Total non-fatally wounded in terror attacks, 1970-2021: 0
- Decade with the most terrorist attacks in city, 1970-2021: 1990s (8 terrorist attacks)
- Most common terrorist attack types in city: Facility/Infrastructure Attack (73.3% of total), Bombing/Explosion (26.7% of total)
- Most common terrorist attack targets in city: Abortion Facilities (53.3% of total), Businesses (26.7% of total)
20. Phoenix, Arizona

- Total terrorist attacks in city, 1970-2021: 15 (0.5% of all terrorist acts in U.S.)
- Total fatalities resulting from terror attacks, 1970-2021: 0
- Total non-fatally wounded in terror attacks, 1970-2021: 3 victims, 0 perpetrators
- Decade with the most terrorist attacks in city, 1970-2021: 2000s (6 terrorist attacks)
- Most common terrorist attack types in city: Facility/Infrastructure Attack (66.7% of total), Bombing/Explosion (26.7% of total)
- Most common terrorist attack targets in city: Private Citizens & Property (40.0% of total), Government Institutions (20.0% of total)
19. Detroit, Michigan

- Total terrorist attacks in city, 1970-2021: 15 (0.5% of all terrorist acts in U.S.)
- Total fatalities resulting from terror attacks, 1970-2021: 2 victims, 2 perpetrators
- Total non-fatally wounded in terror attacks, 1970-2021: 4 victims, 1 perpetrator
- Decade with the most terrorist attacks in city, 1970-2021: 1970s (9 terrorist attacks)
- Most common terrorist attack types in city: Bombing/Explosion (33.3% of total), Armed Assault (26.7% of total)
- Most common terrorist attack targets in city: Police (33.3% of total), Government Institutions (13.3% of total)
18. Atlanta, Georgia

- Total terrorist attacks in city, 1970-2021: 15 (0.5% of all terrorist acts in U.S.)
- Total fatalities resulting from terror attacks, 1970-2021: 7 victims, 0 perpetrators
- Total non-fatally wounded in terror attacks, 1970-2021: 88 victims, 0 perpetrators
- Decade with the most terrorist attacks in city, 1970-2021: 1970s (4 terrorist attacks)
- Most common terrorist attack types in city: Bombing/Explosion (46.7% of total), Armed Assault (26.7% of total)
- Most common terrorist attack targets in city: Businesses (40.0% of total), Military (6.7% of total)
17. San Jose, California

- Total terrorist attacks in city, 1970-2021: 18 (0.6% of all terrorist acts in U.S.)
- Total fatalities resulting from terror attacks, 1970-2021: 1 victim, 0 perpetrators
- Total non-fatally wounded in terror attacks, 1970-2021: 1 victim, 0 perpetrators
- Decade with the most terrorist attacks in city, 1970-2021: 1970s (15 terrorist attacks)
- Most common terrorist attack types in city: Bombing/Explosion (55.6% of total), Facility/Infrastructure Attack (38.9% of total)
- Most common terrorist attack targets in city: Businesses (44.4% of total), Military (16.7% of total)
16. Kansas City, Missouri
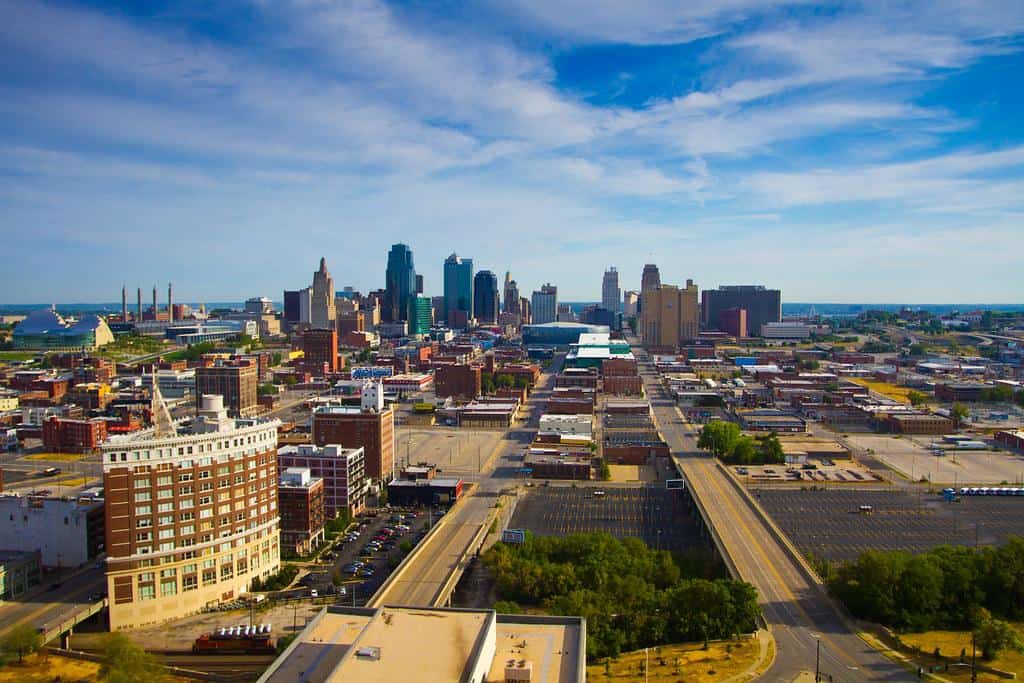
- Total terrorist attacks in city, 1970-2021: 19 (0.7% of all terrorist acts in U.S.)
- Total fatalities resulting from terror attacks, 1970-2021: 0
- Total non-fatally wounded in terror attacks, 1970-2021: 17 victims, 0 perpetrators
- Decade with the most terrorist attacks in city, 1970-2021: 1970s (8 terrorist attacks)
- Most common terrorist attack types in city: Bombing/Explosion (42.1% of total), Facility/Infrastructure Attack (36.8% of total)
- Most common terrorist attack targets in city: Private Citizens & Property (26.3% of total), Government Institutions (15.8% of total)
15. Sacramento, California

- Total terrorist attacks in city, 1970-2021: 20 (0.7% of all terrorist acts in U.S.)
- Total fatalities resulting from terror attacks, 1970-2021: 5 victims, 0 perpetrators
- Total non-fatally wounded in terror attacks, 1970-2021: 1 victim, 0 perpetrators
- Decade with the most terrorist attacks in city, 1970-2021: 1970s (9 terrorist attacks)
- Most common terrorist attack types in city: Facility/Infrastructure Attack (40.0% of total), Bombing/Explosion (35.0% of total)
- Most common terrorist attack targets in city: Businesses (25.0% of total), Religious Figures/Institutions (25.0% of total)
14. Houston, Texas

- Total terrorist attacks in city, 1970-2021: 21 (0.7% of all terrorist acts in U.S.)
- Total fatalities resulting from terror attacks, 1970-2021: 2 victims, 0 perpetrators
- Total non-fatally wounded in terror attacks, 1970-2021: 3 victims, 0 perpetrators
- Decade with the most terrorist attacks in city, 1970-2021: 1970s (7 terrorist attacks)
- Most common terrorist attack types in city: Facility/Infrastructure Attack (42.9% of total), Bombing/Explosion (33.3% of total)
- Most common terrorist attack targets in city: Abortion Facilities (28.6% of total), Private Citizens & Property (19.0% of total)
13. Boston, Massachusetts

- Total terrorist attacks in city, 1970-2021: 21 (0.7% of all terrorist acts in U.S.)
- Total fatalities resulting from terror attacks, 1970-2021: 4 victims, 0 perpetrators
- Total non-fatally wounded in terror attacks, 1970-2021: 293 victims, 0 perpetrators
- Decade with the most terrorist attacks in city, 1970-2021: 1970s (12 terrorist attacks)
- Most common terrorist attack types in city: Bombing/Explosion (47.6% of total), Facility/Infrastructure Attack (42.9% of total)
- Most common terrorist attack targets in city: Religious Figures/Institutions (28.6% of total), Private Citizens & Property (19.0% of total)
12. Oakland, California

- Total terrorist attacks in city, 1970-2021: 22 (0.8% of all terrorist acts in U.S.)
- Total fatalities resulting from terror attacks, 1970-2021: 2 victims, 0 perpetrators
- Total non-fatally wounded in terror attacks, 1970-2021: 9 victims, 0 perpetrators
- Decade with the most terrorist attacks in city, 1970-2021: 1970s (19 terrorist attacks)
- Most common terrorist attack types in city: Bombing/Explosion (81.8% of total), Armed Assault (9.1% of total)
- Most common terrorist attack targets in city: Businesses (36.4% of total), Police (18.2% of total)
11. San Diego, California

- Total terrorist attacks in city, 1970-2021: 23 (0.8% of all terrorist acts in U.S.)
- Total fatalities resulting from terror attacks, 1970-2021: 0
- Total non-fatally wounded in terror attacks, 1970-2021: 1 victim, 0 perpetrators
- Decade with the most terrorist attacks in city, 1970-2021: 1970s (6 terrorist attacks)
- Most common terrorist attack types in city: Bombing/Explosion (47.8% of total), Facility/Infrastructure Attack (39.1% of total)
- Most common terrorist attack targets in city: Businesses (43.5% of total), Military (13.0% of total)
10. Denver, Colorado

- Total terrorist attacks in city, 1970-2021: 24 (0.8% of all terrorist acts in U.S.)
- Total fatalities resulting from terror attacks, 1970-2021: 3 victims, 0 perpetrators
- Total non-fatally wounded in terror attacks, 1970-2021: 4 victims, 0 perpetrators
- Decade with the most terrorist attacks in city, 1970-2021: 1970s (15 terrorist attacks)
- Most common terrorist attack types in city: Bombing/Explosion (50.0% of total), Facility/Infrastructure Attack (41.7% of total)
- Most common terrorist attack targets in city: Private Citizens & Property (37.5% of total), Government Institutions (16.7% of total)
9. Portland, Oregon

- Total terrorist attacks in city, 1970-2021: 26 (0.9% of all terrorist acts in U.S.)
- Total fatalities resulting from terror attacks, 1970-2021: 3 victims, 0 perpetrators
- Total non-fatally wounded in terror attacks, 1970-2021: 3 victims, 1 perpetrator
- Decade with the most terrorist attacks in city, 1970-2021: 1970s (10 terrorist attacks)
- Most common terrorist attack types in city: Facility/Infrastructure Attack (46.2% of total), Bombing/Explosion (42.3% of total)
- Most common terrorist attack targets in city: Government Institutions (26.9% of total), Abortion Facilities (23.1% of total)
8. Berkeley, California

- Total terrorist attacks in city, 1970-2021: 34 (1.2% of all terrorist acts in U.S.)
- Total fatalities resulting from terror attacks, 1970-2021: 2 victims, 0 perpetrators
- Total non-fatally wounded in terror attacks, 1970-2021: 17 victims, 0 perpetrators
- Decade with the most terrorist attacks in city, 1970-2021: 1970s (26 terrorist attacks)
- Most common terrorist attack types in city: Bombing/Explosion (70.6% of total), Facility/Infrastructure Attack (20.6% of total)
- Most common terrorist attack targets in city: Businesses (41.2% of total), Educational Institutions (29.4% of total)
7. Seattle, Washington

- Total terrorist attacks in city, 1970-2021: 43 (1.5% of all terrorist acts in U.S.)
- Total fatalities resulting from terror attacks, 1970-2021: 4 victims, 1 perpetrator
- Total non-fatally wounded in terror attacks, 1970-2021: 6 victims, 1 perpetrator
- Decade with the most terrorist attacks in city, 1970-2021: 1970s (26 terrorist attacks)
- Most common terrorist attack types in city: Bombing/Explosion (60.5% of total), Facility/Infrastructure Attack (23.3% of total)
- Most common terrorist attack targets in city: Businesses (39.5% of total), Private Citizens & Property (14.0% of total)
6. Chicago, Illinois

- Total terrorist attacks in city, 1970-2021: 59 (2.0% of all terrorist acts in U.S.)
- Total fatalities resulting from terror attacks, 1970-2021: 3 victims, 0 perpetrators
- Total non-fatally wounded in terror attacks, 1970-2021: 19 victims, 3 perpetrators
- Decade with the most terrorist attacks in city, 1970-2021: 1970s (47 terrorist attacks)
- Most common terrorist attack types in city: Bombing/Explosion (69.5% of total), Facility/Infrastructure Attack (15.3% of total)
- Most common terrorist attack targets in city: Businesses (32.2% of total), Government Institutions (20.3% of total)
5. Miami, Florida

- Total terrorist attacks in city, 1970-2021: 88 (3.0% of all terrorist acts in U.S.)
- Total fatalities resulting from terror attacks, 1970-2021: 9 victims, 0 perpetrators
- Total non-fatally wounded in terror attacks, 1970-2021: 3 victims, 0 perpetrators
- Decade with the most terrorist attacks in city, 1970-2021: 1970s (48 terrorist attacks)
- Most common terrorist attack types in city: Bombing/Explosion (72.7% of total), Facility/Infrastructure Attack (11.4% of total)
- Most common terrorist attack targets in city: Businesses (40.9% of total), Journalists & Media (14.8% of total)
4. Washington, District of Columbia

- Total terrorist attacks in city, 1970-2021: 92 (3.2% of all terrorist acts in U.S.)
- Total fatalities resulting from terror attacks, 1970-2021: 18 victims, 3 perpetrators
- Total non-fatally wounded in terror attacks, 1970-2021: 137 victims, 69 perpetrators
- Decade with the most terrorist attacks in city, 1970-2021: 1970s (44 terrorist attacks)
- Most common terrorist attack types in city: Bombing/Explosion (55.4% of total), Armed Assault (13.0% of total)
- Most common terrorist attack targets in city: Government Institutions (35.9% of total), Diplomatic Institutions (28.3% of total)
3. San Francisco, California

- Total terrorist attacks in city, 1970-2021: 102 (3.5% of all terrorist acts in U.S.)
- Total fatalities resulting from terror attacks, 1970-2021: 23 victims, 0 perpetrators
- Total non-fatally wounded in terror attacks, 1970-2021: 18 victims, 1 perpetrator
- Decade with the most terrorist attacks in city, 1970-2021: 1970s (91 terrorist attacks)
- Most common terrorist attack types in city: Bombing/Explosion (52.9% of total), Armed Assault (23.5% of total)
- Most common terrorist attack targets in city: Private Citizens & Property (30.4% of total), Businesses (20.6% of total)
2. Los Angeles, California

- Total terrorist attacks in city, 1970-2021: 114 (3.9% of all terrorist acts in U.S.)
- Total fatalities resulting from terror attacks, 1970-2021: 13 victims, 1 perpetrator
- Total non-fatally wounded in terror attacks, 1970-2021: 49 victims, 1 perpetrator
- Decade with the most terrorist attacks in city, 1970-2021: 1970s (69 terrorist attacks)
- Most common terrorist attack types in city: Bombing/Explosion (69.3% of total), Facility/Infrastructure Attack (18.4% of total)
- Most common terrorist attack targets in city: Businesses (28.1% of total), Government Institutions (17.5% of total)
1. New York City, New York
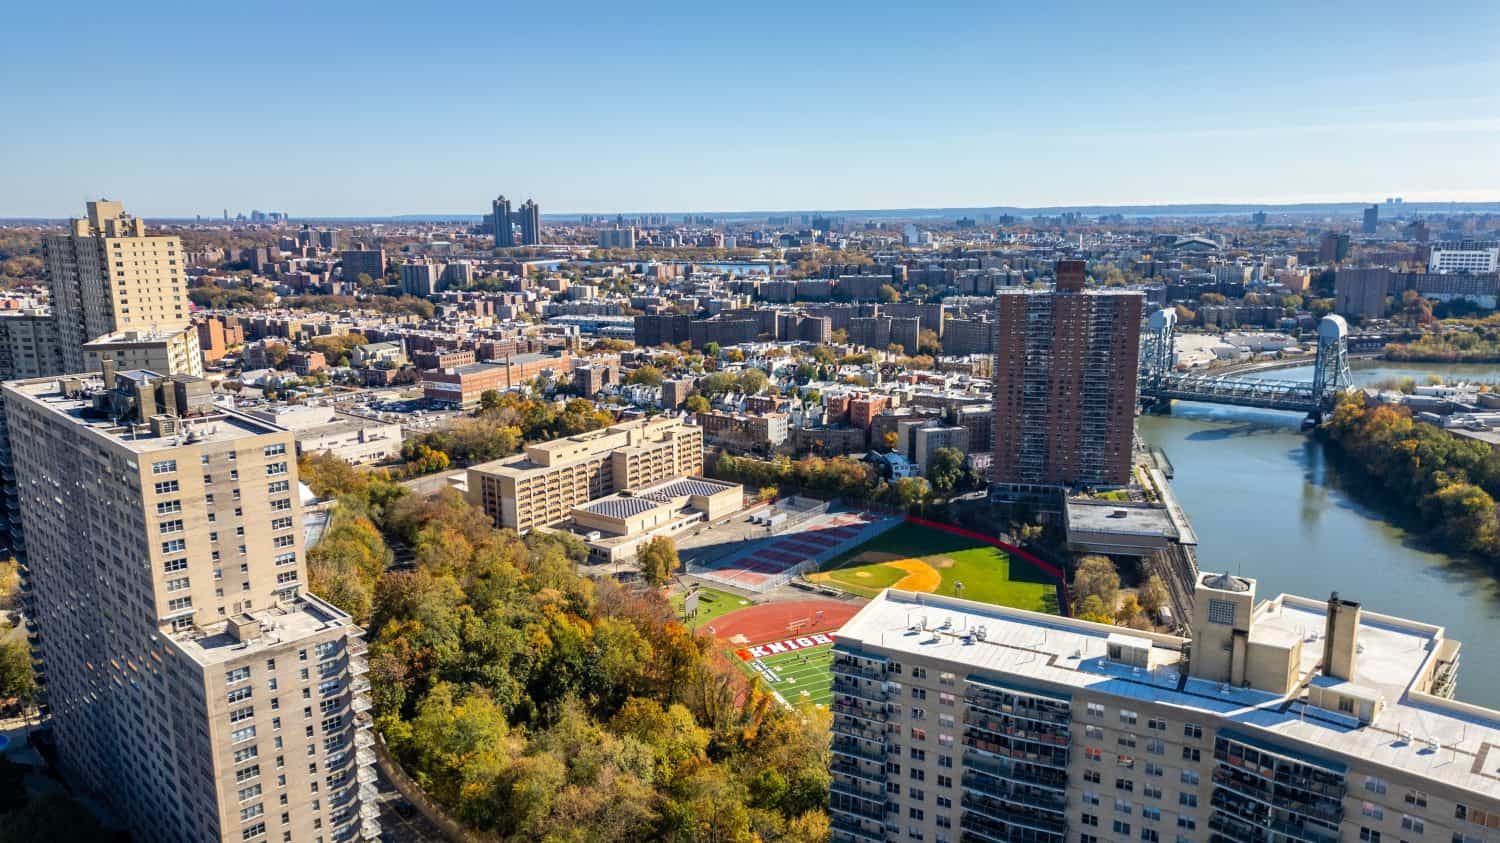
- Total terrorist attacks in city, 1970-2021: 478 (16.5% of all terrorist acts in U.S.)
- Total fatalities resulting from terror attacks, 1970-2021: 2,831 victims, 14 perpetrators
- Total non-fatally wounded in terror attacks, 1970-2021: 22,173 victims, 5 perpetrators
- Decade with the most terrorist attacks in city, 1970-2021: 1970s (328 terrorist attacks)
- Most common terrorist attack types in city: Bombing/Explosion (57.7% of total), Facility/Infrastructure Attack (19.5% of total)
- Most common terrorist attack targets in city: Businesses (38.7% of total), Diplomatic Institutions (15.3% of total)
Contact [email protected] for any questions or corrections.