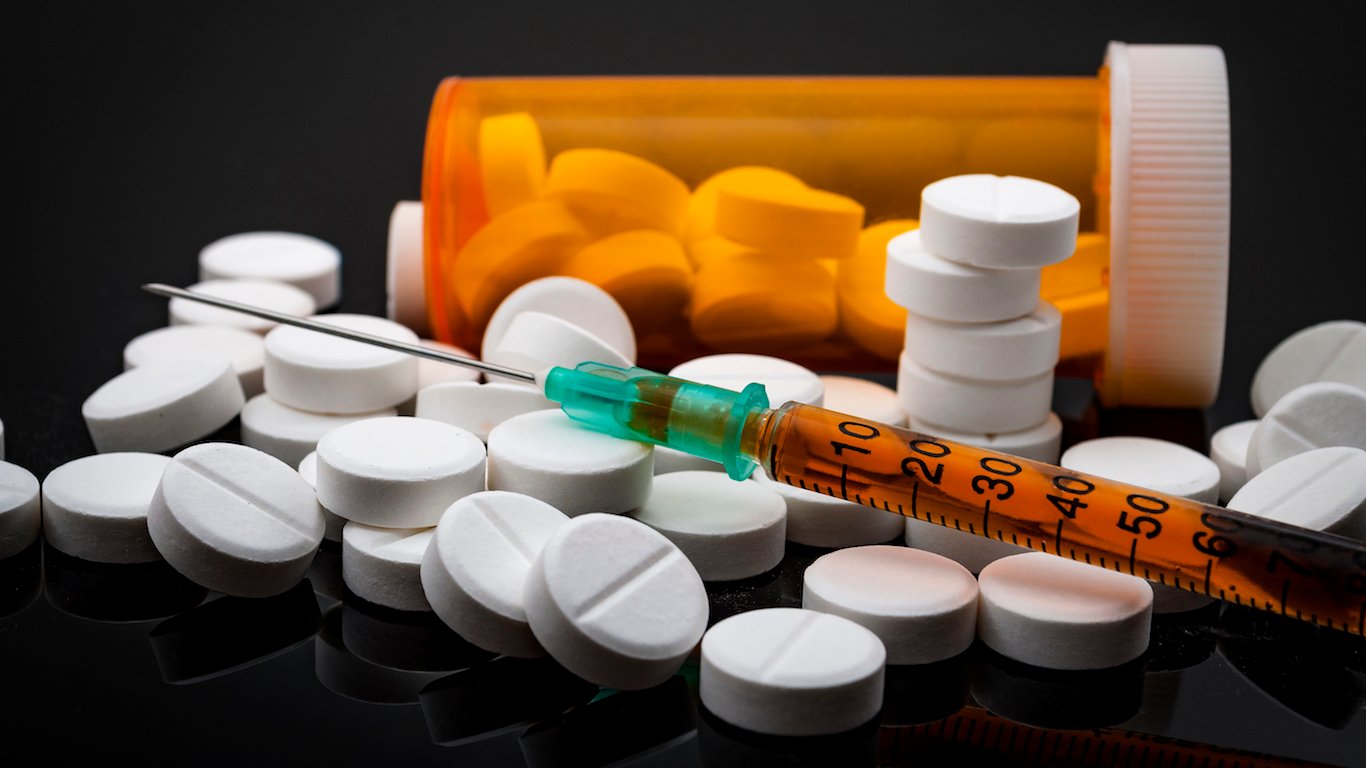
The U.S. has experienced a massive surge in drug addiction, and consequently fatal overdoses, in recent years. In 1999, the National Institute on Drug Abuse reported an age-adjusted rate of 6.1 fatal overdoses per 100,000 Americans. By 2019, that figure had more than tripled to 21.6 fatal drug overdoses per 100,000 people.
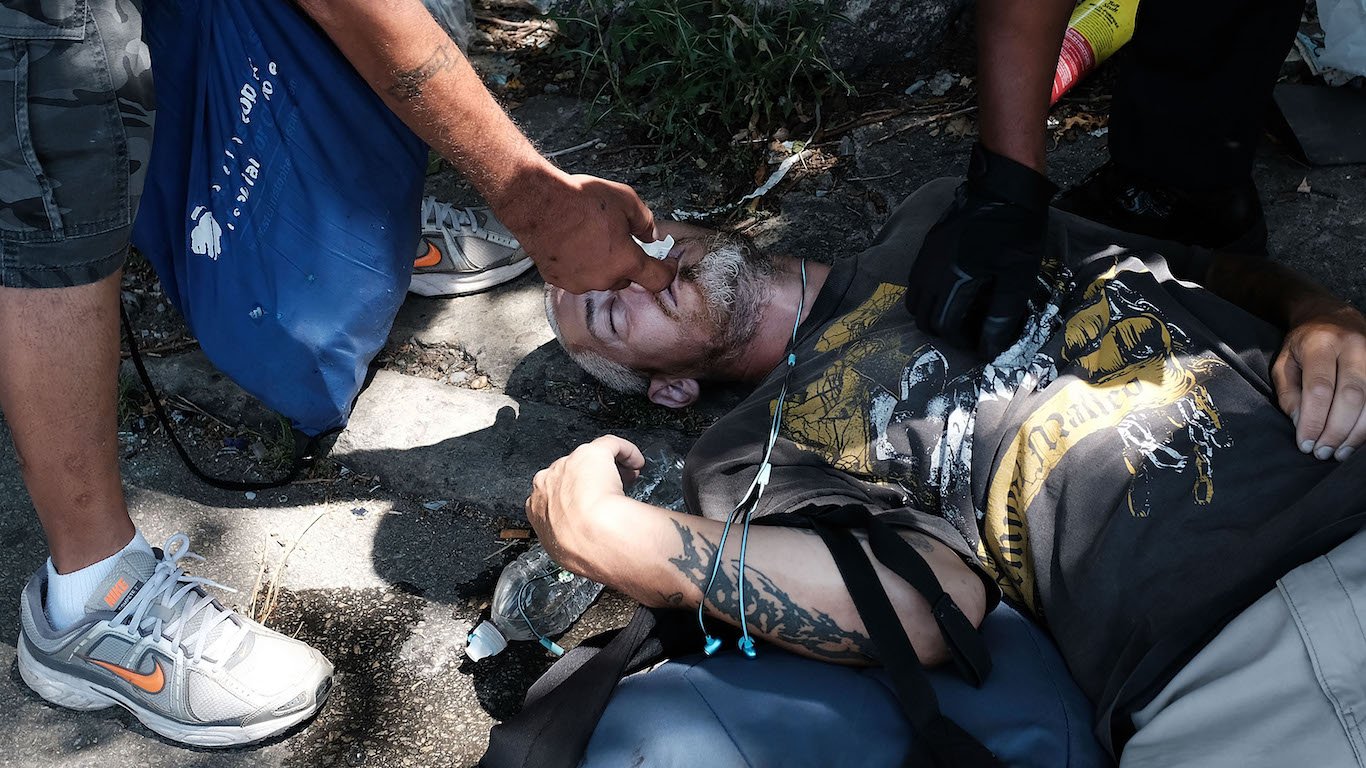
While this problem has affected every part of the country, certain areas struggle with an outsized share of drug overdose deaths. To determine the county with the worst drug problem in every state, 24/7 Tempo reviewed the annual average number of drug-related deaths per 100,000 residents in all U.S. counties and county equivalents from 2015 to 2019, using data from the Centers for Disease Control and Prevention.
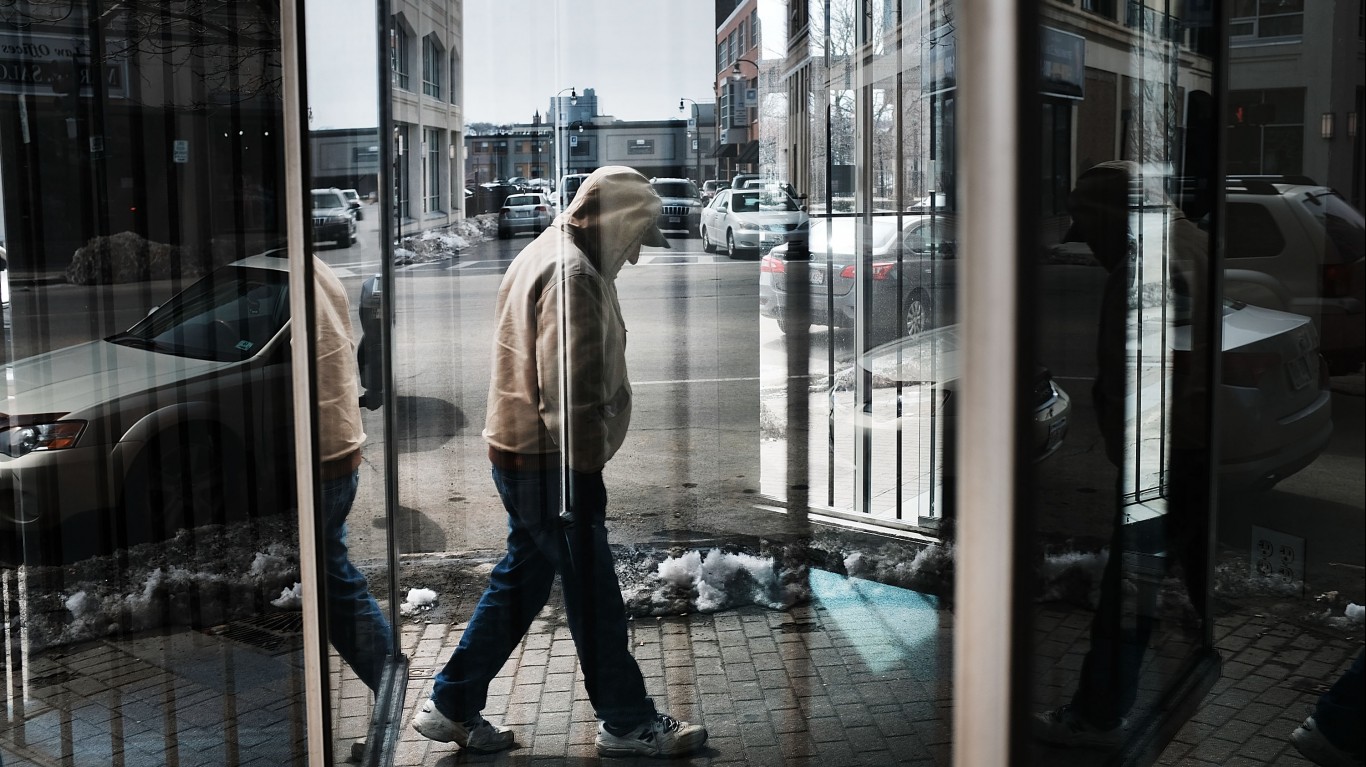
Addiction and drug use are complicated and multifaceted issues that touch Americans nationwide and at all socioeconomic levels. Still, the counties that have the worst drug problems tend to have certain characteristics in common, including relatively lower income, higher unemployment, and higher poverty. This is the poorest county in every state.
Of the 75 counties in Arkansas, Lincoln has the highest age-adjusted rate of drug overdose deaths at 33 deaths per 100,000 residents, more than double the state rate.
Overdose death rates have increased significantly over the last two decades, with the toll highest among the least educated people. People with lower educational attainment tend to earn lower incomes than those with higher education. Only about 9.7% of Lincoln County residents have at least a bachelor’s degree, the second lowest share in the state and less than three times the national share of 32.1%.
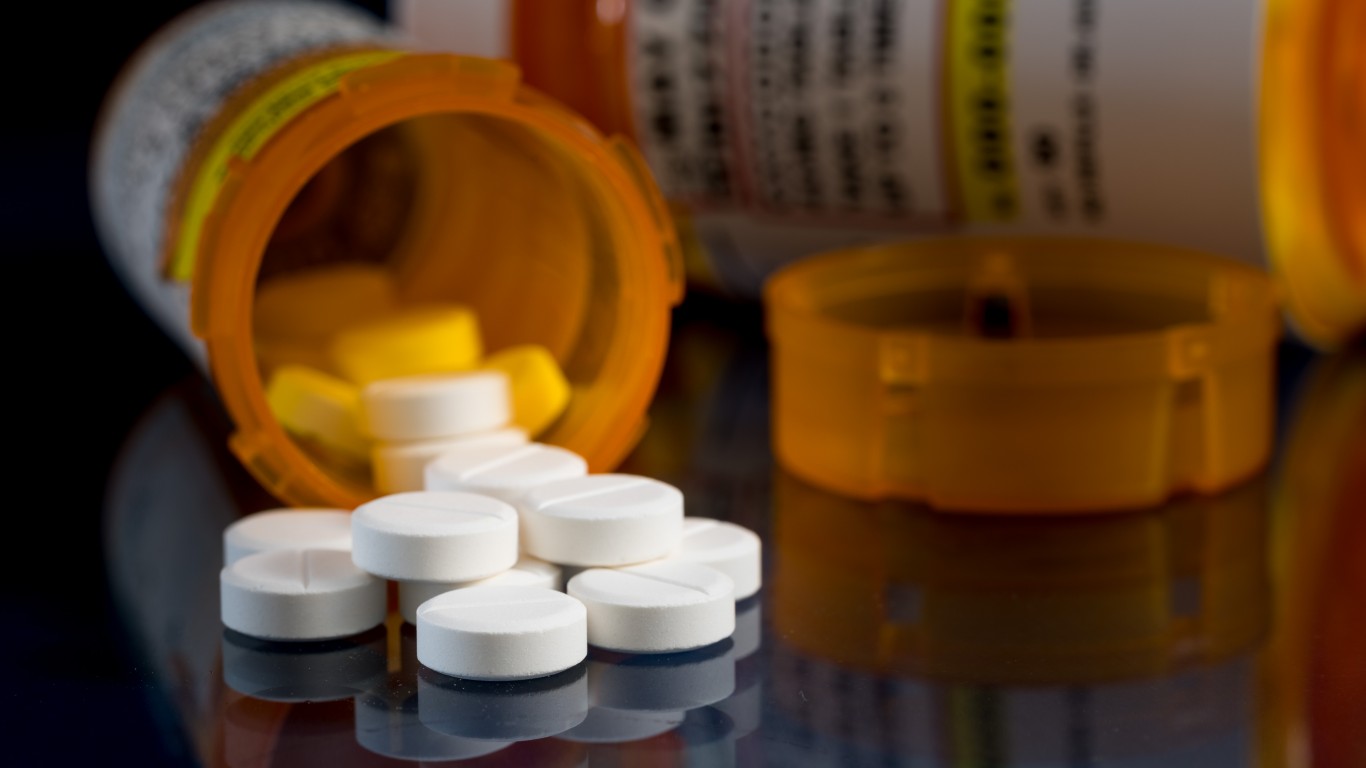
As Americans have looked for answers as to how the drug problem in the country has gotten so severe, much of the blame has been placed on large pharmaceutical companies — particularly Purdue Pharma. The company began selling the painkiller OxyContin in 1996. Since then, the company has paid over $10 billion to settle a litany of lawsuits that claimed Purdue deceived patients and doctors about the risks of becoming addicted to the drug when advertising it. These are America’s most hated companies.
| State | County | Counties in state | Annual drug deaths per 100,000 | Annual drug deaths per 100,000 (state) | Poverty rate | Poverty rate (state) | Median household income | Median household income (state) |
|---|---|---|---|---|---|---|---|---|
| Alabama | Jefferson County | 67 | 37.9 | 18.1 | 16.0% | 16.7% | $53,901 | $50,536 |
| Alaska | Juneau Borough | 29 | 27.9 | 18.7 | 7.7% | 10.7% | $88,390 | $77,640 |
| Arizona | Gila County | 15 | 38.4 | 23.5 | 21.6% | 15.1% | $43,524 | $58,945 |
| Arkansas | Lincoln County | 75 | 32.6 | 14.7 | 20.0% | 17.0% | $46,596 | $47,597 |
| California | Lake County | 58 | 55.9 | 14.1 | 18.6% | 13.4% | $47,040 | $75,235 |
| Colorado | Huerfano County | 64 | 59.5 | 18.1 | 15.8% | 10.3% | $38,137 | $72,331 |
| Connecticut | Windham County | 8 | 37.9 | 29.6 | 11.4% | 9.9% | $66,550 | $78,444 |
| Delaware | New Castle County | 3 | 37.4 | 35.2 | 11.4% | 11.8% | $73,892 | $68,287 |
| Florida | Brevard County | 67 | 40.5 | 23.1 | 11.8% | 14.0% | $56,775 | $55,660 |
| Georgia | Haralson County | 159 | 28.0 | 14.3 | 14.9% | 15.1% | $48,550 | $58,700 |
| Hawaii | Honolulu County | 5 | 16.0 | 15.5 | 8.3% | 9.4% | $85,857 | $81,275 |
| Idaho | Shoshone County | 44 | 34.9 | 15.1 | 19.4% | 13.1% | $39,386 | $55,785 |
| Illinois | Winnebago County | 102 | 41.5 | 20.0 | 15.6% | 12.5% | $54,489 | $65,886 |
| Indiana | Fayette County | 92 | 74.9 | 24.7 | 19.0% | 13.4% | $46,175 | $56,303 |
| Iowa | Polk County | 99 | 17.7 | 10.8 | 10.4% | 11.5% | $67,637 | $60,523 |
| Kansas | Saline County | 105 | 19.0 | 12.7 | 11.5% | 12.0% | $52,200 | $59,597 |
| Kentucky | Gallatin County | 120 | 77.8 | 33.3 | 14.8% | 17.3% | $52,167 | $50,589 |
| Louisiana | Washington Parish | 64 | 70.2 | 23.9 | 24.4% | 19.2% | $37,570 | $49,469 |
| Maine | Washington County | 16 | 42.5 | 27.6 | 18.9% | 11.8% | $41,347 | $57,918 |
| Maryland | Baltimore city | 24 | 93.5 | 34.8 | 21.2% | 9.2% | $50,379 | $84,805 |
| Massachusetts | Bristol County | 14 | 47.0 | 32.9 | 11.3% | 10.3% | $69,095 | $81,215 |
| Michigan | Wayne County | 83 | 43.0 | 27.0 | 22.3% | 14.4% | $47,301 | $57,144 |
| Minnesota | Mille Lacs County | 87 | 30.8 | 13.8 | 12.4% | 9.7% | $56,135 | $71,306 |
| Mississippi | Hancock County | 82 | 31.9 | 12.7 | 18.5% | 20.3% | $48,119 | $45,081 |
| Missouri | St. Louis city | 115 | 65.2 | 23.7 | 21.8% | 13.7% | $43,896 | $55,461 |
| Montana | Silver Bow County | 56 | 21.9 | 13.5 | 17.4% | 13.1% | $45,718 | $54,970 |
| Nebraska | Scotts Bluff County | 93 | 17.7 | 8.3 | 13.6% | 11.1% | $49,745 | $61,439 |
| Nevada | Nye County | 17 | 36.0 | 22.8 | 16.4% | 13.1% | $47,300 | $60,365 |
| New Hampshire | Hillsborough County | 10 | 42.5 | 34.2 | 7.8% | 7.6% | $81,460 | $76,768 |
| New Jersey | Camden County | 21 | 48.8 | 27.4 | 12.2% | 10.0% | $70,451 | $82,545 |
| New Mexico | Rio Arriba County | 33 | 79.9 | 26.3 | 24.0% | 19.1% | $39,952 | $49,754 |
| New York | Sullivan County | 62 | 37.2 | 19.0 | 15.2% | 14.1% | $57,426 | $68,486 |
| North Carolina | Jones County | 100 | 43.3 | 21.3 | 24.5% | 14.7% | $38,158 | $54,602 |
| North Dakota | Williams County | 53 | 15.3 | 10.4 | 6.1% | 10.7% | $87,161 | $64,894 |
| Ohio | Scioto County | 88 | 70.3 | 37.4 | 22.6% | 14.0% | $41,330 | $56,602 |
| Oklahoma | Johnston County | 77 | 38.1 | 19.4 | 20.9% | 15.7% | $41,332 | $52,919 |
| Oregon | Curry County | 36 | 26.4 | 16.3 | 12.4% | 13.2% | $48,440 | $62,818 |
| Pennsylvania | Philadelphia County | 67 | 55.5 | 35.4 | 24.3% | 12.4% | $45,927 | $61,744 |
| Rhode Island | Providence County | 5 | 33.6 | 30.4 | 15.2% | 12.4% | $58,974 | $67,167 |
| South Carolina | Horry County | 46 | 32.0 | 20.5 | 15.0% | 15.2% | $50,704 | $53,199 |
| South Dakota | Minnehaha County | 66 | 12.2 | 8.6 | 10.0% | 13.1% | $61,772 | $58,275 |
| Tennessee | Cheatham County | 95 | 54.2 | 27.9 | 10.6% | 15.2% | $61,913 | $53,320 |
| Texas | Tyler County | 254 | 23.2 | 10.9 | 16.5% | 14.7% | $44,497 | $61,874 |
| Utah | Carbon County | 29 | 45.1 | 21.5 | 16.8% | 9.8% | $51,158 | $71,621 |
| Vermont | Windham County | 14 | 37.8 | 22.1 | 13.7% | 10.9% | $51,985 | $61,973 |
| Virginia | Hopewell city | 133 | 41.6 | 17.0 | 23.6% | 10.6% | $39,030 | $74,222 |
| Washington | Grays Harbor County | 39 | 27.7 | 17.4 | 14.4% | 10.8% | $51,240 | $73,775 |
| West Virginia | Cabell County | 55 | 120.1 | 50.0 | 22.3% | 17.6% | $40,028 | $46,711 |
| Wisconsin | Milwaukee County | 72 | 36.0 | 19.1 | 19.0% | 11.3% | $50,606 | $61,747 |
| Wyoming | Carbon County | 23 | 28.9 | 14.5 | 12.4% | 11.0% | $60,161 | $64,049 |