
Key Points
- Upward economic mobility has grown increasingly difficult in the U.S. in recent decades — particularly for those at the lower end of the income spectrum.
- Nationwide, Americans born into a low-income household in the early 1990s earn an average of about $1,300 less at age 27 than those who were born into similar households in the late 1970s.
- However, there are still pockets of the U.S. where upward mobility is not a relic of the past.
- Also: Discover the next Nvidia
The American Dream is predicated on a belief that, through hard work and determination, any child born in the U.S. can climb the socioeconomic ladder and achieve their own version of success. But for Americans across the country, faith in this century-old concept has eroded in recent years. According to a 2024 survey from the Pew Research Center, 30% of adults say the American Dream is out of reach for them — up from just 17% in 2017. While these findings are based on personal, self-reported perceptions, an analysis of hard economic data shows that this growing pessimism is not unfounded.
According to Opportunity Insights, a Harvard based research organization, over 90% of Americans born in the 1940s earned more in adulthood than their parents did. Now, fewer than 50% of all Americans born in the 1980s earn more than their parents at a comparable age. A separate study from the same organization found that the average income of an American born into a low-income household in 1992 had an average household income of just $30,235 by age 27. Meanwhile, an American born into a similar household in 1978, earned an average income of $31,552 at age 27. These figures are both adjusted to 2023 dollars, and reflect a 4.2% decline in earnings for Americans born into households in the bottom 25% of the income spectrum.
The economic forces behind this shift include declining Gross Domestic Product growth rates as well as rising inequality of wealth distribution. While these conditions have had an adverse effect on upward mobility in much of the United States, there are parts of the country that have bucked the broader trend. In these places, incomes have only gone up for adults who were born into low-income households in recent decades.
Using data from Opportunity Insights, 24/7 Wall St. identified the counties where the American Dream is alive and well. We reviewed data at the county and county equivalent level on the average household income for Americans born into households in the bottom 25% of the income spectrum in both 1978 and 1992. Counties are ranked on the percent change in inflation-adjusted average household income among each cohort at age 27. A complete methodology is available here.
In each of the 49 counties and county equivalents on this list, average household earnings at age 27 increased by at least 15% for those born into low-income households in 1992 compared to those born into low-income households in 1978. In more practical terms, Americans who were born in low-income households in these places in 1992 earned an average of anywhere from $3,625 to $8,634 more at age 27 than those who were born in 1978. (Here is a look at the income you need to live comfortably in each state.)
The largest share of counties on this list — 38 out of 49 — are located in the South, including 11 in Georgia and seven in South Carolina. Another six are in the Midwest and five are in Western states. None of these counties are located in the Northeast. (Here is a look at the worst county to live in each state.)
Why It Matters

The ability to achieve success and financial stability through hard work has long been a cornerstone of the American Dream — but in recent decades, economic realities in communities across the country have left millions of Americans disillusioned. Still, there are parts of the country that have bucked the broader trend. In these places, upward mobility for the most financially disadvantaged residents has grown more likely, not less.
49. Allen County, Kansas
- Long-term change in avg. earnings for residents born into low-income households: +15.1% (+$4,764)
- Avg. earnings among adults born in 1978 into low-income households: $31,587 (inflation-adjusted)
- Avg. earnings among adults born in 1992 into low-income households: $36,351 (inflation-adjusted)
- 2023 unemployment rate: 2.8%
- Homeownership rate in 2022: 72.8%
- Poverty rate in 2022: 15.2%
- Total population: 12,554
48. Parmer County, Texas
- Long-term change in avg. earnings for residents born into low-income households: +15.4% (+$5,208)
- Avg. earnings among adults born in 1978 into low-income households: $33,926 (inflation-adjusted)
- Avg. earnings among adults born in 1992 into low-income households: $39,134 (inflation-adjusted)
- 2023 unemployment rate: 2.6%
- Homeownership rate in 2022: 71.2%
- Poverty rate in 2022: 9.5%
- Total population: 9,809
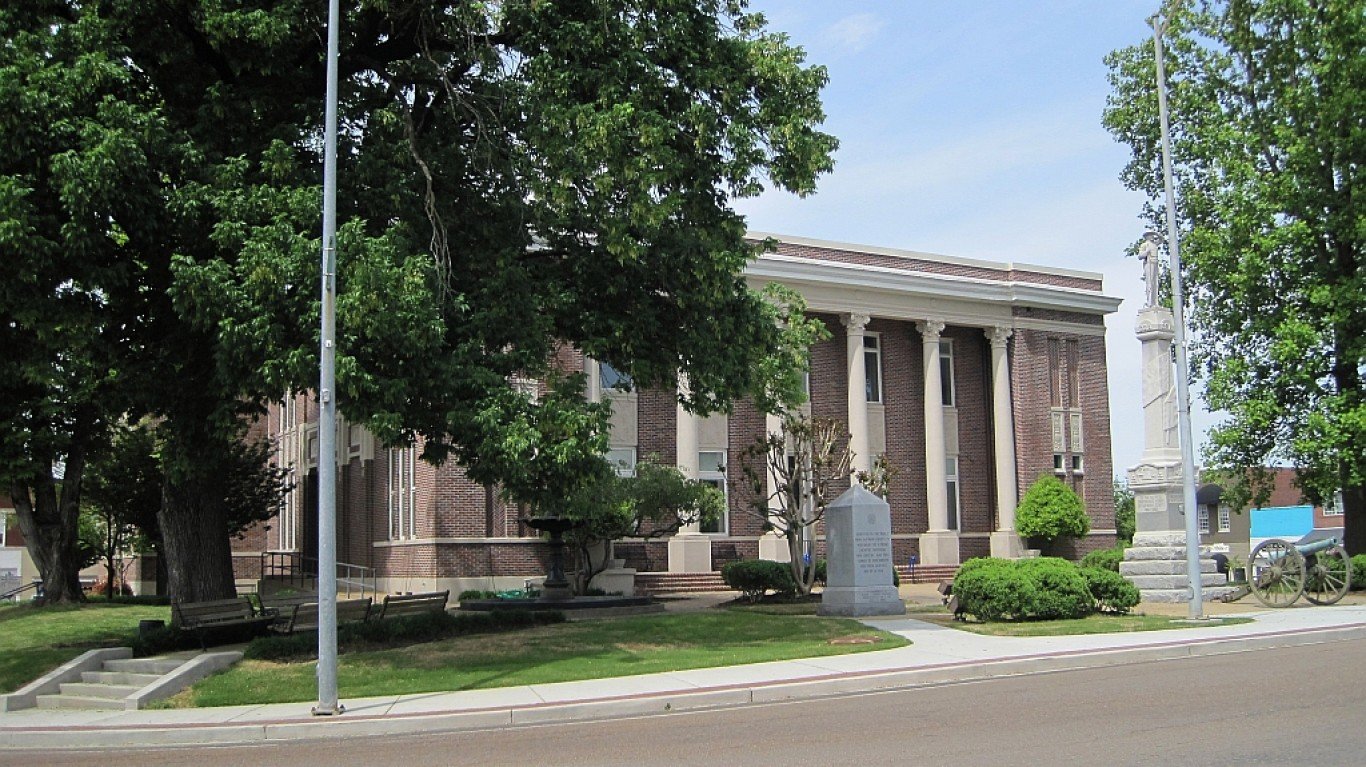
47. Perry County, Tennessee

- Long-term change in avg. earnings for residents born into low-income households: +15.5% (+$4,591)
- Avg. earnings among adults born in 1978 into low-income households: $29,701 (inflation-adjusted)
- Avg. earnings among adults born in 1992 into low-income households: $34,292 (inflation-adjusted)
- 2023 unemployment rate: 5.2%
- Homeownership rate in 2022: 76.2%
- Poverty rate in 2022: 14.2%
- Total population: 8,432
46. Cherokee County, South Carolina

- Long-term change in avg. earnings for residents born into low-income households: +15.5% (+$3,905)
- Avg. earnings among adults born in 1978 into low-income households: $25,167 (inflation-adjusted)
- Avg. earnings among adults born in 1992 into low-income households: $29,072 (inflation-adjusted)
- 2023 unemployment rate: 4.2%
- Homeownership rate in 2022: 70.8%
- Poverty rate in 2022: 18.0%
- Total population: 56,200
45. Pend Oreille County, Washington

- Long-term change in avg. earnings for residents born into low-income households: +15.6% (+$4,913)
- Avg. earnings among adults born in 1978 into low-income households: $31,562 (inflation-adjusted)
- Avg. earnings among adults born in 1992 into low-income households: $36,476 (inflation-adjusted)
- 2023 unemployment rate: 6.0%
- Homeownership rate in 2022: 76.1%
- Poverty rate in 2022: 12.9%
- Total population: 13,570
44. Union County, South Carolina

- Long-term change in avg. earnings for residents born into low-income households: +15.6% (+$3,933)
- Avg. earnings among adults born in 1978 into low-income households: $25,237 (inflation-adjusted)
- Avg. earnings among adults born in 1992 into low-income households: $29,170 (inflation-adjusted)
- 2023 unemployment rate: 4.1%
- Homeownership rate in 2022: 69.5%
- Poverty rate in 2022: 21.0%
- Total population: 27,158
43. St. Helena Parish, Louisiana

- Long-term change in avg. earnings for residents born into low-income households: +15.7% (+$3,812)
- Avg. earnings among adults born in 1978 into low-income households: $24,281 (inflation-adjusted)
- Avg. earnings among adults born in 1992 into low-income households: $28,093 (inflation-adjusted)
- 2023 unemployment rate: 5.3%
- Homeownership rate in 2022: 76.5%
- Poverty rate in 2022: 27.5%
- Total population: 10,872
42. Valley County, Montana

- Long-term change in avg. earnings for residents born into low-income households: +15.8% (+$5,818)
- Avg. earnings among adults born in 1978 into low-income households: $36,905 (inflation-adjusted)
- Avg. earnings among adults born in 1992 into low-income households: $42,723 (inflation-adjusted)
- 2023 unemployment rate: 2.5%
- Homeownership rate in 2022: 75.7%
- Poverty rate in 2022: 12.3%
- Total population: 7,552
41. Crisp County, Georgia

- Long-term change in avg. earnings for residents born into low-income households: +15.8% (+$3,649)
- Avg. earnings among adults born in 1978 into low-income households: $23,138 (inflation-adjusted)
- Avg. earnings among adults born in 1992 into low-income households: $26,787 (inflation-adjusted)
- 2023 unemployment rate: 3.7%
- Homeownership rate in 2022: 54.0%
- Poverty rate in 2022: 23.6%
- Total population: 20,255
40. Whitfield County, Georgia

- Long-term change in avg. earnings for residents born into low-income households: +15.8% (+$4,415)
- Avg. earnings among adults born in 1978 into low-income households: $27,952 (inflation-adjusted)
- Avg. earnings among adults born in 1992 into low-income households: $32,367 (inflation-adjusted)
- 2023 unemployment rate: 3.9%
- Homeownership rate in 2022: 67.9%
- Poverty rate in 2022: 13.5%
- Total population: 103,033
39. Carroll County, Indiana

- Long-term change in avg. earnings for residents born into low-income households: +15.9% (+$5,002)
- Avg. earnings among adults born in 1978 into low-income households: $31,473 (inflation-adjusted)
- Avg. earnings among adults born in 1992 into low-income households: $36,475 (inflation-adjusted)
- 2023 unemployment rate: 2.9%
- Homeownership rate in 2022: 79.4%
- Poverty rate in 2022: 7.3%
- Total population: 20,397
38. Reeves County, Texas

- Long-term change in avg. earnings for residents born into low-income households: +16.0% (+$5,779)
- Avg. earnings among adults born in 1978 into low-income households: $36,223 (inflation-adjusted)
- Avg. earnings among adults born in 1992 into low-income households: $42,002 (inflation-adjusted)
- 2023 unemployment rate: 3.1%
- Homeownership rate in 2022: 75.0%
- Poverty rate in 2022: 21.0%
- Total population: 14,022
37. Brewster County, Texas

- Long-term change in avg. earnings for residents born into low-income households: +16.0% (+$5,258)
- Avg. earnings among adults born in 1978 into low-income households: $32,894 (inflation-adjusted)
- Avg. earnings among adults born in 1992 into low-income households: $38,151 (inflation-adjusted)
- 2023 unemployment rate: 3.2%
- Homeownership rate in 2022: 59.9%
- Poverty rate in 2022: 15.7%
- Total population: 9,454
36. Chambers County, Alabama

- Long-term change in avg. earnings for residents born into low-income households: +16.0% (+$3,891)
- Avg. earnings among adults born in 1978 into low-income households: $24,247 (inflation-adjusted)
- Avg. earnings among adults born in 1992 into low-income households: $28,138 (inflation-adjusted)
- 2023 unemployment rate: 2.4%
- Homeownership rate in 2022: 72.2%
- Poverty rate in 2022: 17.9%
- Total population: 34,612
35. Bourbon County, Kentucky
- Long-term change in avg. earnings for residents born into low-income households: +16.1% (+$4,301)
- Avg. earnings among adults born in 1978 into low-income households: $26,648 (inflation-adjusted)
- Avg. earnings among adults born in 1992 into low-income households: $30,948 (inflation-adjusted)
- 2023 unemployment rate: 3.6%
- Homeownership rate in 2022: 64.7%
- Poverty rate in 2022: 15.1%
- Total population: 20,228
34. Hoke County, North Carolina

- Long-term change in avg. earnings for residents born into low-income households: +16.3% (+$3,728)
- Avg. earnings among adults born in 1978 into low-income households: $22,891 (inflation-adjusted)
- Avg. earnings among adults born in 1992 into low-income households: $26,619 (inflation-adjusted)
- 2023 unemployment rate: 4.4%
- Homeownership rate in 2022: 69.9%
- Poverty rate in 2022: 17.3%
- Total population: 52,612
33. Payette County, Idaho

- Long-term change in avg. earnings for residents born into low-income households: +16.3% (+$5,009)
- Avg. earnings among adults born in 1978 into low-income households: $30,662 (inflation-adjusted)
- Avg. earnings among adults born in 1992 into low-income households: $35,671 (inflation-adjusted)
- 2023 unemployment rate: 3.8%
- Homeownership rate in 2022: 70.8%
- Poverty rate in 2022: 10.6%
- Total population: 25,571
32. Union County, Georgia

- Long-term change in avg. earnings for residents born into low-income households: +16.3% (+$4,766)
- Avg. earnings among adults born in 1978 into low-income households: $29,154 (inflation-adjusted)
- Avg. earnings among adults born in 1992 into low-income households: $33,920 (inflation-adjusted)
- 2023 unemployment rate: 2.8%
- Homeownership rate in 2022: 81.4%
- Poverty rate in 2022: 11.7%
- Total population: 24,880
31. Monroe County, Mississippi

- Long-term change in avg. earnings for residents born into low-income households: +16.4% (+$4,257)
- Avg. earnings among adults born in 1978 into low-income households: $26,011 (inflation-adjusted)
- Avg. earnings among adults born in 1992 into low-income households: $30,269 (inflation-adjusted)
- 2023 unemployment rate: 3.8%
- Homeownership rate in 2022: 75.6%
- Poverty rate in 2022: 16.7%
- Total population: 34,168
30. Marlboro County, South Carolina
- Long-term change in avg. earnings for residents born into low-income households: +16.4% (+$3,636)
- Avg. earnings among adults born in 1978 into low-income households: $22,107 (inflation-adjusted)
- Avg. earnings among adults born in 1992 into low-income households: $25,743 (inflation-adjusted)
- 2023 unemployment rate: 7.2%
- Homeownership rate in 2022: 63.2%
- Poverty rate in 2022: 27.8%
- Total population: 26,585
29. San Juan County, Washington

- Long-term change in avg. earnings for residents born into low-income households: +16.5% (+$4,952)
- Avg. earnings among adults born in 1978 into low-income households: $29,990 (inflation-adjusted)
- Avg. earnings among adults born in 1992 into low-income households: $34,942 (inflation-adjusted)
- 2023 unemployment rate: 3.4%
- Homeownership rate in 2022: 77.5%
- Poverty rate in 2022: 11.0%
- Total population: 18,001
28. Haywood County, Tennessee
- Long-term change in avg. earnings for residents born into low-income households: +16.6% (+$3,879)
- Avg. earnings among adults born in 1978 into low-income households: $23,373 (inflation-adjusted)
- Avg. earnings among adults born in 1992 into low-income households: $27,252 (inflation-adjusted)
- 2023 unemployment rate: 4.4%
- Homeownership rate in 2022: 58.1%
- Poverty rate in 2022: 21.9%
- Total population: 17,806
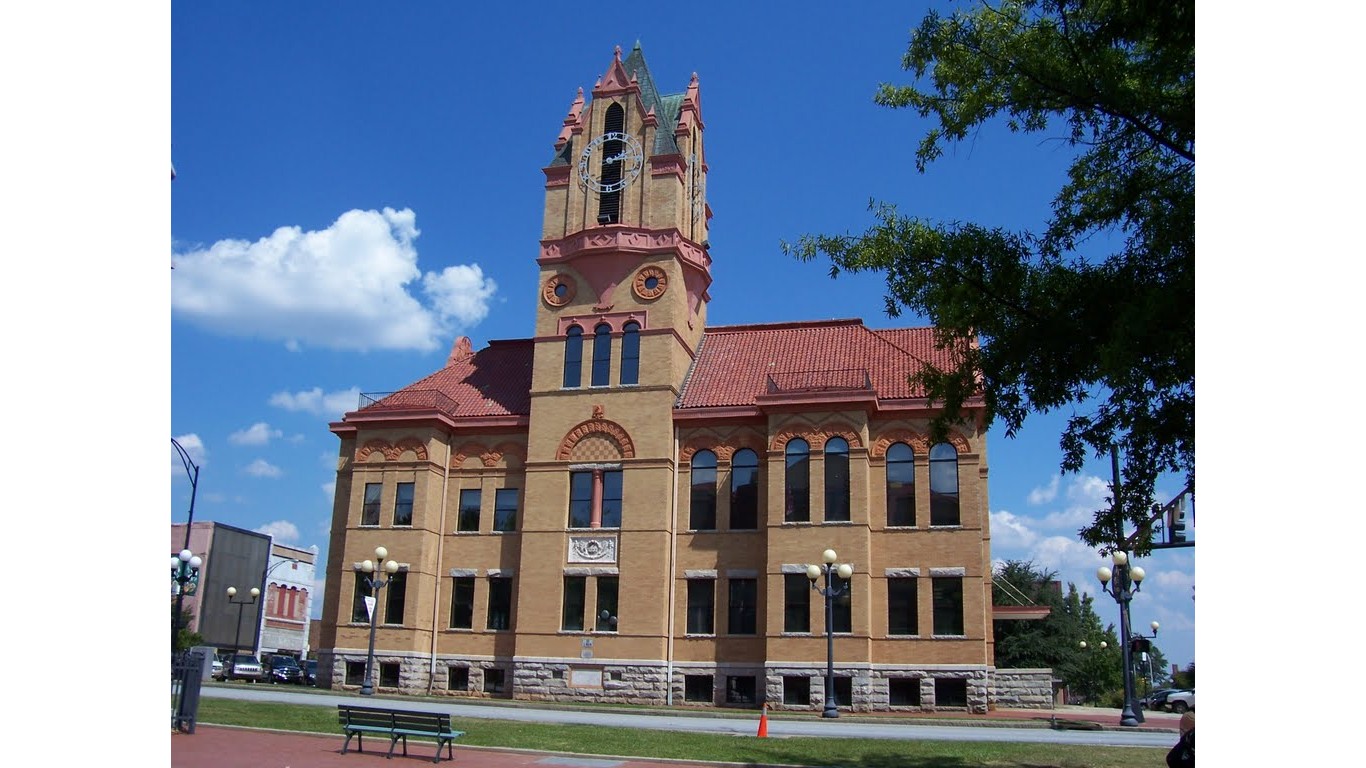
27. Greenwood County, South Carolina
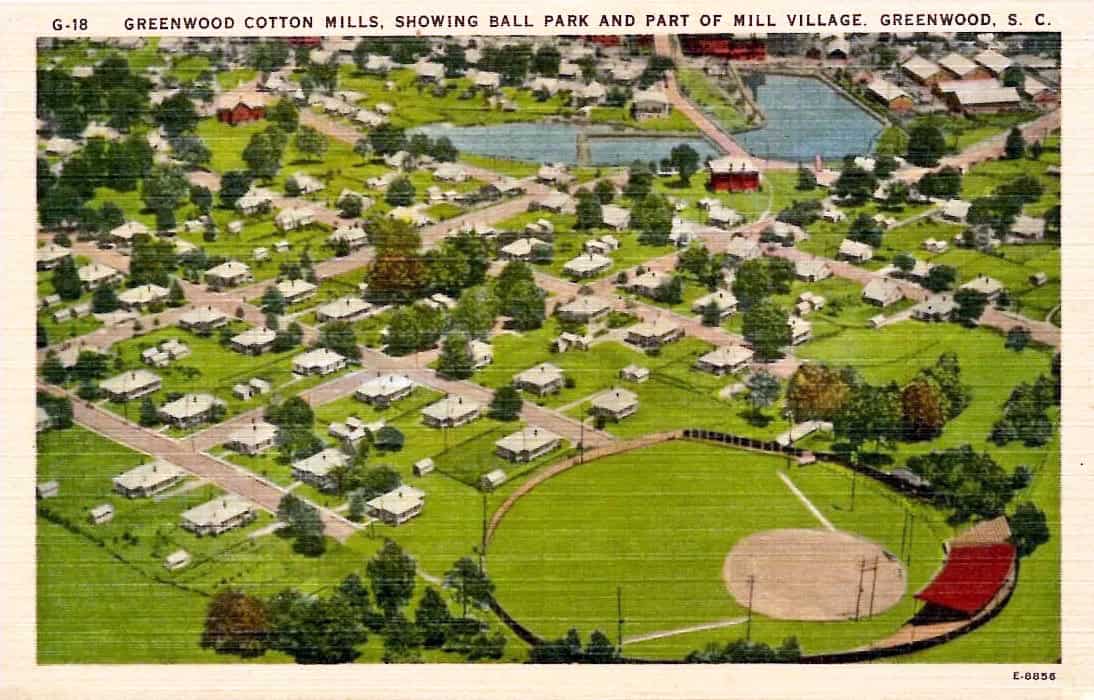
- Long-term change in avg. earnings for residents born into low-income households: +16.6% (+$4,069)
- Avg. earnings among adults born in 1978 into low-income households: $24,481 (inflation-adjusted)
- Avg. earnings among adults born in 1992 into low-income households: $28,551 (inflation-adjusted)
- 2023 unemployment rate: 3.5%
- Homeownership rate in 2022: 65.1%
- Poverty rate in 2022: 17.3%
- Total population: 69,309
26. LaGrange County, Indiana

- Long-term change in avg. earnings for residents born into low-income households: +16.9% (+$7,149)
- Avg. earnings among adults born in 1978 into low-income households: $42,200 (inflation-adjusted)
- Avg. earnings among adults born in 1992 into low-income households: $49,349 (inflation-adjusted)
- 2023 unemployment rate: 3.1%
- Homeownership rate in 2022: 83.0%
- Poverty rate in 2022: 5.7%
- Total population: 40,364
25. Tallahatchie County, Mississippi

- Long-term change in avg. earnings for residents born into low-income households: +17.1% (+$3,735)
- Avg. earnings among adults born in 1978 into low-income households: $21,792 (inflation-adjusted)
- Avg. earnings among adults born in 1992 into low-income households: $25,526 (inflation-adjusted)
- 2023 unemployment rate: 3.3%
- Homeownership rate in 2022: 63.7%
- Poverty rate in 2022: 25.7%
- Total population: 12,621
24. Terrell County, Georgia
- Long-term change in avg. earnings for residents born into low-income households: +17.3% (+$3,625)
- Avg. earnings among adults born in 1978 into low-income households: $20,923 (inflation-adjusted)
- Avg. earnings among adults born in 1992 into low-income households: $24,547 (inflation-adjusted)
- 2023 unemployment rate: 4.5%
- Homeownership rate in 2022: 58.8%
- Poverty rate in 2022: 29.8%
- Total population: 9,004
23. Anderson County, South Carolina
- Long-term change in avg. earnings for residents born into low-income households: +17.8% (+$4,684)
- Avg. earnings among adults born in 1978 into low-income households: $26,303 (inflation-adjusted)
- Avg. earnings among adults born in 1992 into low-income households: $30,987 (inflation-adjusted)
- 2023 unemployment rate: 2.8%
- Homeownership rate in 2022: 74.7%
- Poverty rate in 2022: 14.3%
- Total population: 204,592
22. Zavala County, Texas

- Long-term change in avg. earnings for residents born into low-income households: +18.0% (+$5,149)
- Avg. earnings among adults born in 1978 into low-income households: $28,551 (inflation-adjusted)
- Avg. earnings among adults born in 1992 into low-income households: $33,701 (inflation-adjusted)
- 2023 unemployment rate: 7.3%
- Homeownership rate in 2022: 72.5%
- Poverty rate in 2022: 31.0%
- Total population: 9,700
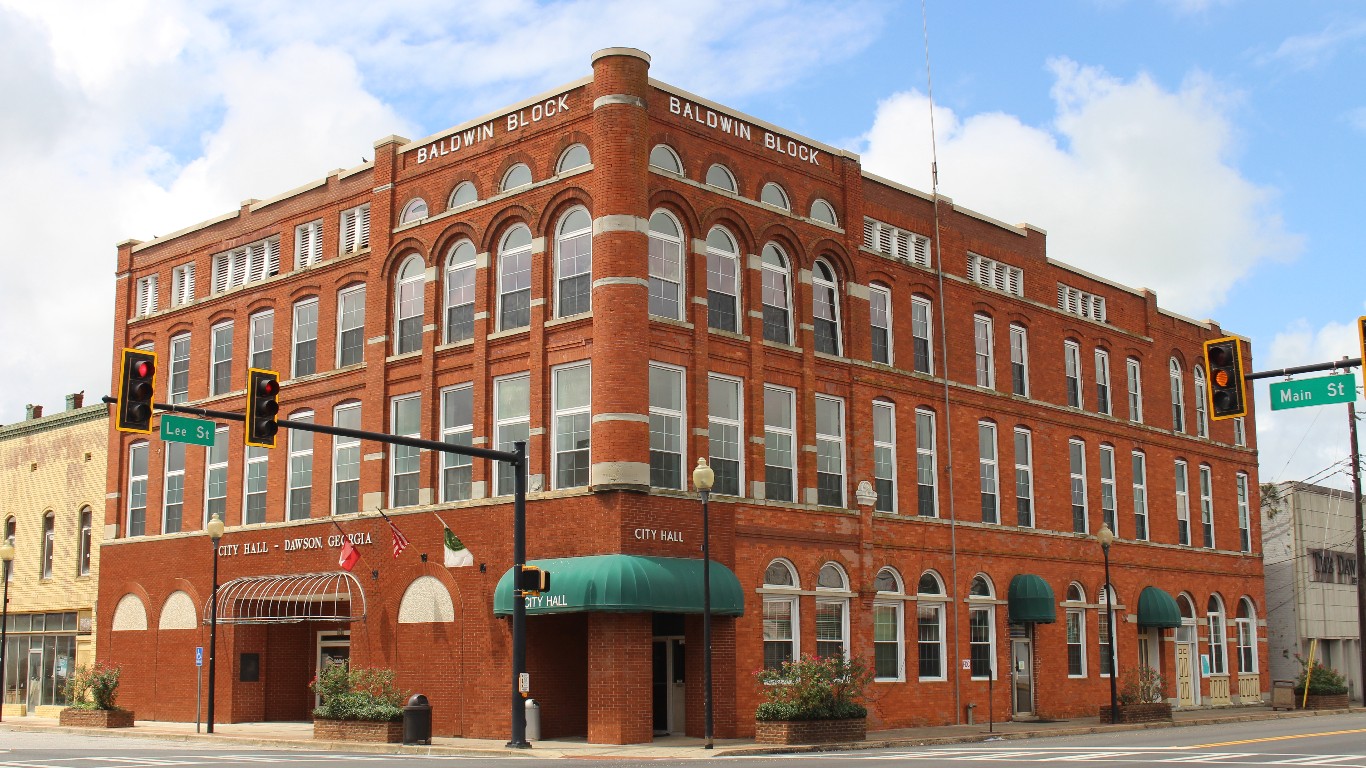
21. Early County, Georgia

- Long-term change in avg. earnings for residents born into low-income households: +18.1% (+$4,004)
- Avg. earnings among adults born in 1978 into low-income households: $22,087 (inflation-adjusted)
- Avg. earnings among adults born in 1992 into low-income households: $26,091 (inflation-adjusted)
- 2023 unemployment rate: 3.9%
- Homeownership rate in 2022: 67.6%
- Poverty rate in 2022: 22.2%
- Total population: 10,753
20. Crawford County, Georgia
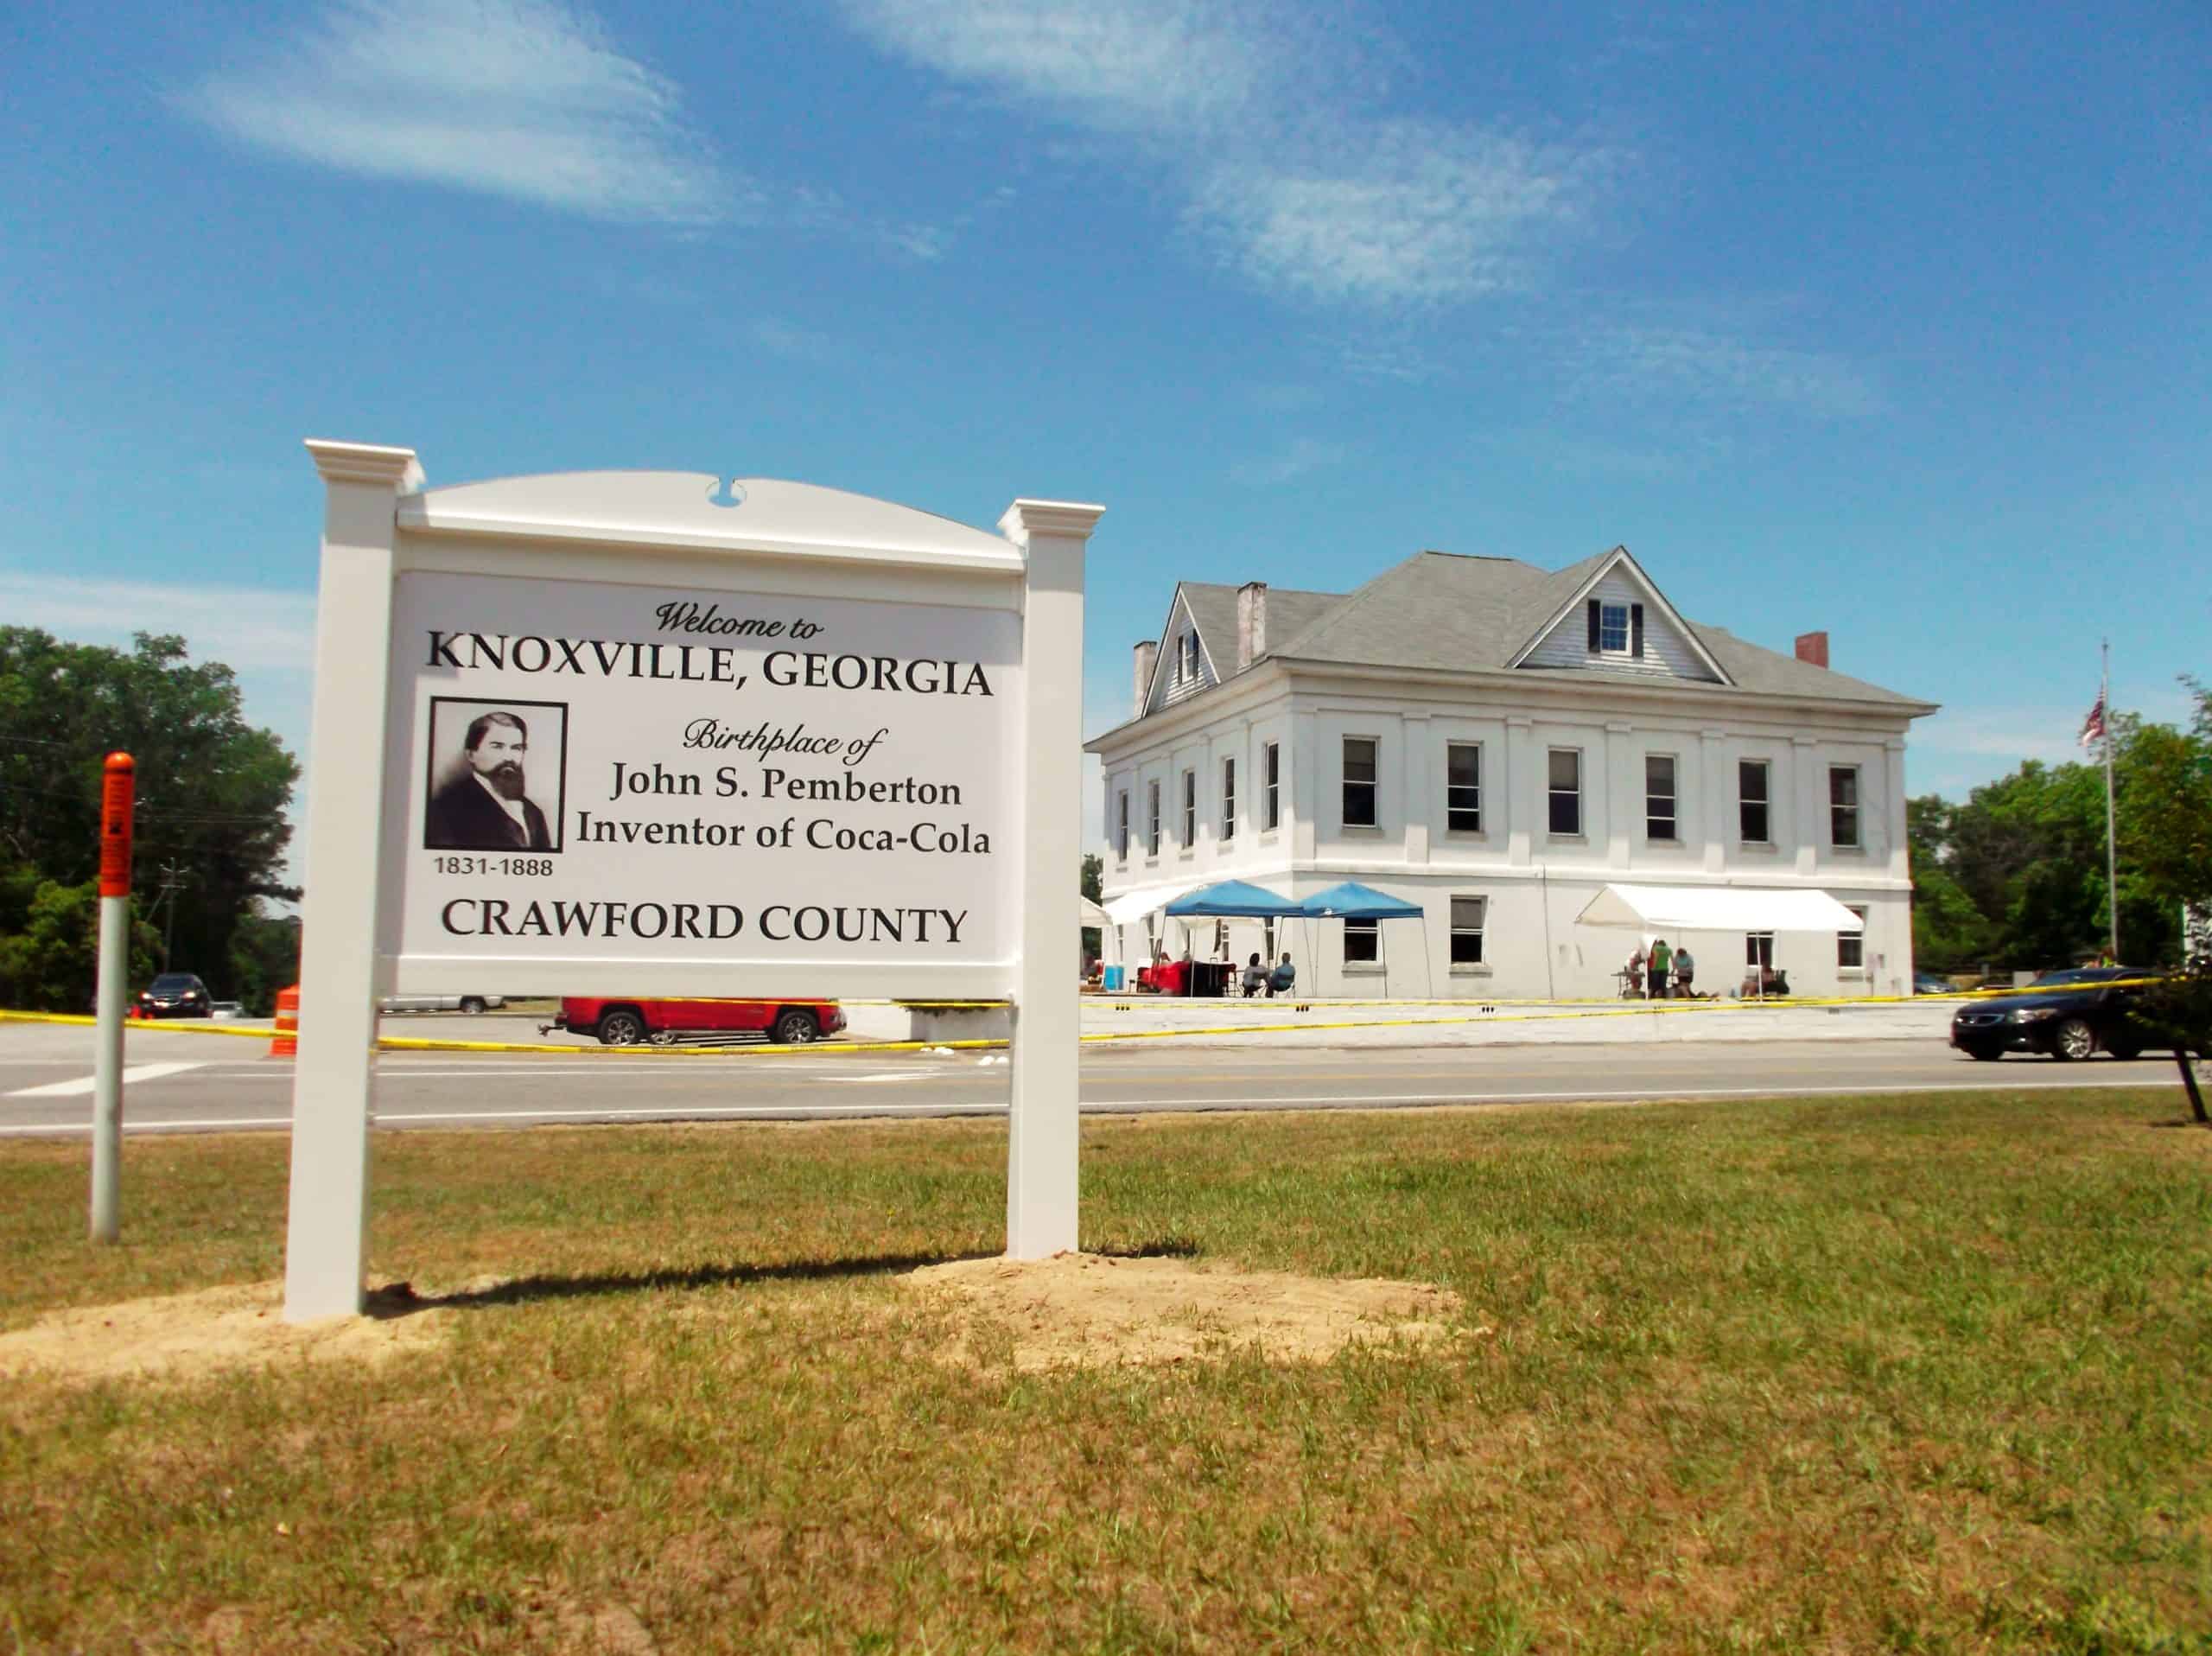
- Long-term change in avg. earnings for residents born into low-income households: +18.5% (+$4,647)
- Avg. earnings among adults born in 1978 into low-income households: $25,178 (inflation-adjusted)
- Avg. earnings among adults born in 1992 into low-income households: $29,825 (inflation-adjusted)
- 2023 unemployment rate: 3.2%
- Homeownership rate in 2022: 80.8%
- Poverty rate in 2022: 16.6%
- Total population: 12,156
19. Jenkins County, Georgia

- Long-term change in avg. earnings for residents born into low-income households: +18.5% (+$4,243)
- Avg. earnings among adults born in 1978 into low-income households: $22,974 (inflation-adjusted)
- Avg. earnings among adults born in 1992 into low-income households: $27,217 (inflation-adjusted)
- 2023 unemployment rate: 5.0%
- Homeownership rate in 2022: 82.8%
- Poverty rate in 2022: 27.9%
- Total population: 8,704
18. Anson County, North Carolina
- Long-term change in avg. earnings for residents born into low-income households: +18.9% (+$4,377)
- Avg. earnings among adults born in 1978 into low-income households: $23,177 (inflation-adjusted)
- Avg. earnings among adults born in 1992 into low-income households: $27,555 (inflation-adjusted)
- 2023 unemployment rate: 4.0%
- Homeownership rate in 2022: 67.4%
- Poverty rate in 2022: 19.3%
- Total population: 22,200
17. Bradley County, Arkansas
- Long-term change in avg. earnings for residents born into low-income households: +18.9% (+$5,062)
- Avg. earnings among adults born in 1978 into low-income households: $26,716 (inflation-adjusted)
- Avg. earnings among adults born in 1992 into low-income households: $31,778 (inflation-adjusted)
- 2023 unemployment rate: 4.6%
- Homeownership rate in 2022: 64.9%
- Poverty rate in 2022: 15.2%
- Total population: 10,461
16. Skamania County, Washington

- Long-term change in avg. earnings for residents born into low-income households: +19.0% (+$5,695)
- Avg. earnings among adults born in 1978 into low-income households: $29,957 (inflation-adjusted)
- Avg. earnings among adults born in 1992 into low-income households: $35,652 (inflation-adjusted)
- 2023 unemployment rate: 4.8%
- Homeownership rate in 2022: 81.2%
- Poverty rate in 2022: 8.6%
- Total population: 12,118
15. Gulf County, Florida

- Long-term change in avg. earnings for residents born into low-income households: +19.3% (+$4,784)
- Avg. earnings among adults born in 1978 into low-income households: $24,846 (inflation-adjusted)
- Avg. earnings among adults born in 1992 into low-income households: $29,630 (inflation-adjusted)
- 2023 unemployment rate: 2.7%
- Homeownership rate in 2022: 78.6%
- Poverty rate in 2022: 12.3%
- Total population: 15,002
14. Claiborne County, Mississippi

- Long-term change in avg. earnings for residents born into low-income households: +19.7% (+$4,121)
- Avg. earnings among adults born in 1978 into low-income households: $20,900 (inflation-adjusted)
- Avg. earnings among adults born in 1992 into low-income households: $25,021 (inflation-adjusted)
- 2023 unemployment rate: 7.3%
- Homeownership rate in 2022: 75.5%
- Poverty rate in 2022: 30.4%
- Total population: 9,044
13. Edgefield County, South Carolina

- Long-term change in avg. earnings for residents born into low-income households: +19.8% (+$4,756)
- Avg. earnings among adults born in 1978 into low-income households: $23,996 (inflation-adjusted)
- Avg. earnings among adults born in 1992 into low-income households: $28,752 (inflation-adjusted)
- 2023 unemployment rate: 3.1%
- Homeownership rate in 2022: 75.3%
- Poverty rate in 2022: 17.0%
- Total population: 26,181
12. Lee County, Arkansas

- Long-term change in avg. earnings for residents born into low-income households: +19.9% (+$4,726)
- Avg. earnings among adults born in 1978 into low-income households: $23,733 (inflation-adjusted)
- Avg. earnings among adults born in 1992 into low-income households: $28,460 (inflation-adjusted)
- 2023 unemployment rate: 5.2%
- Homeownership rate in 2022: 61.9%
- Poverty rate in 2022: 27.6%
- Total population: 8,666
11. Quitman County, Mississippi

- Long-term change in avg. earnings for residents born into low-income households: +20.8% (+$4,504)
- Avg. earnings among adults born in 1978 into low-income households: $21,705 (inflation-adjusted)
- Avg. earnings among adults born in 1992 into low-income households: $26,209 (inflation-adjusted)
- 2023 unemployment rate: 4.8%
- Homeownership rate in 2022: 57.3%
- Poverty rate in 2022: 30.2%
- Total population: 6,113
10. Cameron Parish, Louisiana

- Long-term change in avg. earnings for residents born into low-income households: +20.8% (+$6,951)
- Avg. earnings among adults born in 1978 into low-income households: $33,463 (inflation-adjusted)
- Avg. earnings among adults born in 1992 into low-income households: $40,414 (inflation-adjusted)
- 2023 unemployment rate: 2.8%
- Homeownership rate in 2022: 89.5%
- Poverty rate in 2022: 12.4%
- Total population: 5,447
9. Clay County, South Dakota

- Long-term change in avg. earnings for residents born into low-income households: +21.0% (+$7,241)
- Avg. earnings among adults born in 1978 into low-income households: $34,406 (inflation-adjusted)
- Avg. earnings among adults born in 1992 into low-income households: $41,647 (inflation-adjusted)
- 2023 unemployment rate: 2.1%
- Homeownership rate in 2022: 51.1%
- Poverty rate in 2022: 21.2%
- Total population: 14,953
8. Holmes County, Ohio

- Long-term change in avg. earnings for residents born into low-income households: +24.0% (+$8,634)
- Avg. earnings among adults born in 1978 into low-income households: $36,020 (inflation-adjusted)
- Avg. earnings among adults born in 1992 into low-income households: $44,654 (inflation-adjusted)
- 2023 unemployment rate: 2.8%
- Homeownership rate in 2022: 78.0%
- Poverty rate in 2022: 8.9%
- Total population: 44,273
7. Jasper County, Georgia

- Long-term change in avg. earnings for residents born into low-income households: +24.8% (+$5,704)
- Avg. earnings among adults born in 1978 into low-income households: $23,023 (inflation-adjusted)
- Avg. earnings among adults born in 1992 into low-income households: $28,727 (inflation-adjusted)
- 2023 unemployment rate: 2.9%
- Homeownership rate in 2022: 82.5%
- Poverty rate in 2022: 13.3%
- Total population: 14,882
6. Jackson County, Arkansas
- Long-term change in avg. earnings for residents born into low-income households: +24.9% (+$6,395)
- Avg. earnings among adults born in 1978 into low-income households: $25,634 (inflation-adjusted)
- Avg. earnings among adults born in 1992 into low-income households: $32,028 (inflation-adjusted)
- 2023 unemployment rate: 5.1%
- Homeownership rate in 2022: 66.6%
- Poverty rate in 2022: 20.4%
- Total population: 16,784
5. Rolette County, North Dakota

- Long-term change in avg. earnings for residents born into low-income households: +25.1% (+$5,535)
- Avg. earnings among adults born in 1978 into low-income households: $22,007 (inflation-adjusted)
- Avg. earnings among adults born in 1992 into low-income households: $27,541 (inflation-adjusted)
- 2023 unemployment rate: 5.5%
- Homeownership rate in 2022: 66.1%
- Poverty rate in 2022: 24.9%
- Total population: 12,292
4. McCormick County, South Carolina

- Long-term change in avg. earnings for residents born into low-income households: +25.6% (+$5,640)
- Avg. earnings among adults born in 1978 into low-income households: $22,012 (inflation-adjusted)
- Avg. earnings among adults born in 1992 into low-income households: $27,653 (inflation-adjusted)
- 2023 unemployment rate: 3.3%
- Homeownership rate in 2022: 83.9%
- Poverty rate in 2022: 16.7%
- Total population: 9,612
3. Greene County, Georgia

- Long-term change in avg. earnings for residents born into low-income households: +27.9% (+$6,385)
- Avg. earnings among adults born in 1978 into low-income households: $22,901 (inflation-adjusted)
- Avg. earnings among adults born in 1992 into low-income households: $29,286 (inflation-adjusted)
- 2023 unemployment rate: 3.3%
- Homeownership rate in 2022: 79.2%
- Poverty rate in 2022: 12.9%
- Total population: 19,020
2. Peach County, Georgia

- Long-term change in avg. earnings for residents born into low-income households: +28.1% (+$6,133)
- Avg. earnings among adults born in 1978 into low-income households: $21,816 (inflation-adjusted)
- Avg. earnings among adults born in 1992 into low-income households: $27,949 (inflation-adjusted)
- 2023 unemployment rate: 3.8%
- Homeownership rate in 2022: 69.0%
- Poverty rate in 2022: 20.7%
- Total population: 28,054
1. Talbot County, Georgia

- Long-term change in avg. earnings for residents born into low-income households: +33.7% (+$7,202)
- Avg. earnings among adults born in 1978 into low-income households: $21,400 (inflation-adjusted)
- Avg. earnings among adults born in 1992 into low-income households: $28,601 (inflation-adjusted)
- 2023 unemployment rate: 3.3%
- Homeownership rate in 2022: 82.1%
- Poverty rate in 2022: 18.4%
- Total population: 5,793
Contact [email protected] for any questions or corrections.