The History of U.S. National Debt Under Every President Since 1901
From a few billion dollars in Theodore Roosevelt's era to a figure that would have been unimaginable a century ago, the national debt tells a story that goes far beyond which party occupied the White House and why blaming any…

The United States has carried a national debt for nearly its entire history. It has borrowed to finance wars, survive economic downturns, build infrastructure, and cover the difference between federal spending and tax revenue. What started as millions of dollars in obligations following the American Revolution has grown into tens of trillions, with both Republican and Democratic administrations overseeing significant changes along the way.
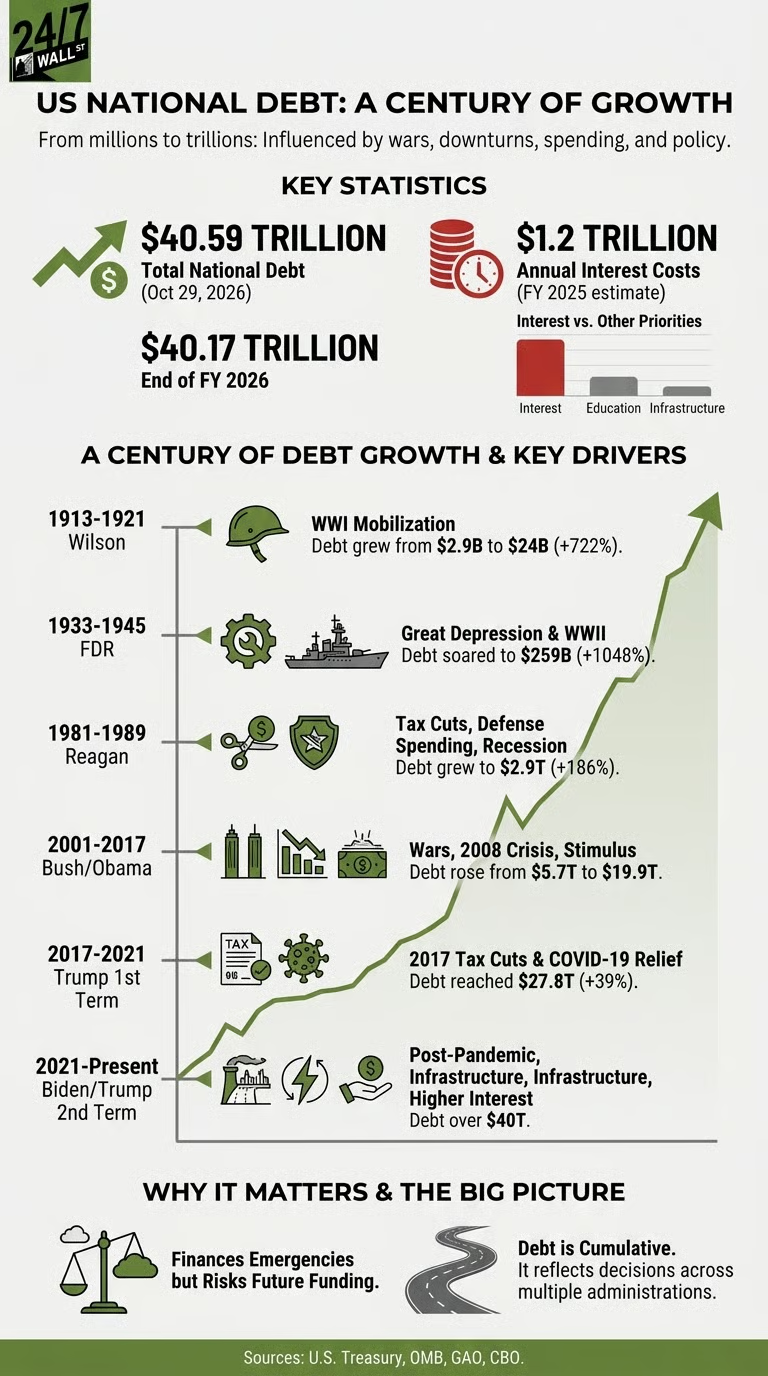
According to U.S. Treasury data, the national debt reached approximately $40.17 trillion at the end of fiscal 2026 and stood at $40.59 trillion on October 29, 2026. Those figures are a far cry from the roughly $2.1 billion recorded in 1901. But understanding how we got here requires more than looking at which president happened to be in office when the total went up. Wars, recessions, legislation passed by Congress, interest payments, and decisions inherited from earlier administrations all contribute to the picture.
Why It Matters
National debt isn’t automatically a bad thing. Government borrowing can help finance emergencies and investments that would otherwise be difficult to fund. The concern is how quickly debt grows relative to the economy and what it costs to maintain. According to the Government Accountability Office, federal debt interest costs reached approximately $1.2 trillion in fiscal 2025. That’s money that cannot simultaneously be spent on other priorities without additional revenue or borrowing. Looking at the debt throughout history helps explain the financial decisions behind today’s numbers and why reducing it is considerably more complicated than any political slogan suggests.
About the figures: This article uses Treasury’s total public debt outstanding, including debt held by investors and federal government accounts. For administrations before 1993, the figures are historical fiscal-year snapshots. Later administrations use daily Treasury balances near the beginning and end of presidential terms. Fiscal years do not always align with inauguration dates, and debt changes should not be attributed exclusively to the president in office. Dollar amounts are nominal and are not adjusted for inflation.
Theodore Roosevelt (1901–1909)

- National debt: $2.14 billion (FY1901) to $2.64 billion (FY1909)
- Change between snapshots: Approximately +$496 million (+23.2%)
- Political party: Republican
Theodore Roosevelt took office in September 1901, following the assassination of William McKinley. His presidency came during an era of industrial expansion, increased federal involvement in economic affairs, and a growing American presence overseas. Projects such as the Panama Canal and investment in naval power reflected those changing priorities. The national debt increased modestly in nominal dollars, though the federal government’s financial obligations were still relatively small compared with what would follow during the two world wars.
William Howard Taft (1909–1913)

- National debt: $2.64 billion (FY1909) to $2.92 billion (FY1913)
- Change between snapshots: Approximately +$277 million (+10.5%)
- Political party: Republican
Taft’s presidency continued the expansion of the federal government’s role in business regulation and public administration. Federal spending remained comparatively limited by modern standards, and the debt increased by less than $300 million between the two fiscal-year snapshots. The administration also operated during a period of debate over tariffs and federal revenue. The major transformation in American government borrowing was still ahead, with World War I about to change the nation’s finances dramatically.
Woodrow Wilson (1913–1921)
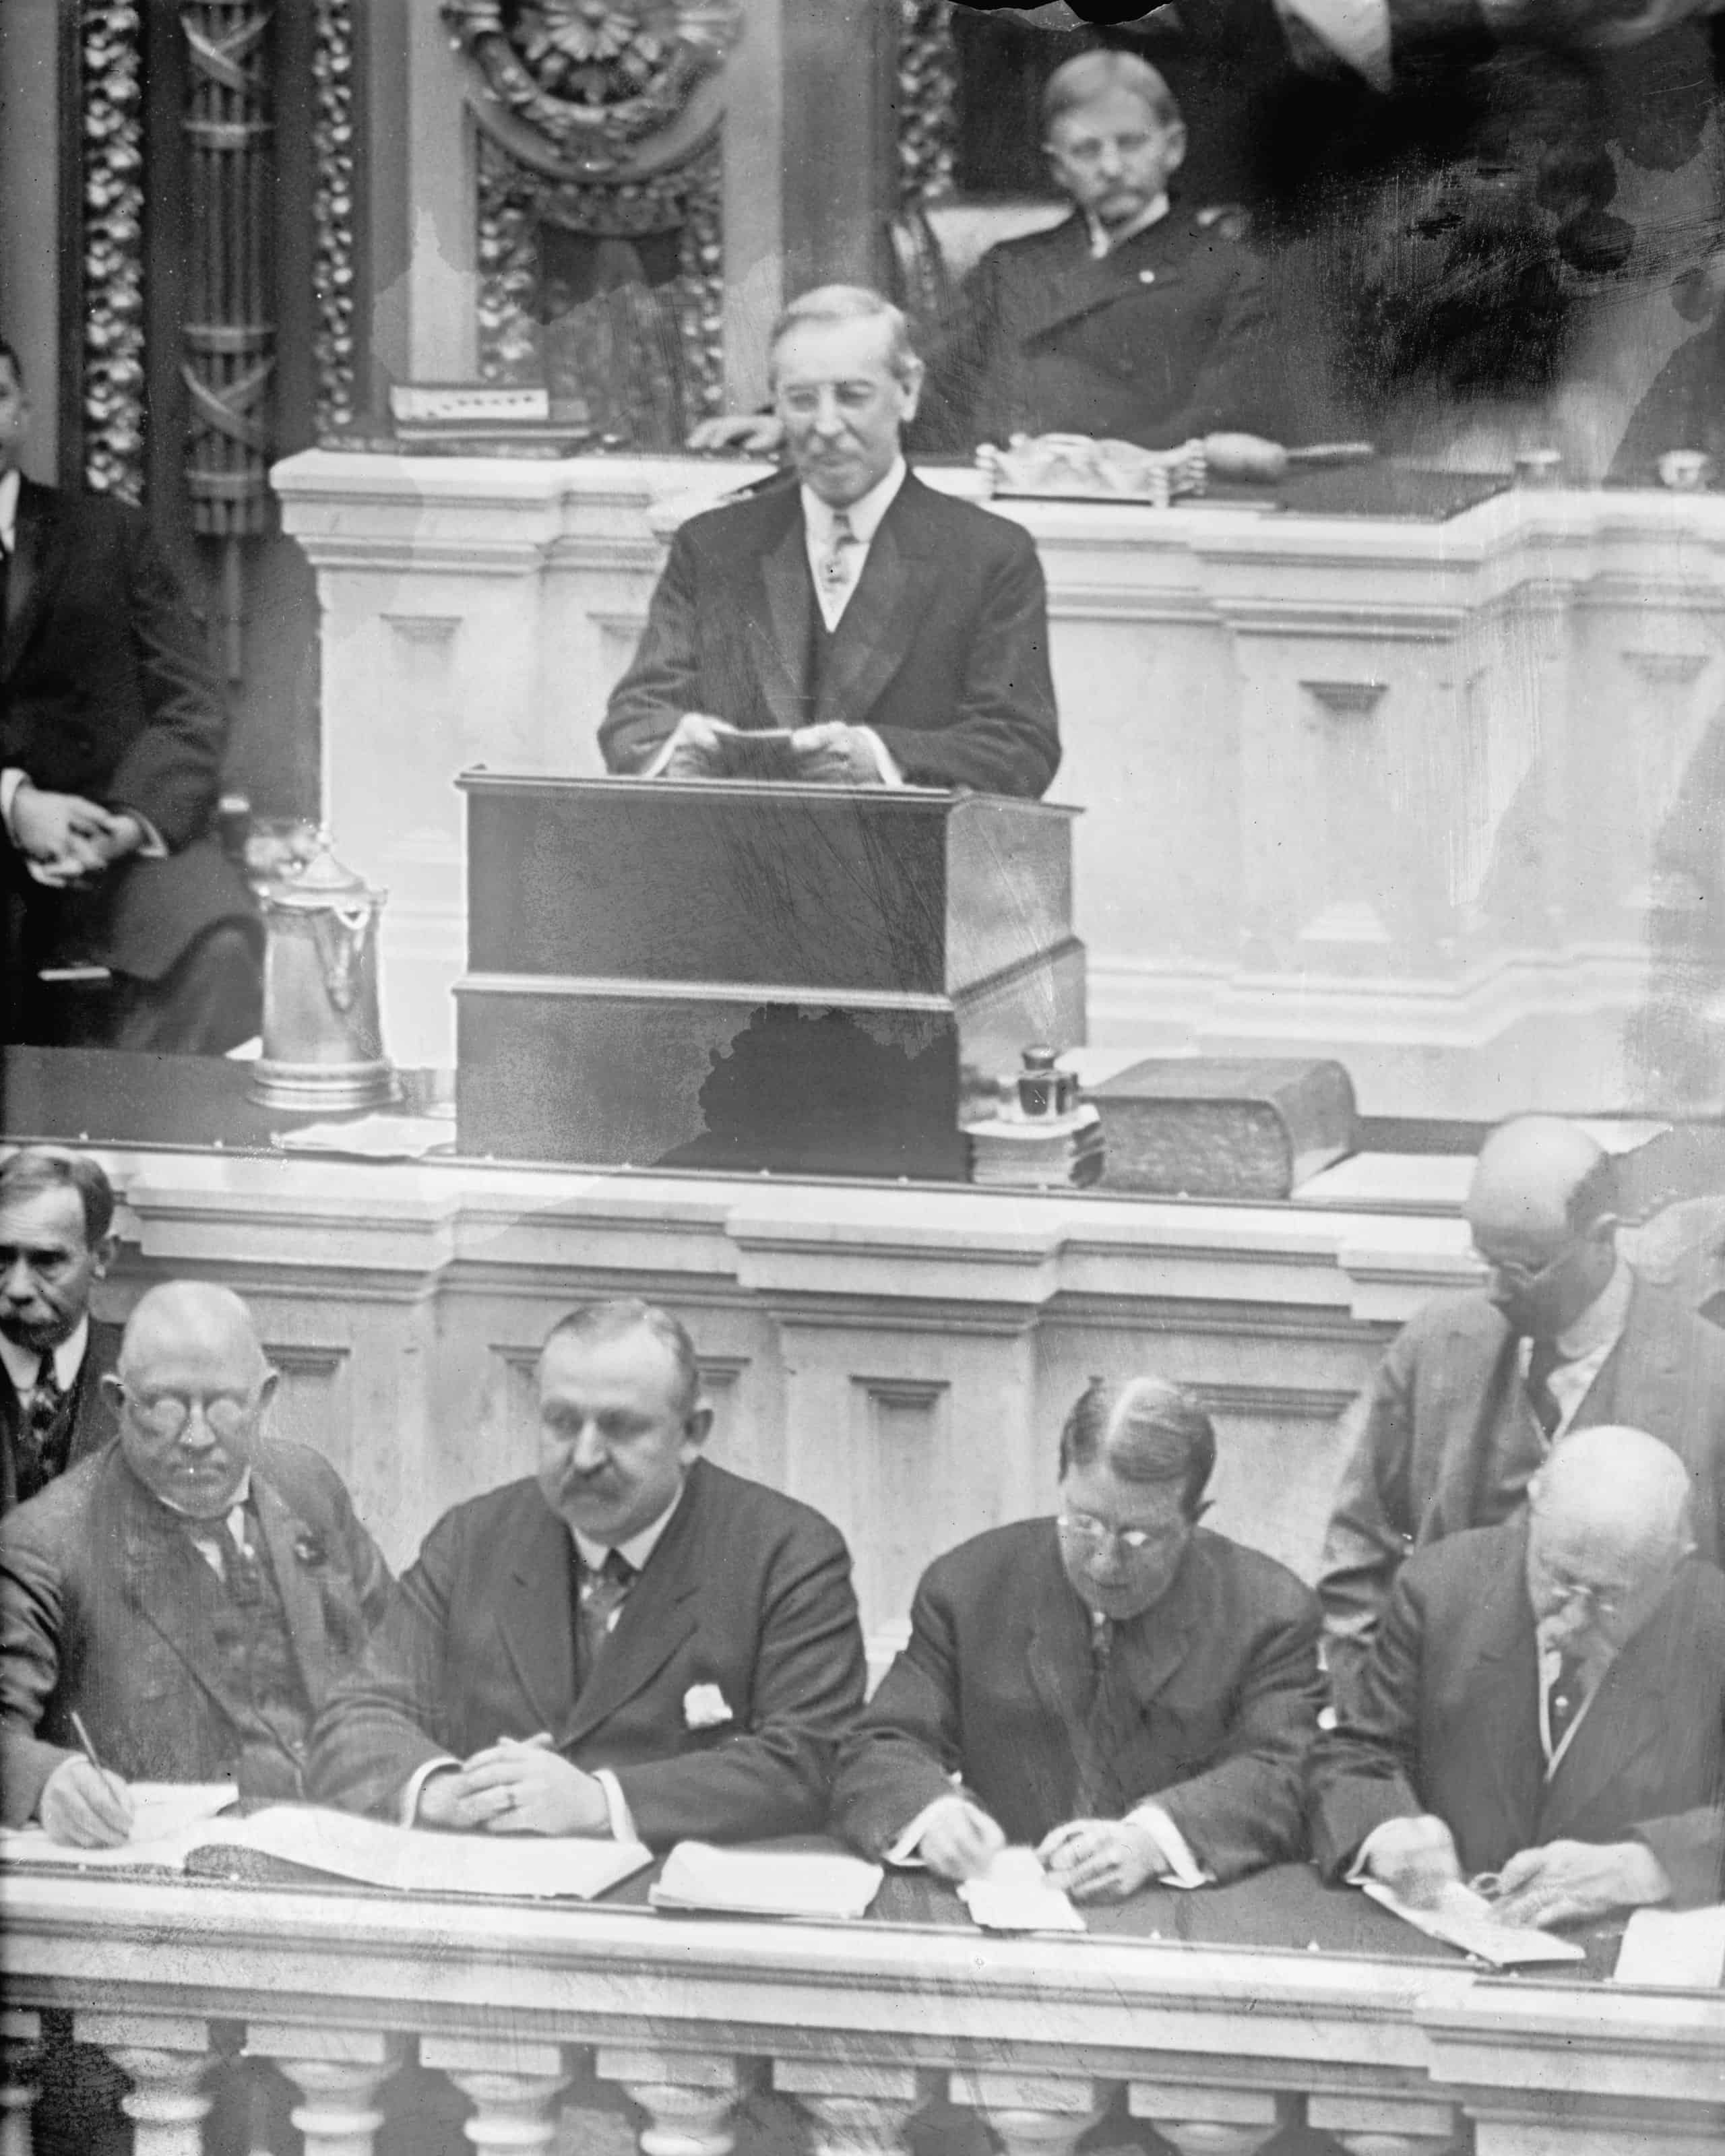
- National debt: $2.92 billion (FY1913) to $23.98 billion (FY1921)
- Change between snapshots: Approximately +$21.06 billion (+722.2%)
- Political party: Democratic
Woodrow Wilson’s presidency marked one of the most dramatic turning points in the history of American borrowing. When he entered office in 1913, the national debt was relatively small. By the time he left in 1921, it had increased several times over. The primary reason was World War I, which required the federal government to raise extraordinary amounts of money in a relatively short period.
After the United States entered the war in 1917, Washington expanded military production, increased taxes, and issued Liberty Bonds to help finance the fighting. Americans were encouraged to purchase these bonds as both a patriotic duty and an investment. Debt peaked above $27 billion in fiscal 1919 before declining as wartime obligations eased.
Wilson’s years illustrate why percentages alone can be misleading. The increase was enormous relative to the debt that existed before the war, but it occurred under extraordinary circumstances and from a much smaller starting balance than modern presidents inherited. World War I fundamentally changed the scale of federal borrowing and helped establish Treasury securities as an essential tool for financing the government.
Warren G. Harding (1921–1923)
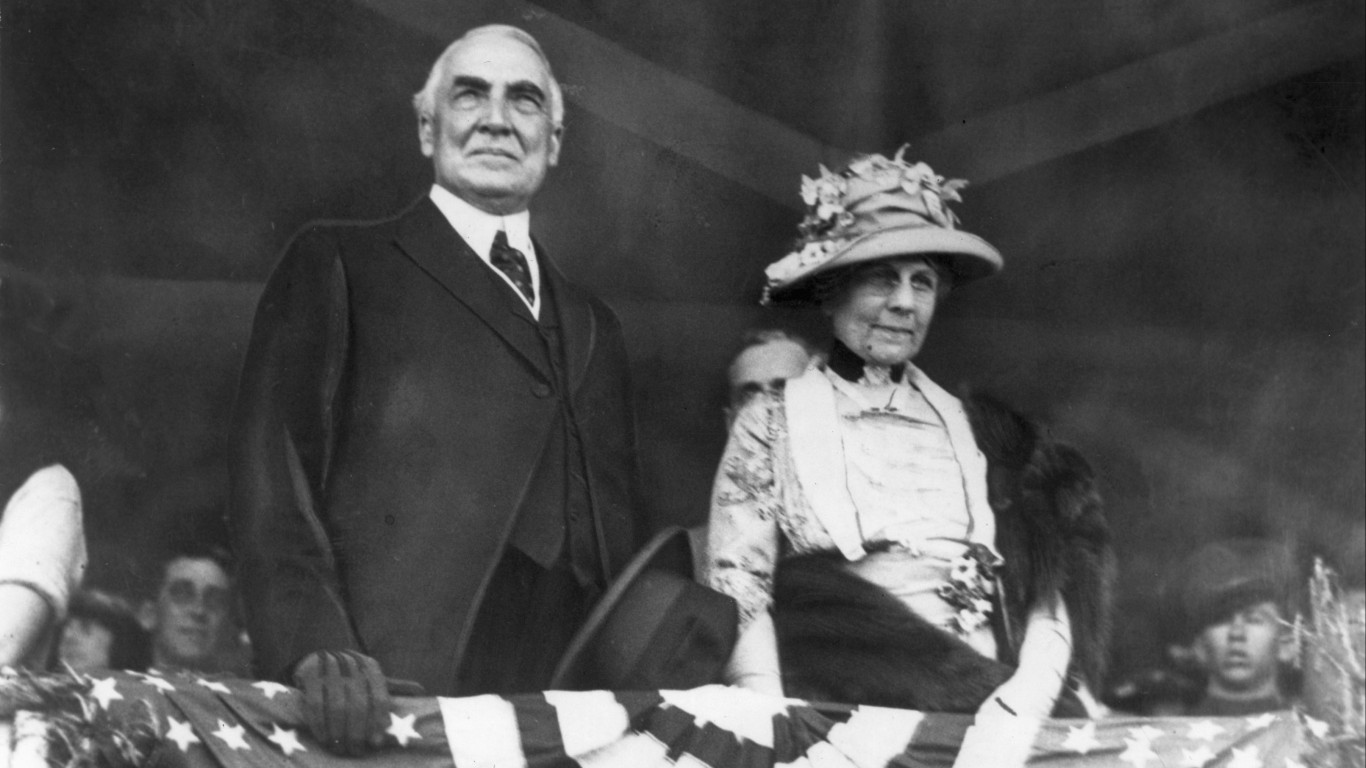
- National debt: $23.98 billion (FY1921) to $22.35 billion (FY1923)
- Change between snapshots: Approximately -$1.63 billion (-6.8%)
- Political party: Republican
Harding entered office as the country was recovering from World War I and a sharp postwar recession. His administration emphasized reducing government expenditures and restoring more predictable federal finances. The Budget and Accounting Act of 1921 established a more centralized federal budget process. As wartime spending declined and federal budgets recorded surpluses, the national debt began falling. Harding died in August 1923, leaving Vice President Calvin Coolidge to continue that approach.
Calvin Coolidge (1923–1929)

- National debt: $22.35 billion (FY1923) to $16.93 billion (FY1929)
- Change between snapshots: Approximately -$5.42 billion (-24.2%)
- Political party: Republican
Coolidge continued the spending restraint and debt-reduction policies that began under Harding. During much of the 1920s, a growing economy and repeated federal budget surpluses allowed Washington to pay down outstanding obligations while also reducing several federal tax rates. The debt fell by roughly one-quarter between the two fiscal-year snapshots. It remains one of the clearer examples of a sustained reduction in nominal national debt, although the prosperity of the 1920s would end shortly after Coolidge left office.
Herbert Hoover (1929–1933)

- National debt: $16.93 billion (FY1929) to $22.54 billion (FY1933)
- Change between snapshots: Approximately +$5.61 billion (+33.1%)
- Political party: Republican
Hoover took office just months before the stock market crash of 1929 and the onset of the Great Depression. As businesses failed, unemployment climbed, and incomes declined, federal tax receipts weakened. His administration eventually supported public works projects and emergency lending programs, while also attempting to restore budget balance through measures that included higher taxes. The debt increased as the economic crisis deepened, demonstrating how a collapsing economy can strain federal finances even when policymakers are concerned about deficits.
Franklin D. Roosevelt (1933–1945)

- National debt: $22.54 billion (FY1933) to $258.68 billion (FY1945)
- Change between snapshots: Approximately +$236.14 billion (+1,047.7%)
- Political party: Democratic
Franklin D. Roosevelt inherited a country suffering through the Great Depression. Banks had failed, unemployment was widespread, and confidence in the economy had collapsed. His administration responded with the New Deal, an extensive collection of relief, recovery, and reform programs intended to stabilize the financial system, provide employment, and support struggling Americans. Those programs increased federal spending, but they were only part of the debt story during Roosevelt’s presidency.
World War II was the much larger financial turning point. Following the attack on Pearl Harbor in December 1941, the United States mobilized an enormous military and industrial effort. The government financed ships, aircraft, equipment, military personnel, and support for Allied nations through a combination of taxes and borrowing. War Bonds helped bring ordinary Americans into that financing effort.
By fiscal 1945, national debt had reached approximately $259 billion, compared with about $23 billion in fiscal 1933. Roosevelt died in April 1945, so the final fiscal-year figure also includes months under Harry Truman. The increase was staggering, but so was the scale of the war. In the decades that followed, economic growth helped reduce the burden of the accumulated debt relative to the size of the American economy, even though the government did not eliminate the debt itself.
Harry S. Truman (1945–1953)
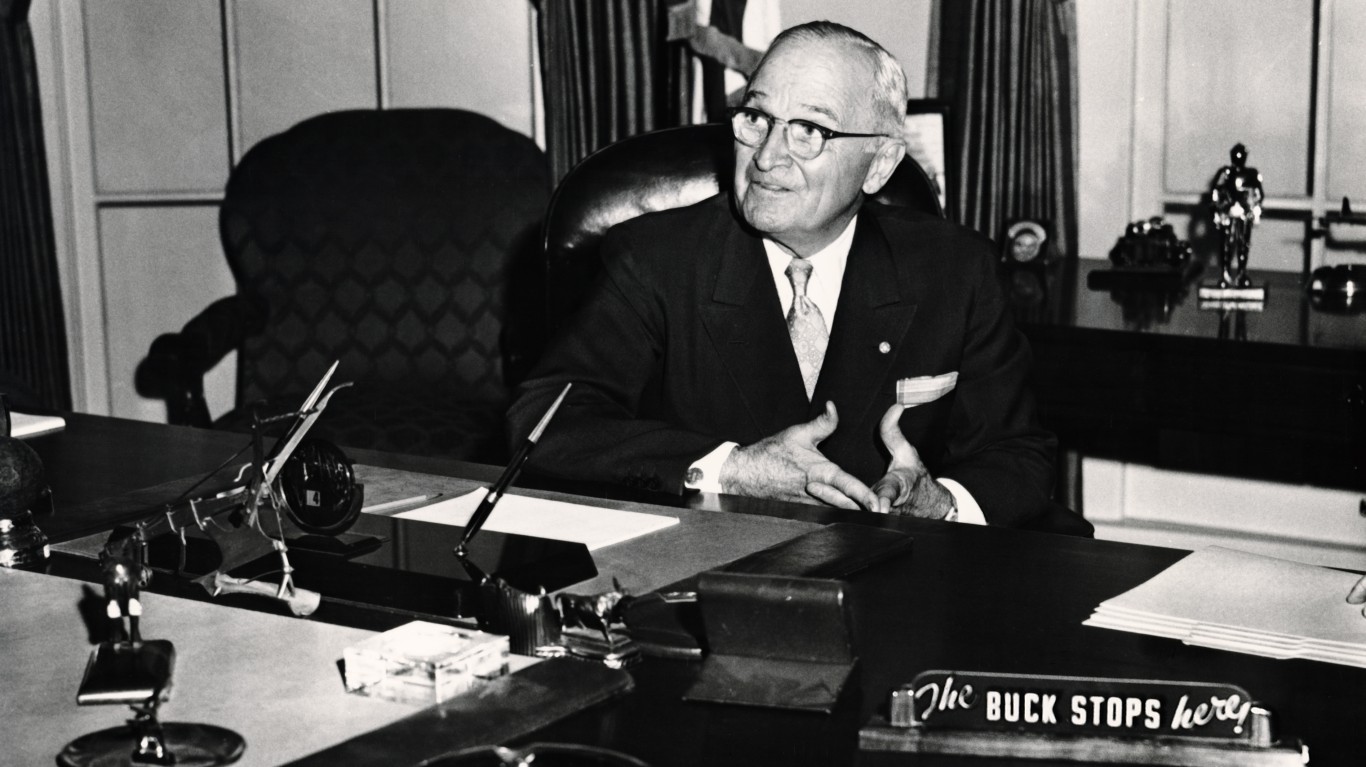
- National debt: $258.68 billion (FY1945) to $266.07 billion (FY1953)
- Change between snapshots: Approximately +$7.39 billion (+2.9%)
- Political party: Democratic
Truman oversaw the transition from wartime mobilization to a peacetime economy, followed by renewed military spending during the Korean War. Federal budgets recorded surpluses in several immediate postwar years, reducing some of the debt accumulated during World War II. Borrowing increased again as Cold War commitments expanded. Although the nominal debt remained relatively close to its 1945 level, the growing economy made that debt substantially more manageable as a share of national output.
Dwight D. Eisenhower (1953–1961)
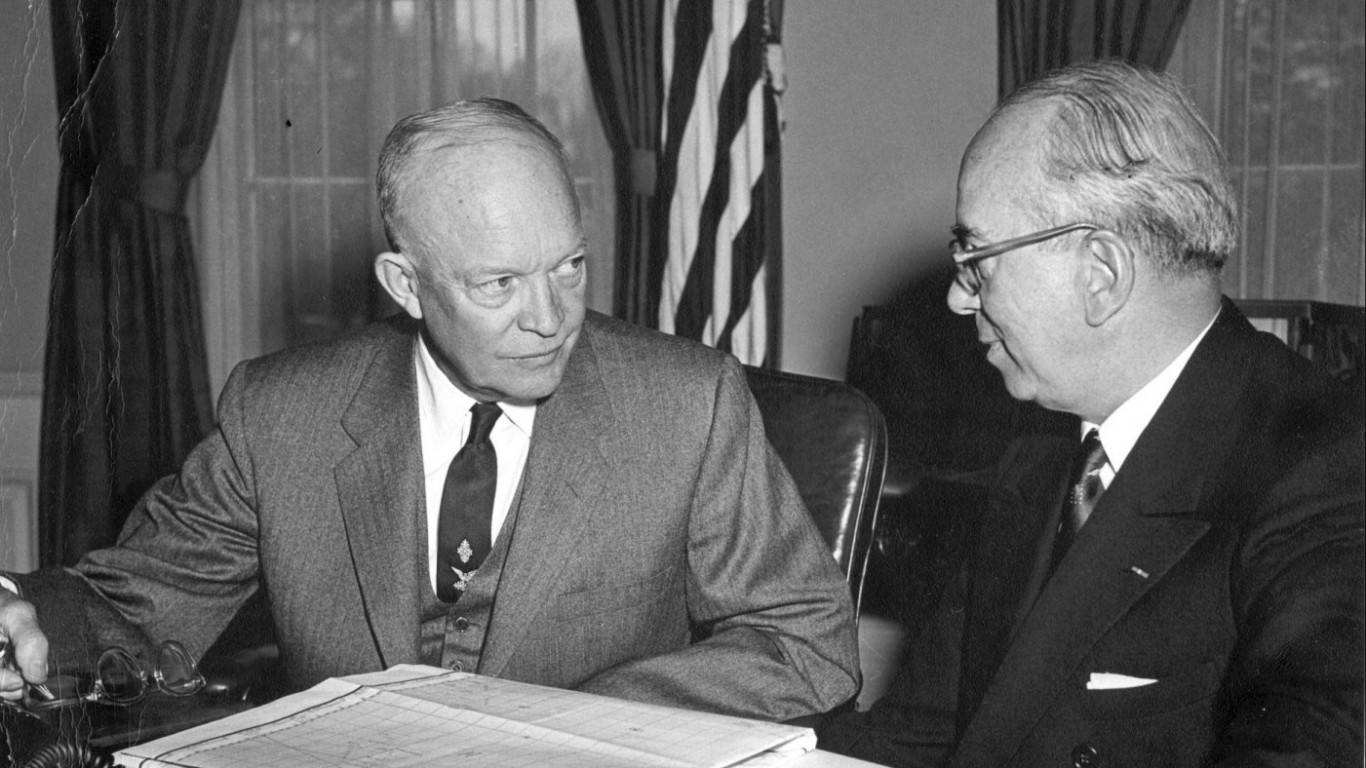
- National debt: $266.07 billion (FY1953) to $288.97 billion (FY1961)
- Change between snapshots: Approximately +$22.90 billion (+8.6%)
- Political party: Republican
Eisenhower placed considerable emphasis on balancing the federal budget while maintaining American military readiness during the Cold War. His administration also supported the Interstate Highway System, one of the country’s most significant infrastructure investments. Several budgets recorded surpluses, although recessions and continued defense commitments contributed to deficits in other years. The overall debt increased modestly in nominal terms, and economic growth helped keep the federal debt burden relatively contained compared with later decades.
John F. Kennedy (1961–1963)
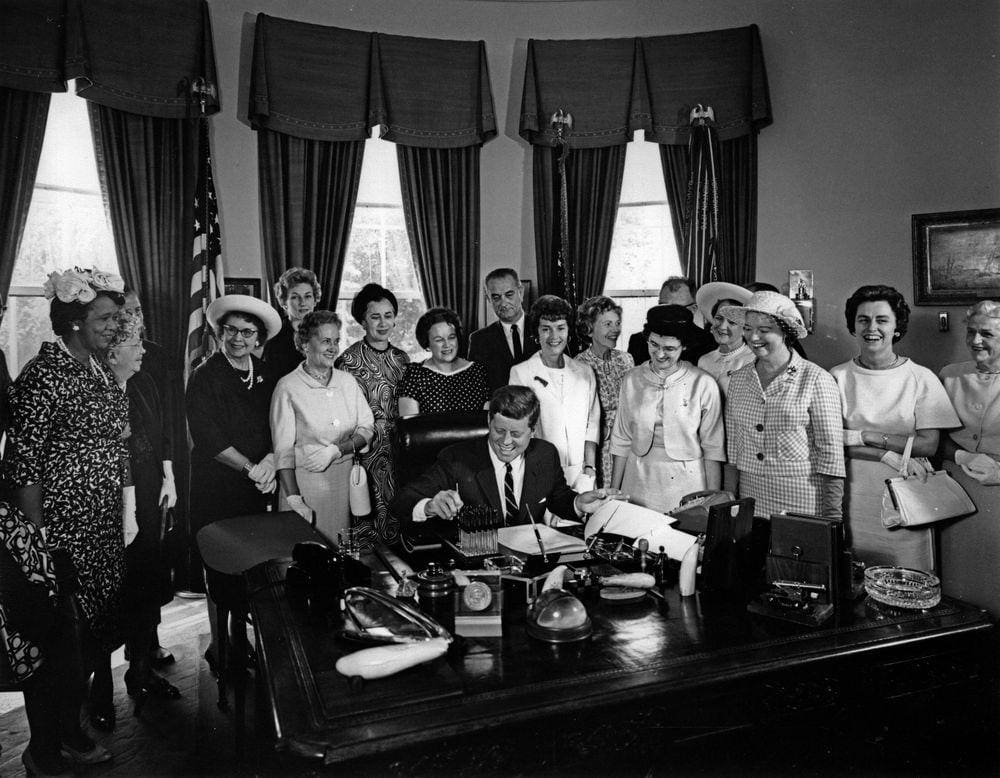
- National debt: $288.97 billion (FY1961) to $305.86 billion (FY1963)
- Change between snapshots: Approximately +$16.89 billion (+5.8%)
- Political party: Democratic
Kennedy’s administration emphasized economic growth while increasing spending in areas such as national defense and the space program. His presidency included the Cuban Missile Crisis, the expansion of NASA’s ambitions, and growing American involvement in Vietnam. Kennedy also proposed major tax reductions intended to stimulate the economy, although Congress enacted the principal legislation after his death. The national debt increased moderately during this short administration, which ended with his assassination in November 1963.
Lyndon B. Johnson (1963–1969)
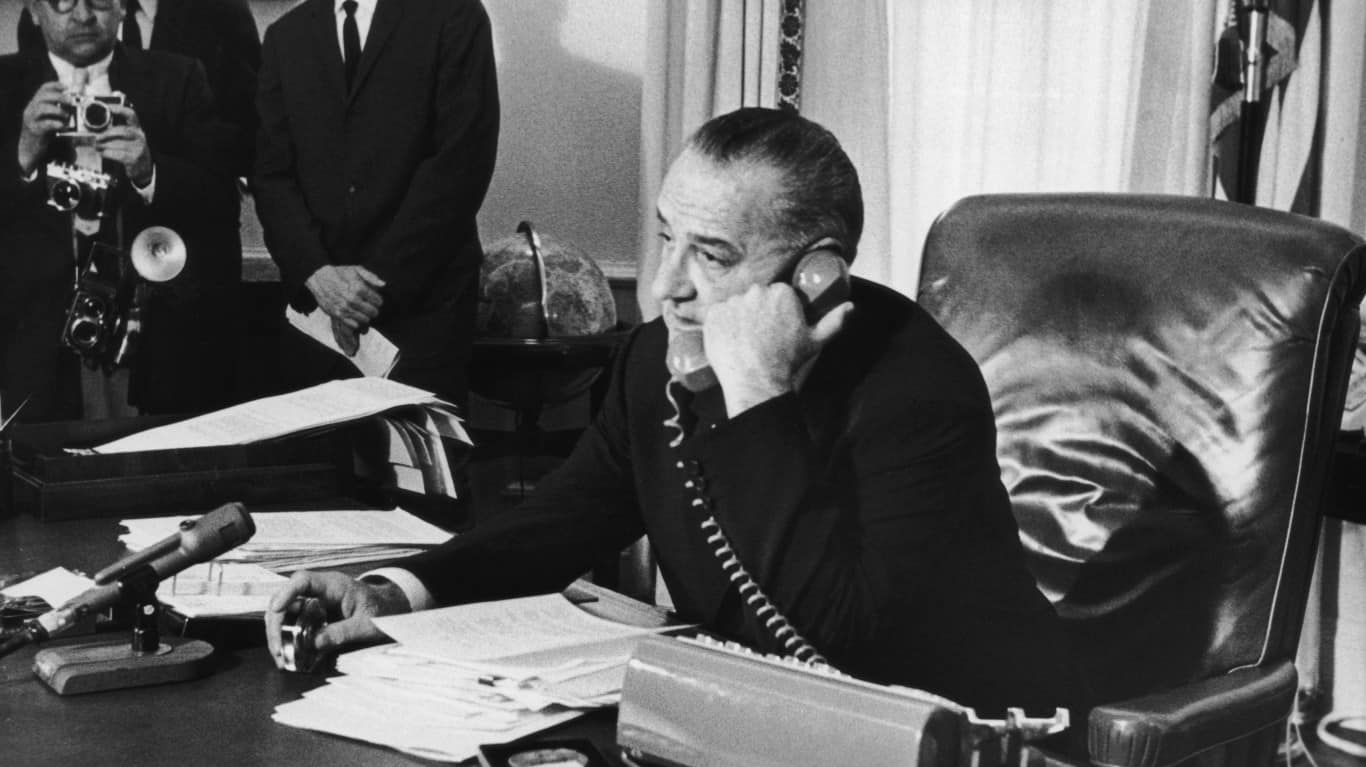
- National debt: $305.86 billion (FY1963) to $353.72 billion (FY1969)
- Change between snapshots: Approximately +$47.86 billion (+15.6%)
- Political party: Democratic
Lyndon B. Johnson’s presidency combined two enormous federal commitments: the Great Society and the Vietnam War. His domestic agenda expanded the federal government’s role in health care, education, poverty relief, and civil rights, including the creation of Medicare and Medicaid in 1965. At the same time, the escalating war in Vietnam required additional military spending, putting pressure on the federal budget.
The government struggled to balance these commitments without additional revenue. Johnson eventually supported a temporary income tax surcharge, enacted in 1968, to help address growing budget pressures. The federal budget even recorded a surplus in fiscal 1969, although gross national debt still increased over the broader period.
That distinction matters. A single budget surplus does not necessarily produce a decline in total outstanding debt, partly because of the way federal trust funds and other government accounts are included in the gross figure. Johnson’s administration illustrates how military spending, domestic programs, taxation, and accounting differences can all influence the debt at the same time. It also shows why simply comparing beginning and ending balances rarely tells the complete story of a presidency.
Richard M. Nixon (1969–1974)
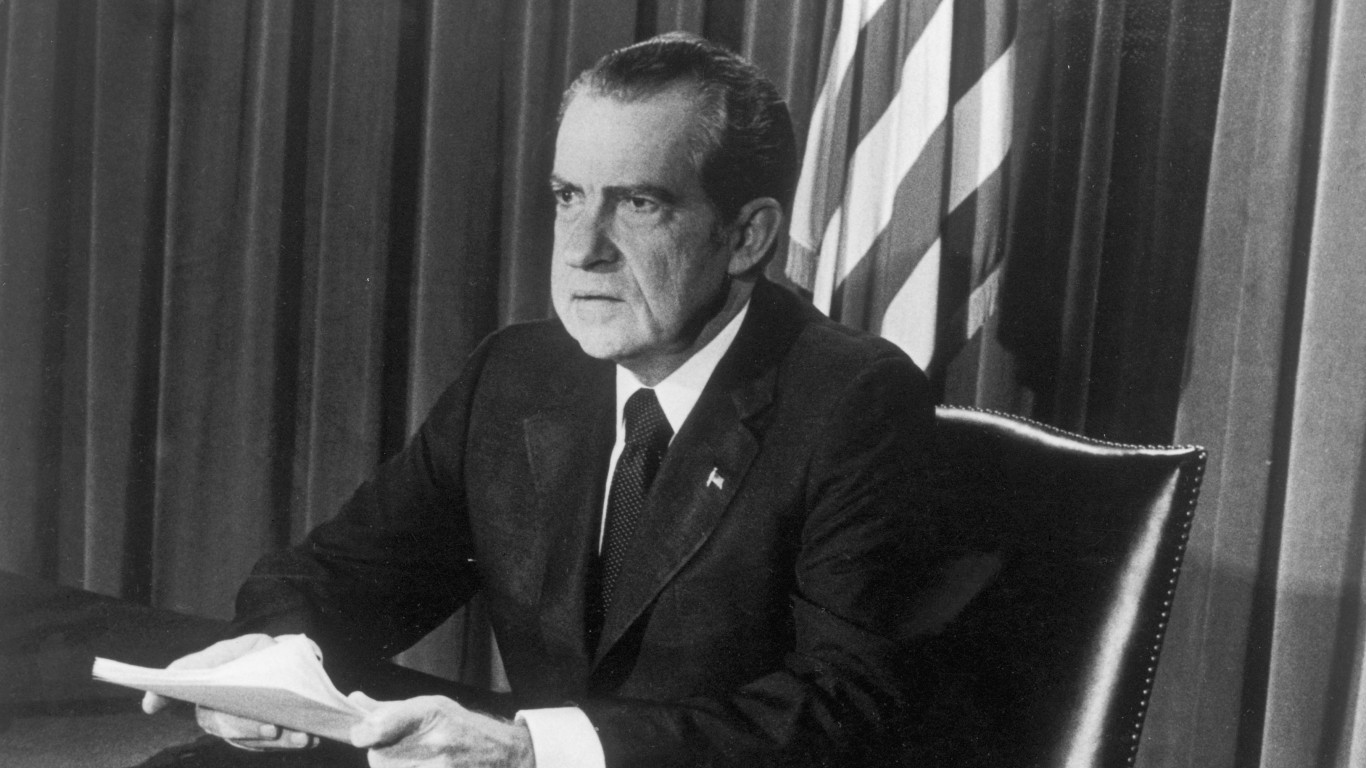
- National debt: $353.72 billion (FY1969) to $475.06 billion (FY1974)
- Change between snapshots: Approximately +$121.34 billion (+34.3%)
- Political party: Republican
Nixon inherited ongoing Vietnam War expenses and the expanding commitments of earlier domestic programs. His administration also faced inflation, economic instability, and major changes to the international monetary system, including the end of the dollar’s direct convertibility into gold in 1971. The 1973 oil crisis added another complication. Federal borrowing increased as spending continued to outpace revenue, setting the stage for the economic difficulties that would affect the remainder of the decade.
Gerald R. Ford (1974–1977)
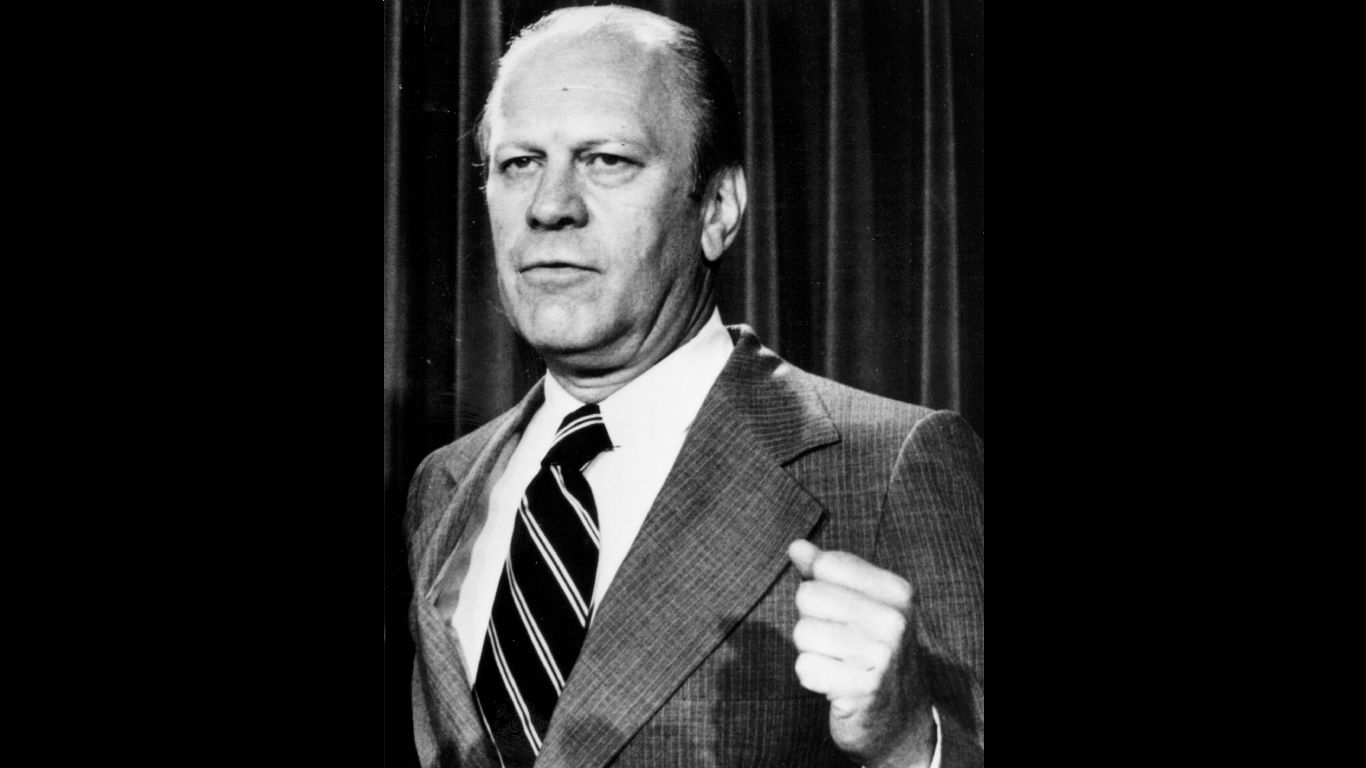
- National debt: $475.06 billion (FY1974) to $698.84 billion (FY1977)
- Change between snapshots: Approximately +$223.78 billion (+47.1%)
- Political party: Republican
Ford entered office following Nixon’s resignation and faced a difficult economy marked by recession, inflation, and high unemployment. His administration initially emphasized fighting inflation but also supported tax relief intended to encourage economic recovery. Falling revenue and increased spending on unemployment-related programs contributed to larger budget deficits. The national debt approached $700 billion by fiscal 1977, reflecting the financial strain of the mid-1970s economic downturn.
Jimmy Carter (1977–1981)
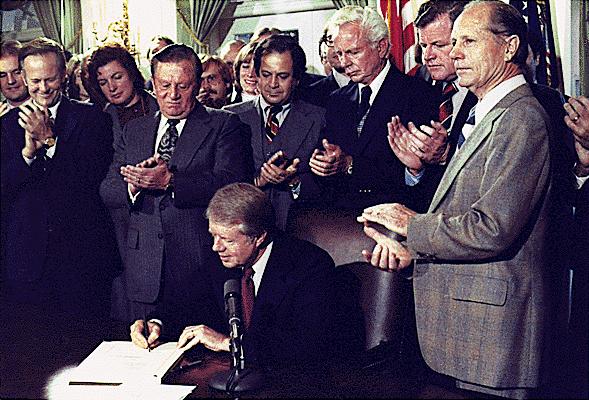
- National debt: $698.84 billion (FY1977) to $997.86 billion (FY1981)
- Change between snapshots: Approximately +$299.02 billion (+42.8%)
- Political party: Democratic
Carter’s presidency was dominated by economic challenges, including persistent inflation, energy shortages, and weakening growth. The economy entered a recession in 1980, further complicating efforts to control federal spending and maintain revenue. Although Carter pursued several measures aimed at fiscal restraint, the government continued running deficits. By fiscal 1981, gross national debt was approaching $1 trillion, a milestone that highlighted how much federal borrowing had expanded since the early 1970s.
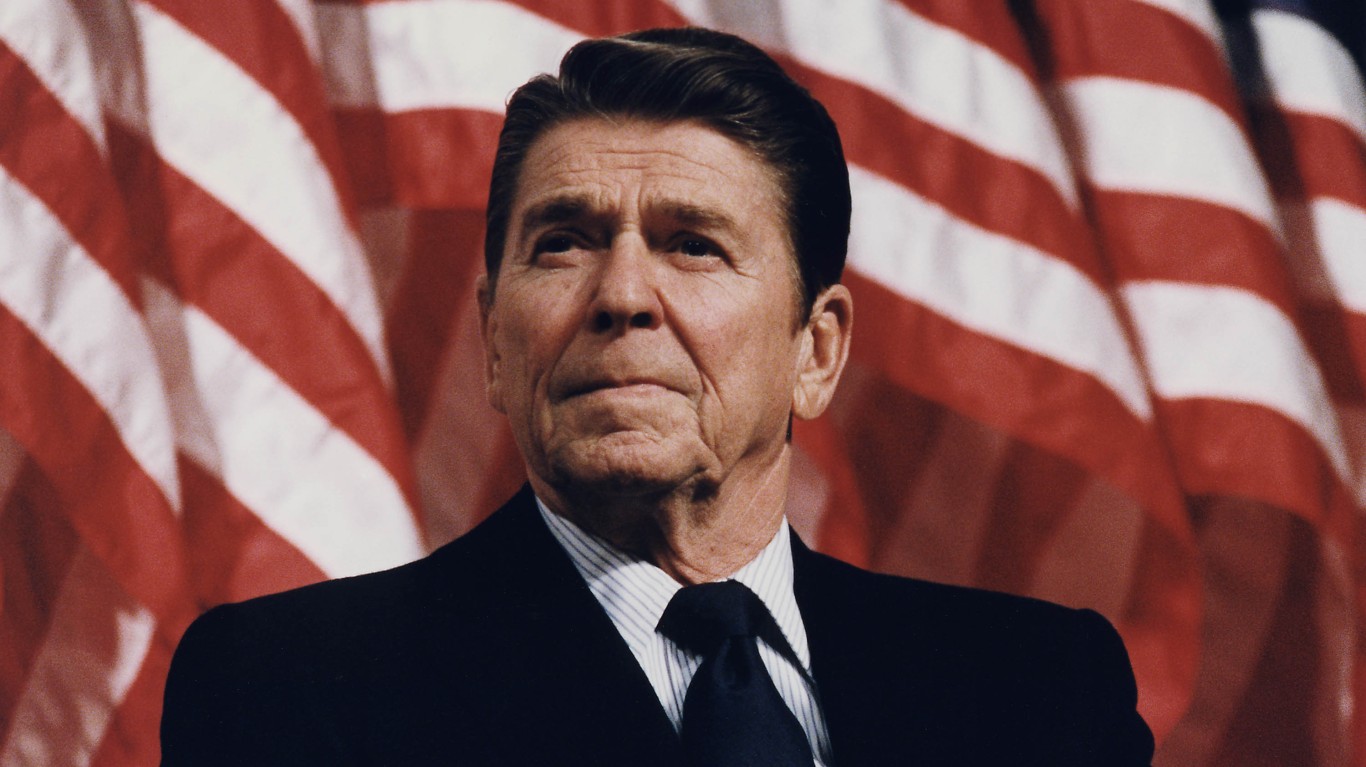
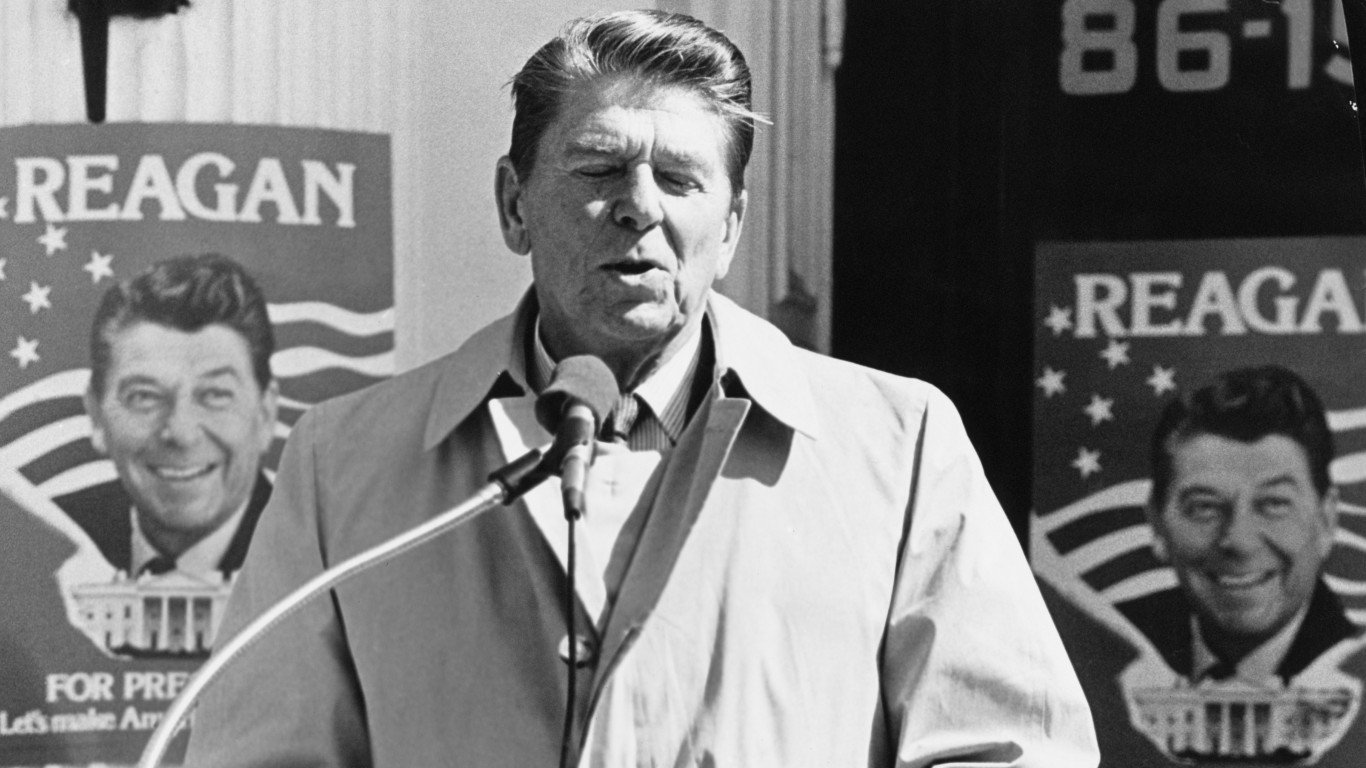
Ronald Reagan (1981–1989)
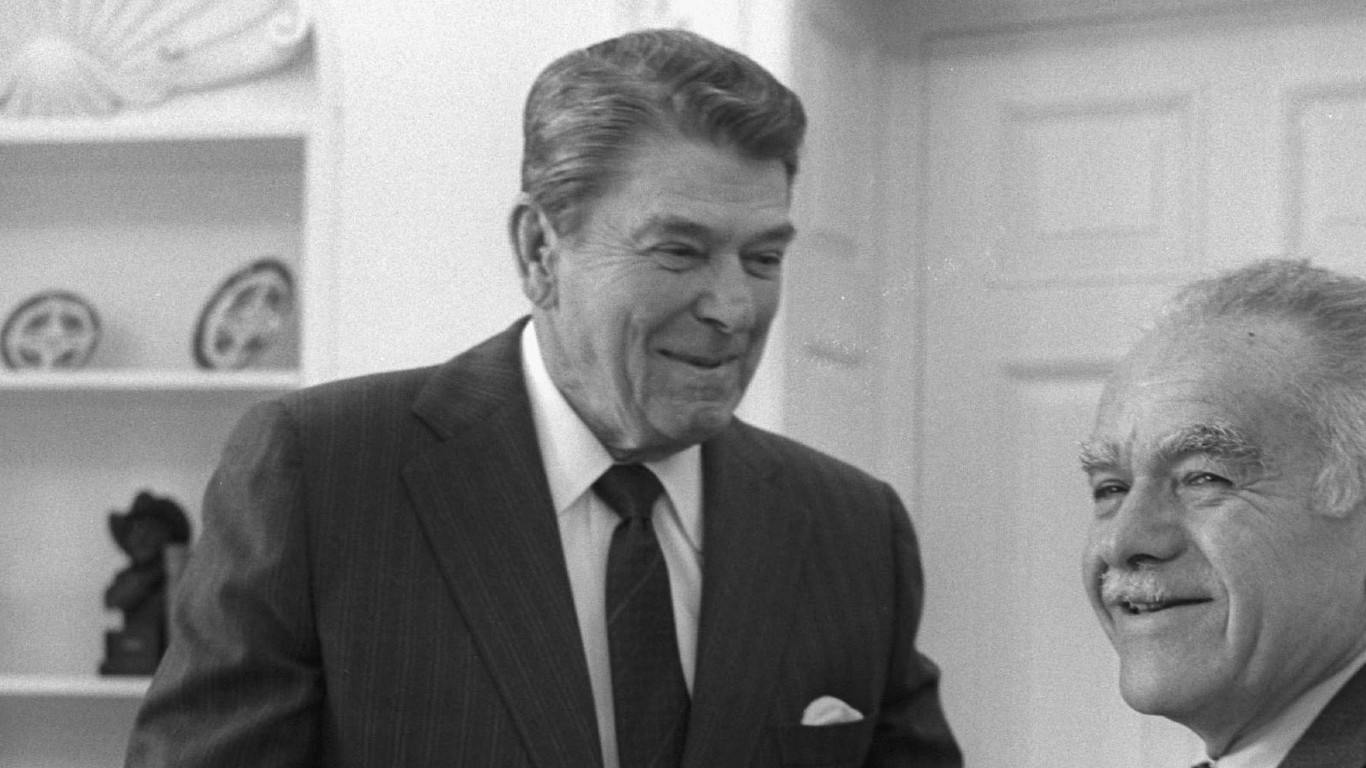
- National debt: $997.86 billion (FY1981) to approximately $2.86 trillion (FY1989)
- Change between snapshots: Approximately +$1.86 trillion (+186.4%)
- Political party: Republican
Ronald Reagan entered the White House promising smaller government, lower taxes, and stronger economic growth. His administration enacted major income tax reductions in 1981 and pursued a substantial increase in defense spending as tensions with the Soviet Union continued. The economy also experienced a severe recession in the early 1980s, which reduced federal revenue and increased pressure on the budget.
The economy recovered and expanded during much of Reagan’s presidency, but federal deficits persisted. Tax legislation changed several times, including increases in certain taxes and the broad restructuring of the tax code in 1986. Nevertheless, spending and revenue did not come into balance, and the national debt grew from roughly $1 trillion to nearly $2.9 trillion between the fiscal-year snapshots.
Reagan’s presidency is frequently cited in debates over whether tax cuts can generate enough economic activity to offset lost revenue. The historical record is more complicated than either side of that argument sometimes suggests. The economy grew during much of the decade, but federal borrowing increased substantially as well. Defense priorities, tax policy, economic conditions, and legislation passed by Congress all contributed to that outcome, making the 1980s a major turning point in the modern history of the debt.
George H. W. Bush (1989–1993)
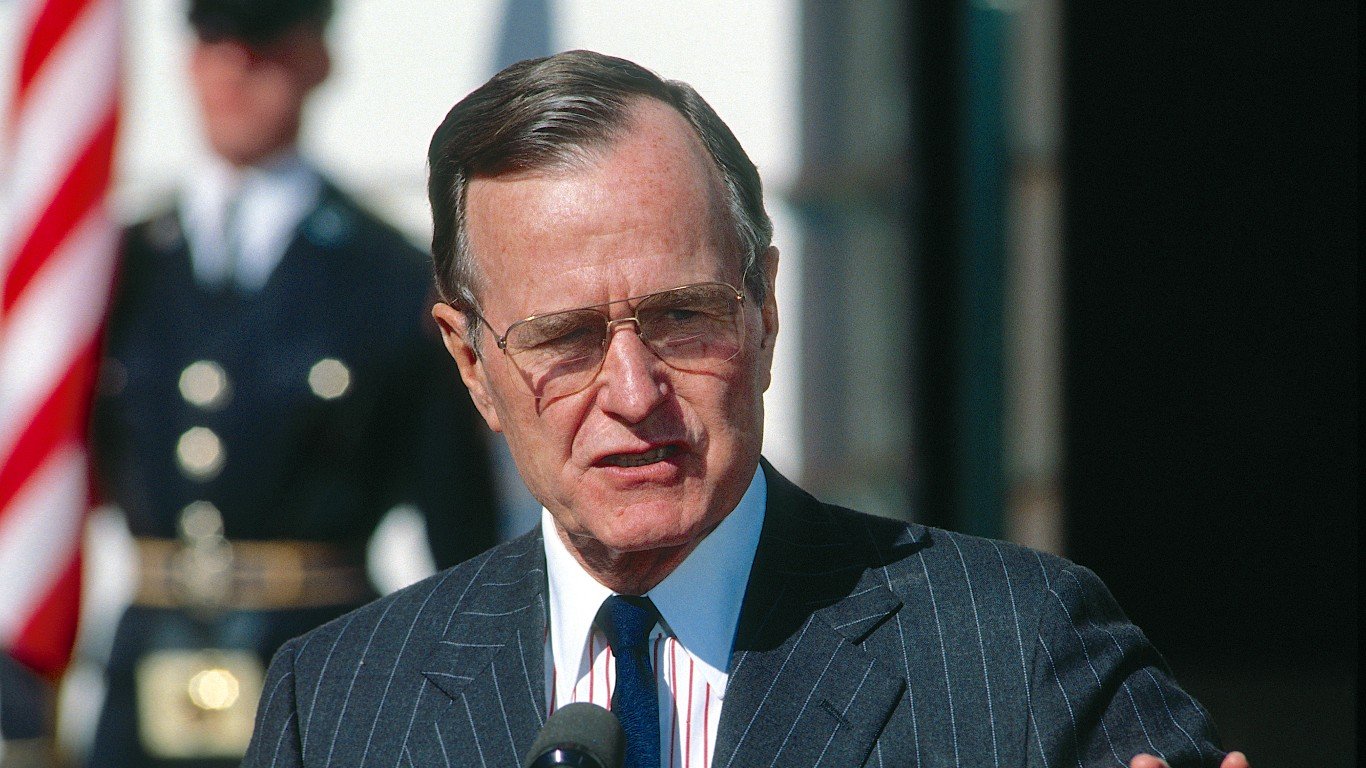
- National debt: Approximately $2.86 trillion (FY1989) to $4.41 trillion (FY1993)
- Change between snapshots: Approximately +$1.55 trillion (+54.4%)
- Political party: Republican
George H. W. Bush inherited large federal deficits and faced a recession beginning in 1990. His administration negotiated a bipartisan budget agreement that included spending controls and tax increases, despite his earlier campaign pledge not to raise taxes. Those measures sought to improve the government’s longer-term fiscal position, but they did not immediately eliminate deficits. National debt continued rising as the economy weakened and existing federal obligations remained substantial.
Bill Clinton (1993–2001)

- National debt: $4.23 trillion (April 1993) to $5.73 trillion (January 2001)
- Change between snapshots: Approximately +$1.50 trillion
- Political party: Democratic
Clinton’s administration is notable because federal budget deficits eventually gave way to four consecutive annual surpluses, from fiscal 1998 through fiscal 2001. Tax increases enacted in 1993, spending agreements, and strong economic growth all contributed to improving federal finances. Debt held by the public declined during those surplus years. Gross national debt, however, continued increasing because obligations held by federal government accounts also grew. The distinction explains how the government could run budget surpluses while still reporting a higher total debt than when Clinton entered office.
George W. Bush (2001–2009)
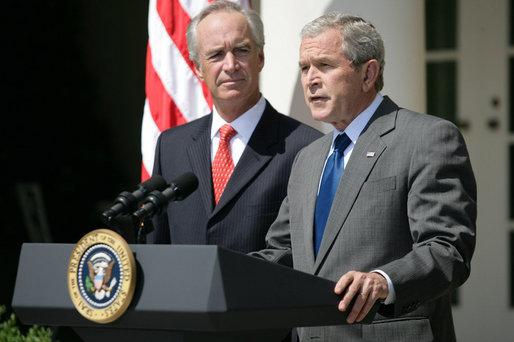
- National debt: $5.73 trillion (January 2001) to $10.63 trillion (January 2009)
- Change between snapshots: Approximately +$4.90 trillion (+85.6%)
- Political party: Republican
George W. Bush took office following several years of federal budget surpluses, but that fiscal picture changed considerably during his administration. The 2001 and 2003 tax cuts reduced federal revenue relative to what otherwise would have been collected, while the wars in Afghanistan and Iraq added substantial spending commitments. Medicare’s prescription drug benefit also expanded federal obligations. Then came the financial crisis of 2008, which severely weakened the economy and prompted emergency federal interventions. By the time Bush left office in January 2009, national debt had more than doubled from the level recorded at the beginning of his presidency.
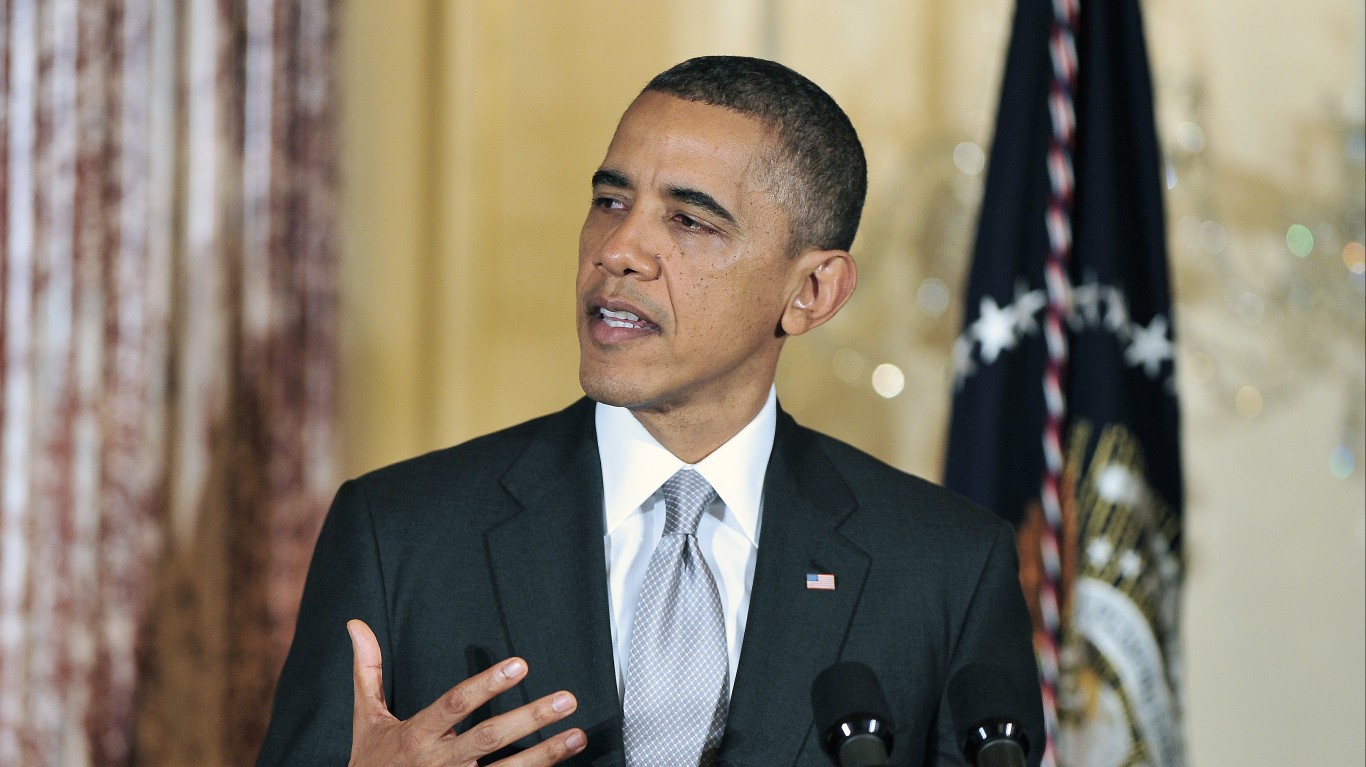
Barack Obama (2009–2017)
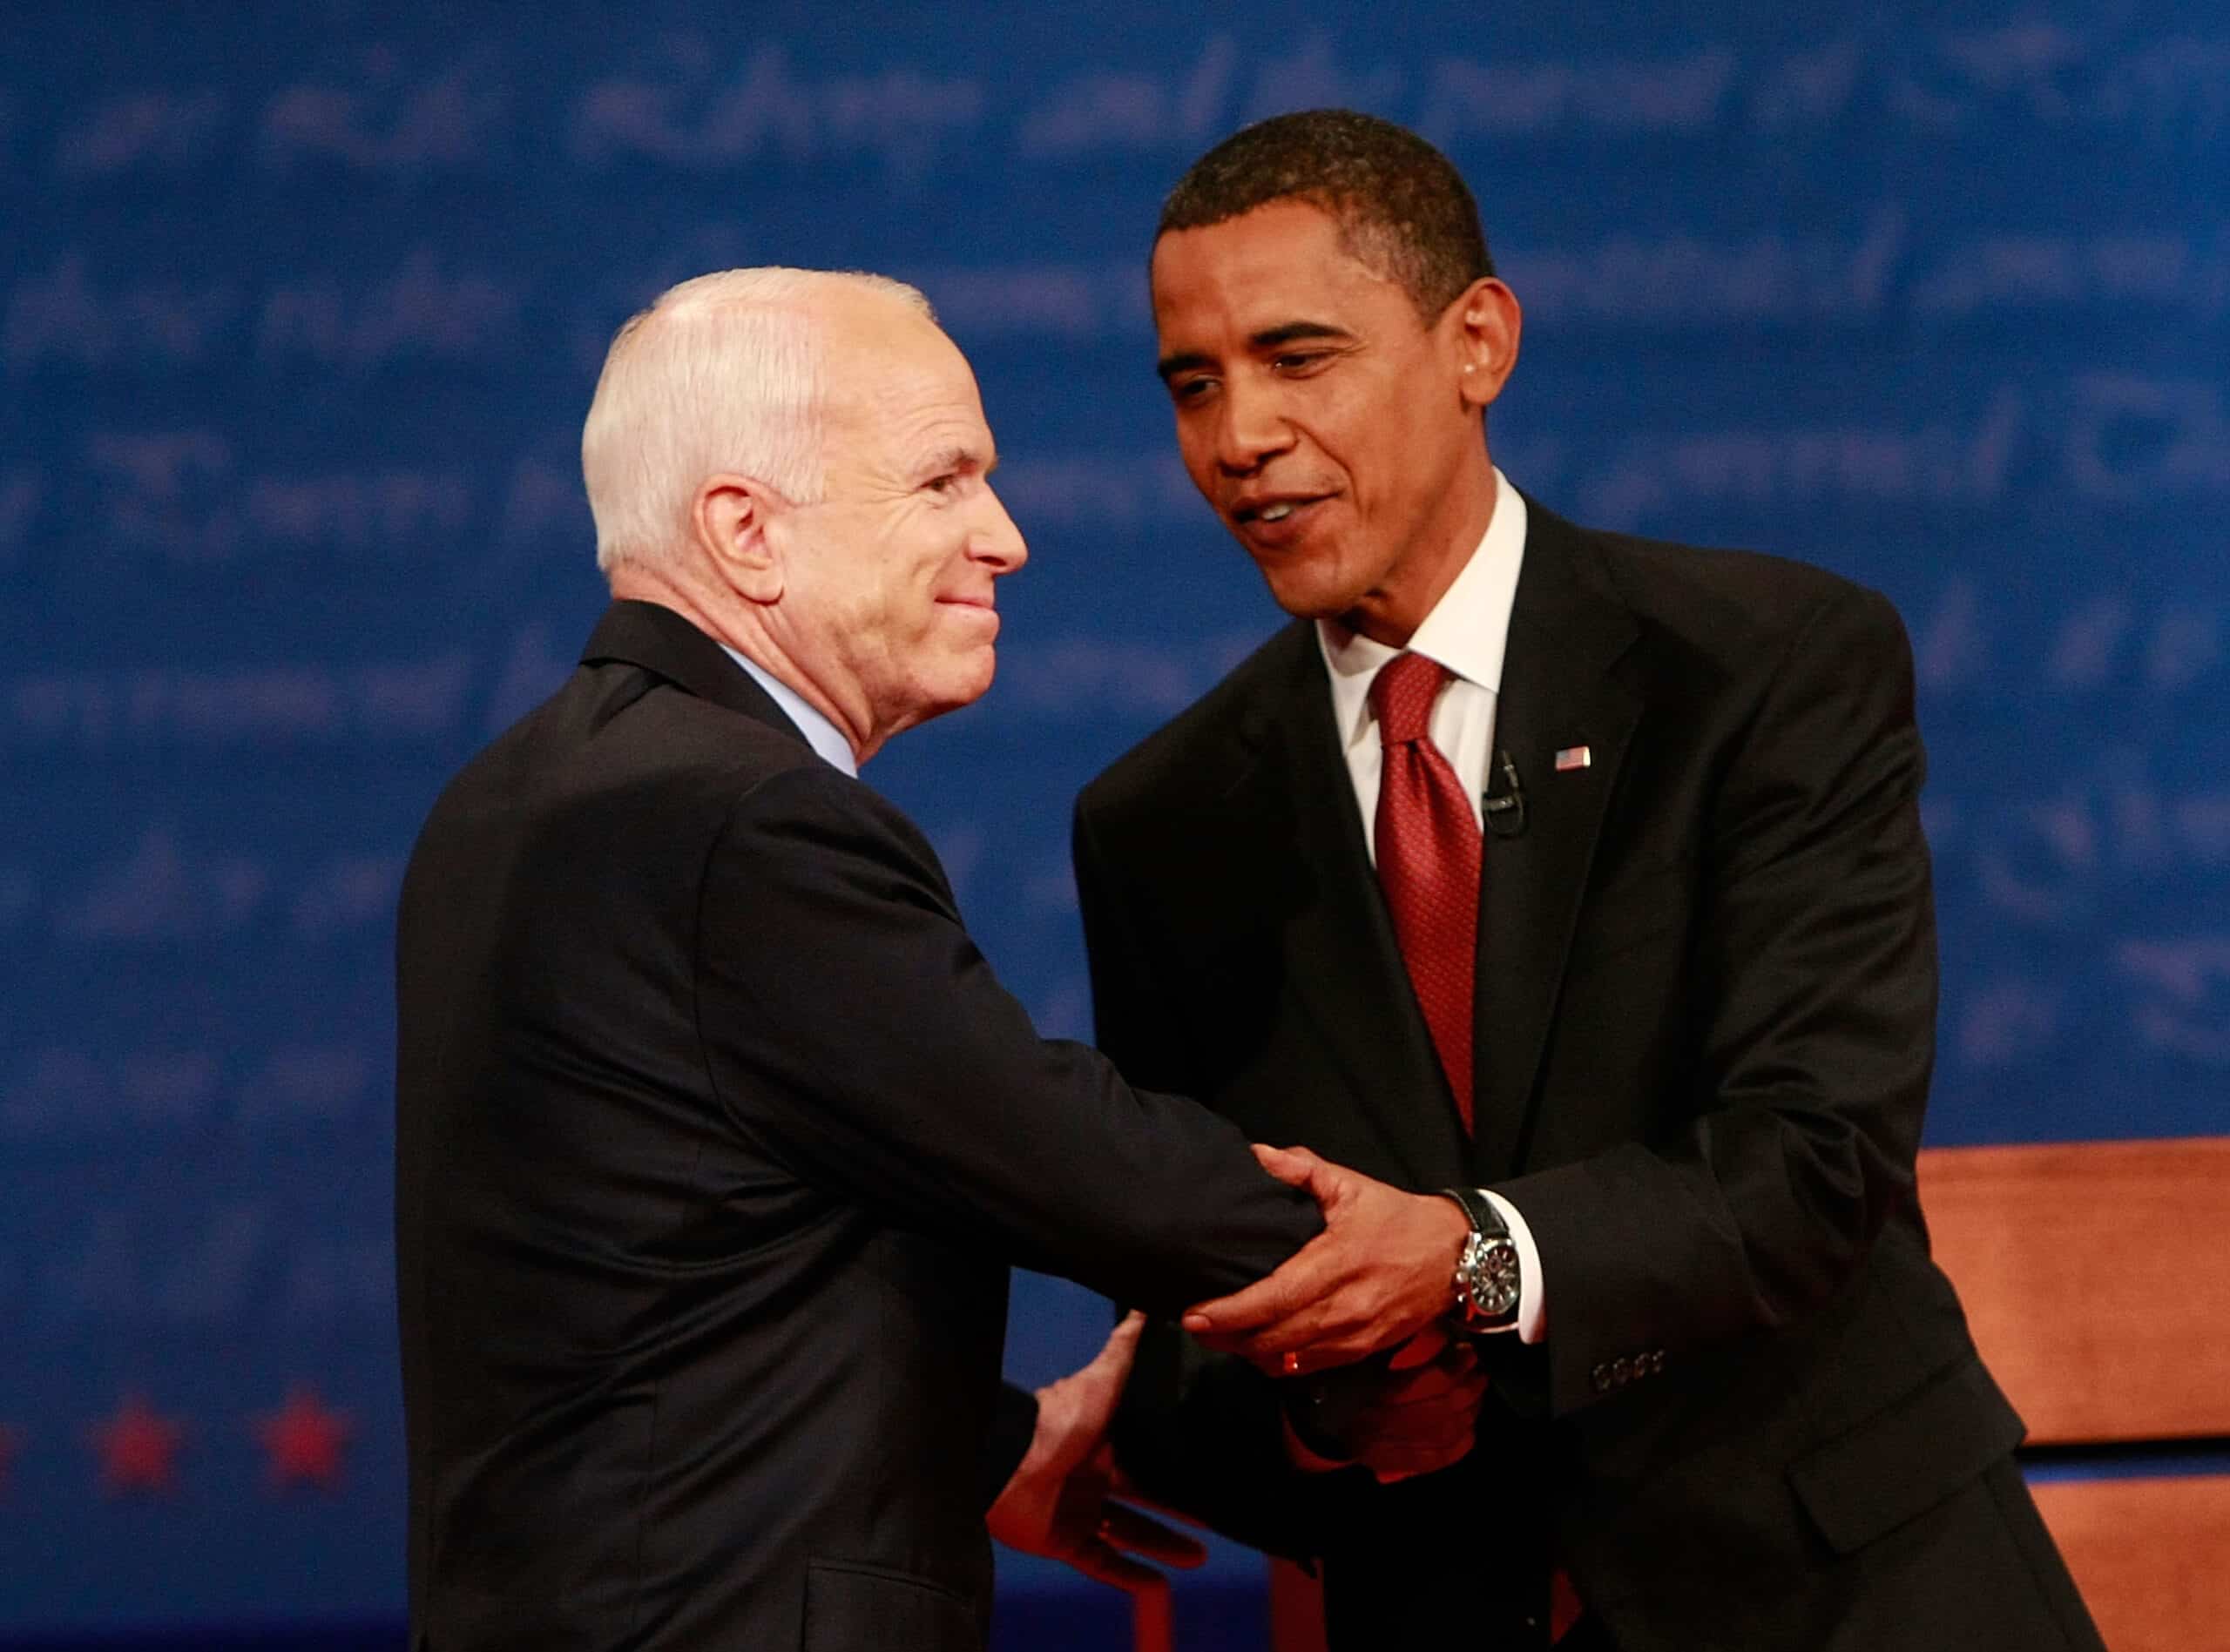
- National debt: $10.63 trillion (January 2009) to $19.94 trillion (January 2017)
- Change between snapshots: Approximately +$9.32 trillion (+87.7%)
- Political party: Democratic
Barack Obama entered office in January 2009, when the United States was experiencing its worst economic downturn since the Great Depression. The financial crisis had begun during the previous administration, and several major federal rescue measures were already underway. Obama’s administration responded with additional economic stimulus, assistance to struggling industries, and policies intended to stabilize financial markets and support employment.
During the early years of his presidency, federal deficits were especially large as tax revenue weakened and spending on unemployment assistance, recovery programs, and existing government commitments increased. As the economy recovered, annual deficits generally declined from their recession-era peaks, but the government continued borrowing, and interest accumulated on outstanding obligations.
The national debt rose by approximately $9.3 trillion between Obama’s inauguration and the end of his second term. That increase reflected not only new policy decisions but also the financial crisis, longstanding spending commitments, demographic changes, and tax laws inherited from earlier administrations. It also demonstrated an important point about federal finances: reducing the annual deficit is not the same thing as reducing the national debt. As long as the government continues borrowing more than it repays, the total generally keeps climbing, even when yearly deficits become smaller.
Donald Trump, First Term (2017–2021)

- National debt: $19.95 trillion (January 2017) to $27.75 trillion (January 2021)
- Change between snapshots: Approximately +$7.81 trillion (+39.1%)
- Political party: Republican
Trump’s first administration enacted the Tax Cuts and Jobs Act of 2017, which reduced corporate and individual income taxes and contributed to projected federal deficits. Borrowing increased before the COVID-19 pandemic, but the public health emergency dramatically accelerated the trend in 2020. Congress approved major bipartisan relief packages as businesses closed, unemployment rose, and federal revenue came under pressure. The debt reached nearly $27.8 trillion by January 2021, reflecting both pre-pandemic fiscal policies and the extraordinary economic response to COVID-19.
Joe Biden (2021–2025)
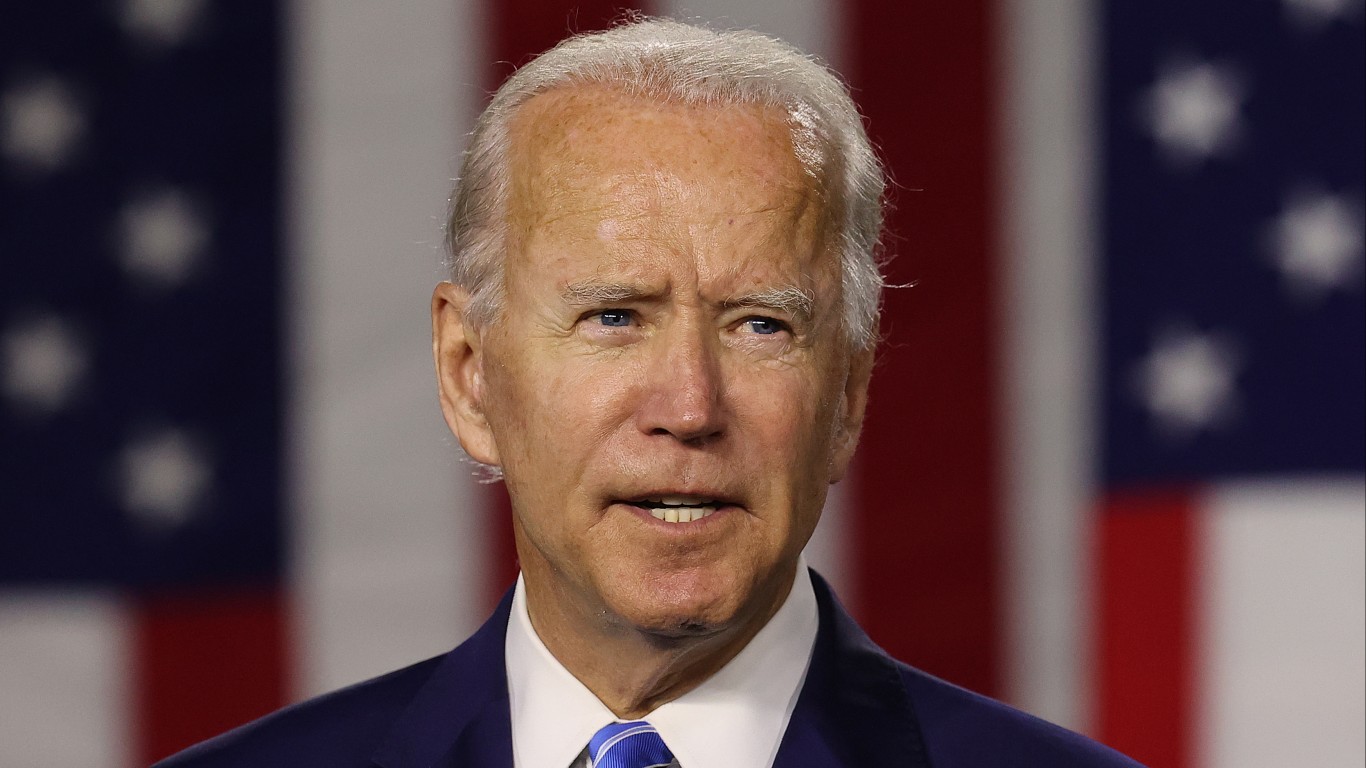
- National debt: $27.75 trillion (January 2021) to approximately $36.21 trillion (January 2025)
- Change between snapshots: Approximately +$8.45 trillion (+30.5%)
- Political party: Democratic
Biden entered office while the country was still dealing with the economic effects of the COVID-19 pandemic. His administration signed the American Rescue Plan in 2021, followed by major infrastructure, semiconductor manufacturing, and energy-related legislation. Federal borrowing continued as the government financed ongoing commitments and faced significantly higher interest costs. Although pandemic-related emergency spending declined, annual deficits remained substantial. Debt stood at approximately $36.2 trillion near the end of Biden’s term in January 2025. That is the appropriate presidential transition comparison, rather than attributing the entire debt increase through fiscal 2025 to Biden after he had left office.
Donald Trump, Second Term (2025–Present)
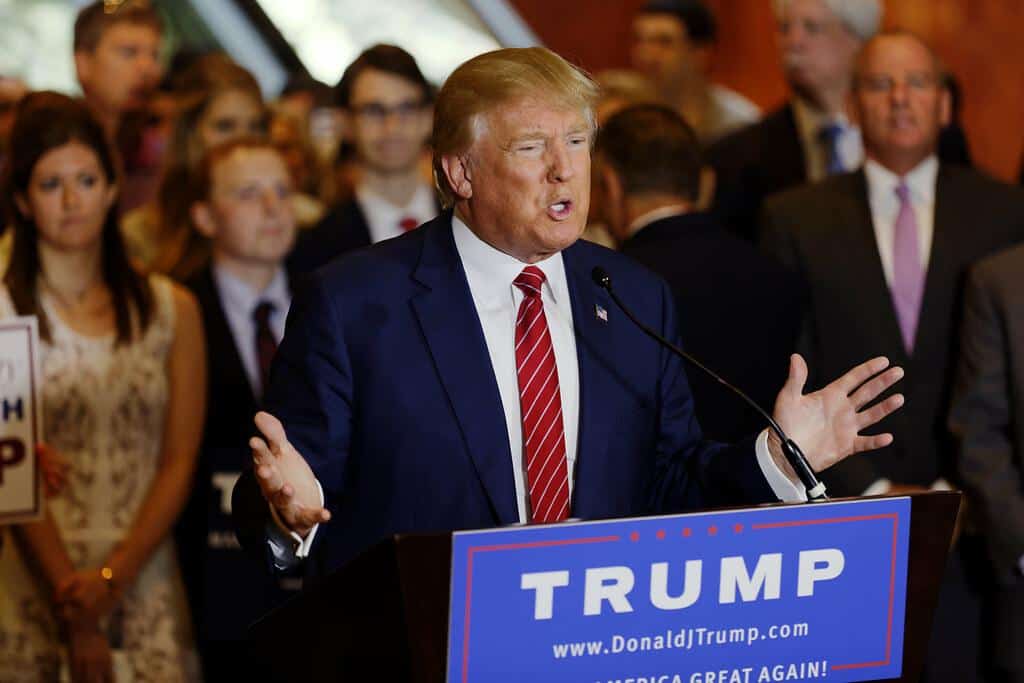
- National debt at the beginning of the term: Approximately $36.22 trillion (January 2025)
- National debt at the end of fiscal 2026: Approximately $40.17 trillion
- Latest reported national debt: Approximately $40.59 trillion (October 29, 2026)
- Political party: Republican
Trump returned to the White House in January 2025 with federal debt already exceeding $36 trillion. His second administration has pursued significant changes to tax, spending, and trade policy, while the federal government has continued to face substantial obligations from existing programs and interest on accumulated borrowing. Legislation enacted in July 2025 also increased the statutory debt ceiling by $5 trillion, although raising that borrowing limit does not itself create new spending.
The federal deficit reached approximately $1.99 trillion in fiscal 2026, according to Treasury figures, as federal spending continued to exceed revenue. Total national debt reached $40.17 trillion by September 30, 2026, and approximately $40.59 trillion by October 29. Those figures represent a substantial increase from the beginning of Trump’s second term, but the administration remains ongoing, and the financial effects of individual policies will continue to unfold. As with previous presidents, the full picture includes decisions made by Congress, inherited obligations, economic conditions, and the cost of servicing debt already accumulated.
What the History of the National Debt Tells Us
Looking across more than a century of presidential administrations, a few patterns are hard to miss. Major wars and economic crises have repeatedly produced sharp increases in federal borrowing. Periods of strong economic growth have sometimes made debt easier to manage, even when the outstanding dollar amount continued rising. Tax policy, spending decisions, and interest costs have also shaped the country’s long-term financial position.
Perhaps the most important lesson is that national debt doesn’t begin or end with a single president. The federal government inherits obligations from previous administrations, and Congress plays a central role in determining both spending and revenue. Understanding the history means looking beyond a simple ranking and asking what drove the changes, how the economy was performing, and whether the debt was becoming more or less manageable relative to the nation’s ability to pay.
Sources: U.S. Treasury Historical Debt Outstanding; U.S. Treasury Debt to the Penny; Office of Management and Budget Historical Tables; Government Accountability Office Federal Debt and Debt Management; and Congressional Budget Office Monthly Budget Review, September 2026.
Contact [email protected] for any questions or corrections.