
Sometimes the best way to get a message out is visually. After all, there is an absolute media overload that occurs for many people who invest and for those who just watch the news. 24/7 Wall St. has created a weekly review of some of the best charts, tables, graphs and other images that should not be ignored by anyone who has their money in the stock market or bond market.
For the week of May 23, 2020, the coverage is not just a bunch of stock market charts. We have covered the expectations of the 2020 hurricane season, security laws being changed in Hong Kong, the price of oil, a look at gold versus silver and the domestic and global COVID-19 cases as of Friday. We have also addressed how Shopify Inc. (NYSE: SHOP) keeps defying gravity, identified what a $7 trillion Federal Reserve balance sheet looks like, what’s happening with jobless claims ahead of unemployment, and even looked at the notion of “Sell in May.”
A brief commentary has been provided on each, as has the source of each item featured. These have been grouped and formatted based on their sizes for each page rather than based on any ranked order. After all, every reader will have a different view on what is more important to them versus another person.
Enjoy your long Memorial Day weekend!
[nativounit]
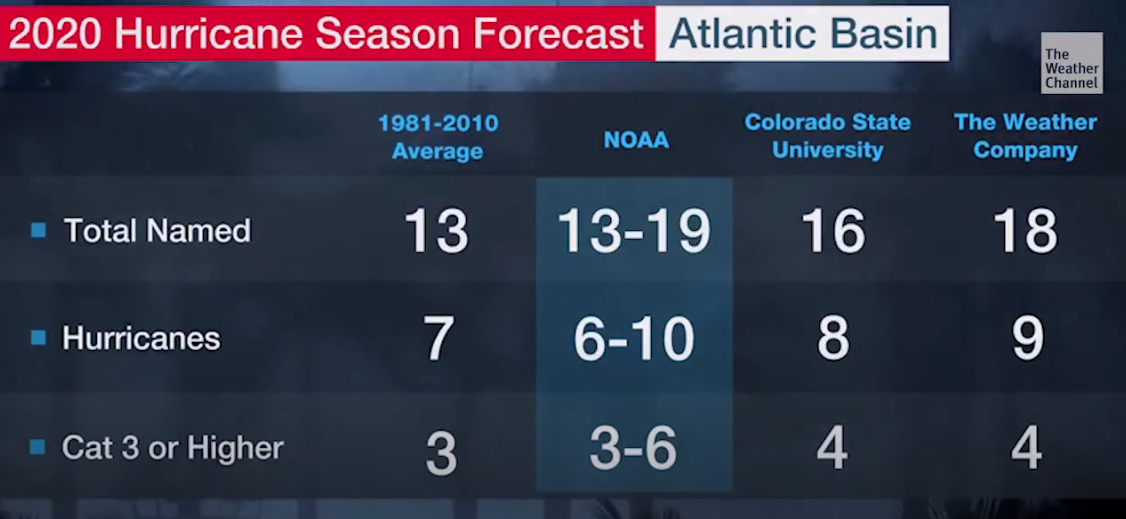
If you live in low-lying coastal areas or anywhere close to the coasts, 2020 is a year that you are likely going to have some closer eyes on the weather channels due to an active hurricane season. NOAA has released its range for hurricane season and its higher-end number of hurricanes was well above average, and it was higher than Colorado State University’s forecast and the forecast from The Weather Company. NOAA predicted 13 to 19 named storms. Of those, 6 to 10 were predicted to reach hurricane strength and of that number 3 to 6 were projected to be major hurricanes. And speaking of hurricane season, the first named storm was Tropical Storm Arthur on May 17 off the Eastern Seaboard.
Source: The Weather Channel
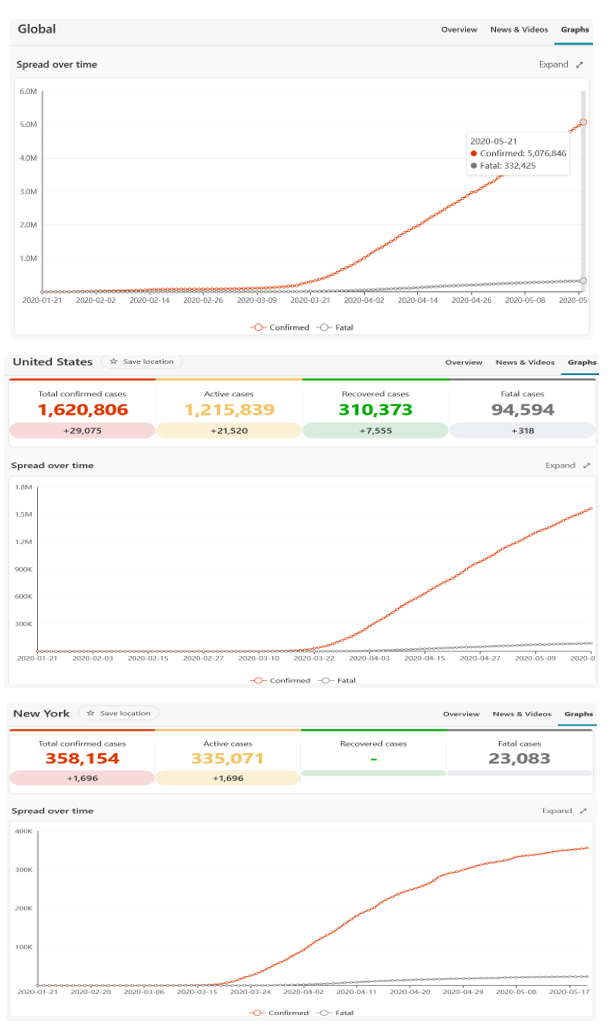
As COVID-19 cases neared 5.2 million globally, total U.S. cases were still on the rise and nearing 5.2 million as the curve has been flattening out in the hardest hit state of New York. Another lockdown has been reported in China due to a rise in cases, but the rapidly rising numbers in Russia and Brazil at more than 300,000 cases each was actually on the upswing.
Source: https://www.msn.com/en-us/news/coronavirus
More specific charts and graphs for the stock market, investing, and the economy are on the following pages.
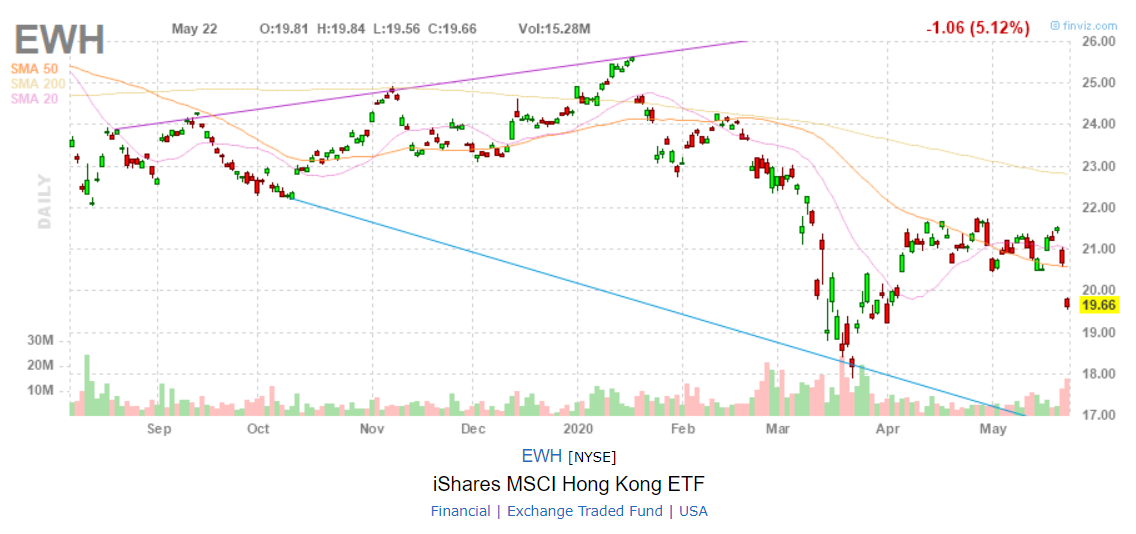
China is increasing its security laws in Hong Kong. The U.S. and Western news agencies point out how this can squash individual freedom and can be used to crush any dissent. The Chinese news agencies cheer it and point to Western (U.S.) interference. Let’s just say “Let the money vote show you if it is good or bad” and look at the market reaction. The Hang Seng Index fell by 5.56% and broke under a clear support line that had been building during all of April and May. The iShares MSCI Hong Kong ETF (NYSEArca: EWH) traded down 5.12% to $19.66 on double the normal trading volume, which also broke support and was the busiest trading day since the panic-selling climax in March.
Source: Finviz.com
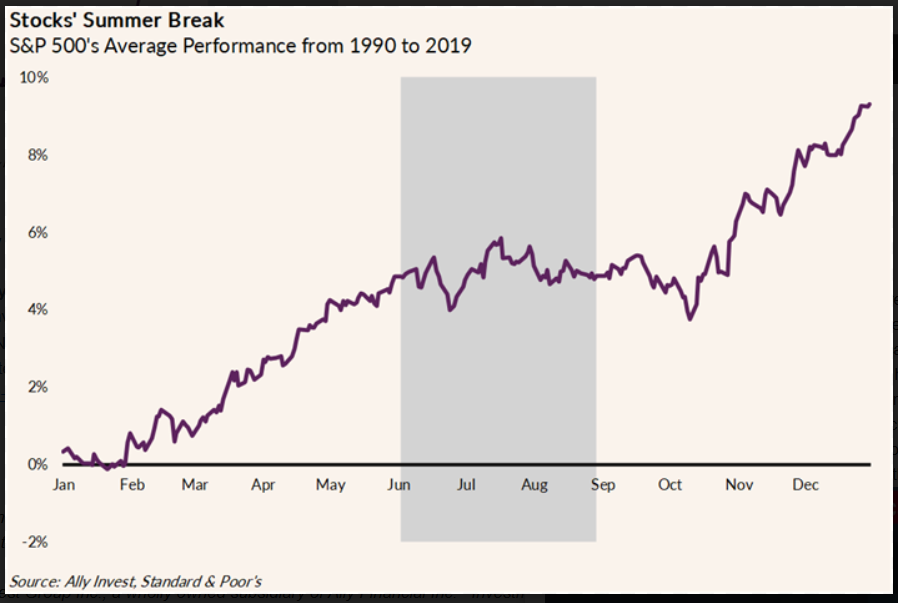
If you wonder about how and why the mantra of “Sell in May and Go Away!” comes up each and every year, it shouldn’t be interpreted as a “Sell Everything!” message. It simply means that typical investors are away in the “summer doldrums” either on vacations or taking time off. And to prove that it’s not a steadfast rule, this April did just have nearly a 1,000 point gain in the Dow in a single day and as of Friday the Dow, S&P 500 and NASDAQ were all positive for the month.
Source: Lindsey Bell, Ally Invest
[wallst_email_signup]
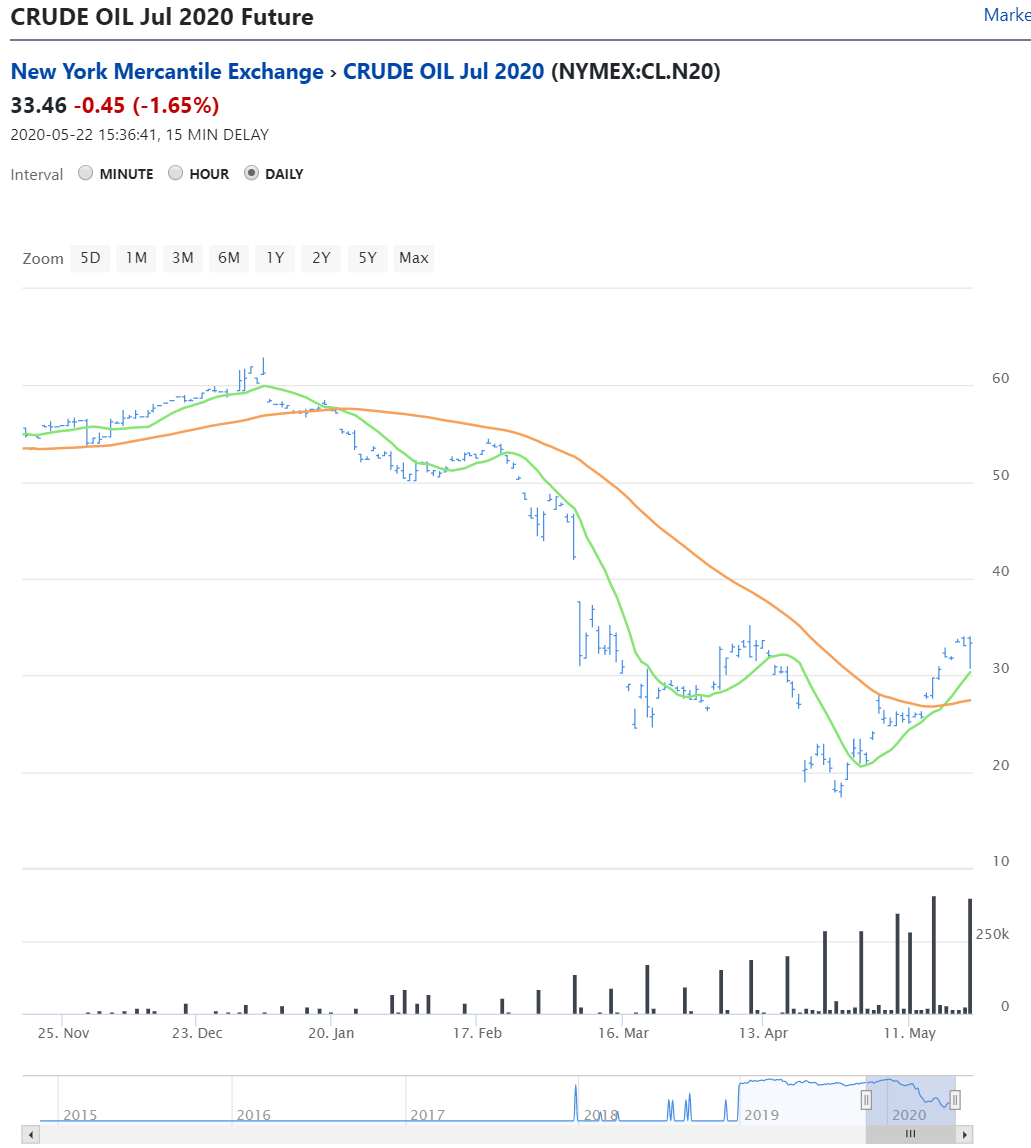
Oil may have sold off on Friday, but the hard reality is that the panic ended as the reopening of the economy took hold and consumers started buying gas again. NYMEX WTI crude was back above $30 in the July 2020 futures contract, far better than the sub-$20 seen in April and those negative contract prices heading into the May expiration. Oil barons probably aren’t full of enthusiasm and buying up everything they can buy, but the number of searches for “best career moves after my oil company went bankrupt” are probably way down.
Source: INO.com
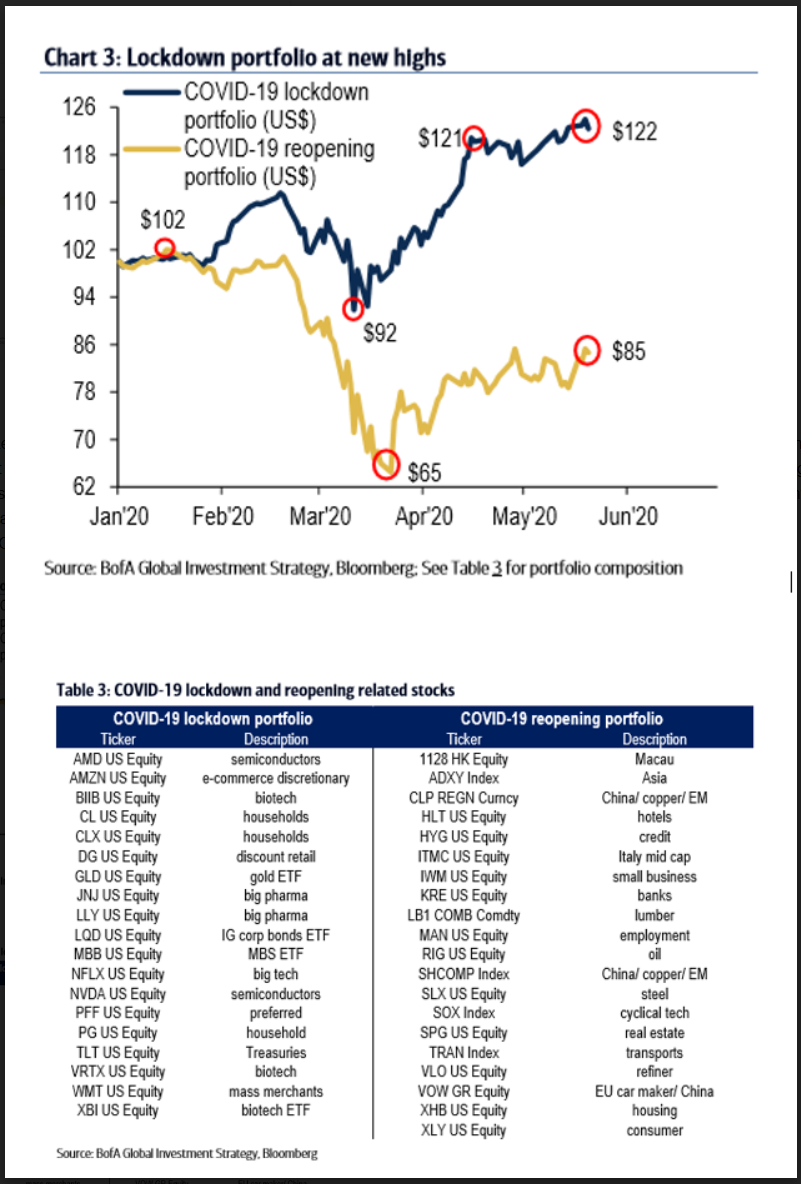
BofA Global Research has released its views on how the so-called “Lockdown” portfolio has performed versus the “Reopening” portfolio. With the reopening here, whether anyone likes it or not, the defensive plays from the COVID-19 panic look ready to let some of the basic economy stocks to get back in the game as there were 2215 out of 3042 global stocks still firmly in bear markets at -20% from all-time highs and the firm noted that the institutional and private client cash mountain has peaked after reaching more than $1 trillion and a slow rotation back into bonds and another week out of stocks.
Source: BofA Global Investment Strategy Research
[wallst_email_signup]
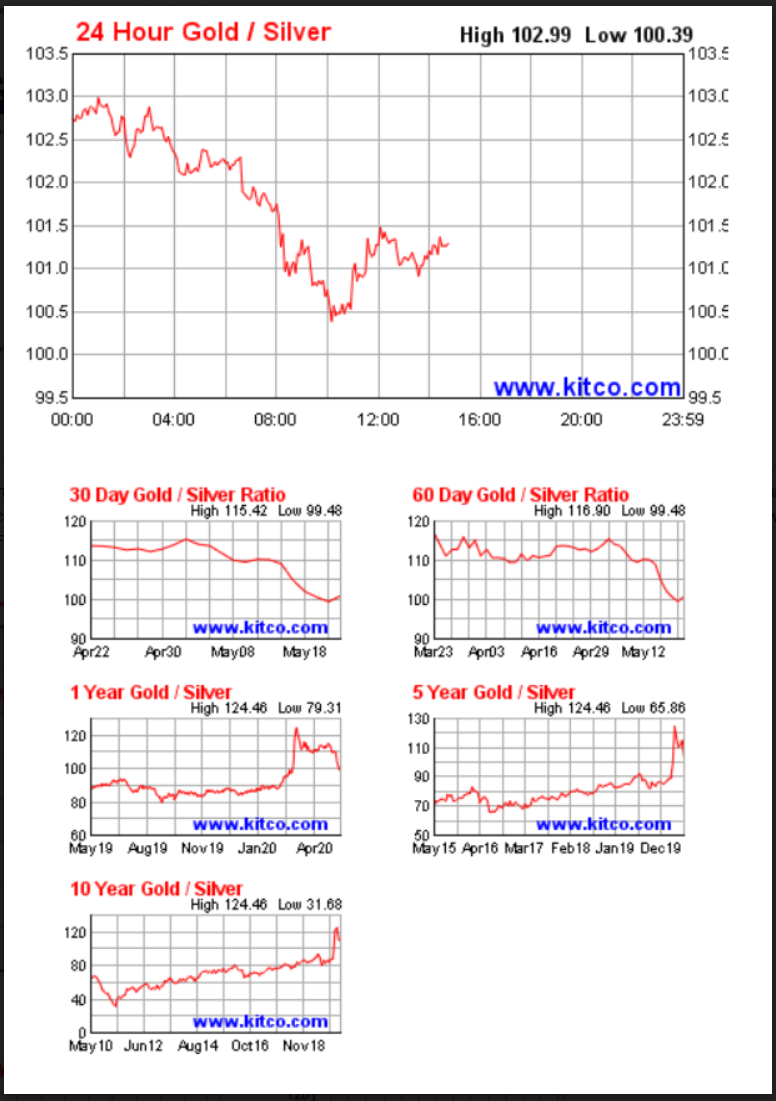
Gold is still king for central banks and for wealthy investors looking for the ultimate safe haven trade. Gold was still up 15.5% year-to-date versus a 4.3% loss for silver, but silver has been screaming back with a gain of over 12% week over week as of Wednesday (5/20) and it was up 45% on that same day from its lowest close in March. It was back up to $17.40 per ounce on Friday, and just take a look at the good old silver-to-gold ratio chart here. Just 1 ounce of gold was worth 124 ounces of silver at the peak of the chart in March, and on Friday that went back to 100 ounces.
Source: Kitco.com
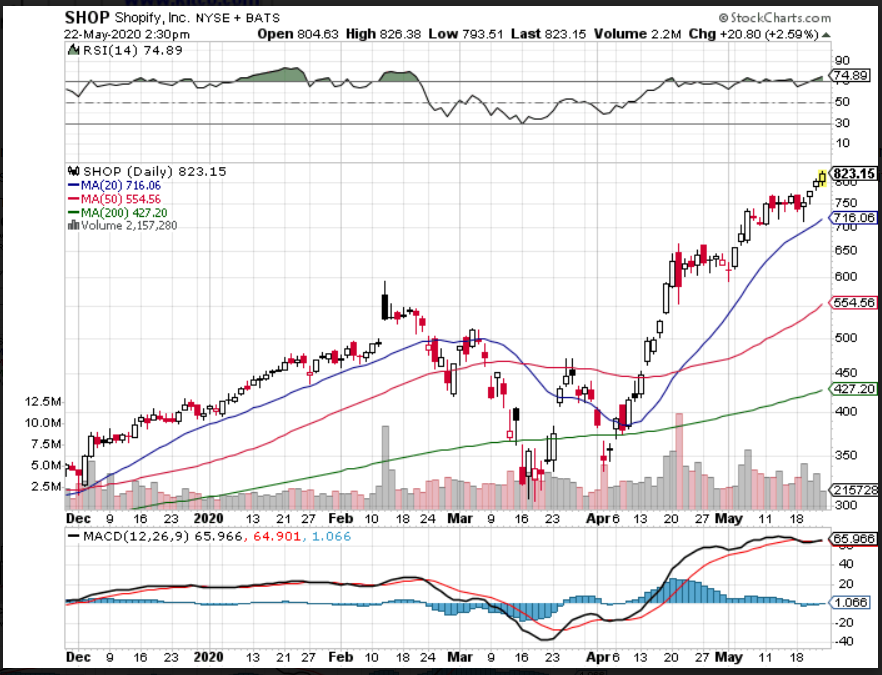
Shopify Inc. (NYSE: SHOP | SHOP Price Prediction) has managed to defy gravity and financial logic in its chart and performance. Now valued at 35-times 2021 expected revenues, now investors are going to see it also effectively become a bank or financial powerhouse for its endless merchants. You are on your own here, but it was up 100% year-to-date and up about 155% or so from its lowest close in mid-March.
Source: StockCharts.com
[wallst_email_signup]
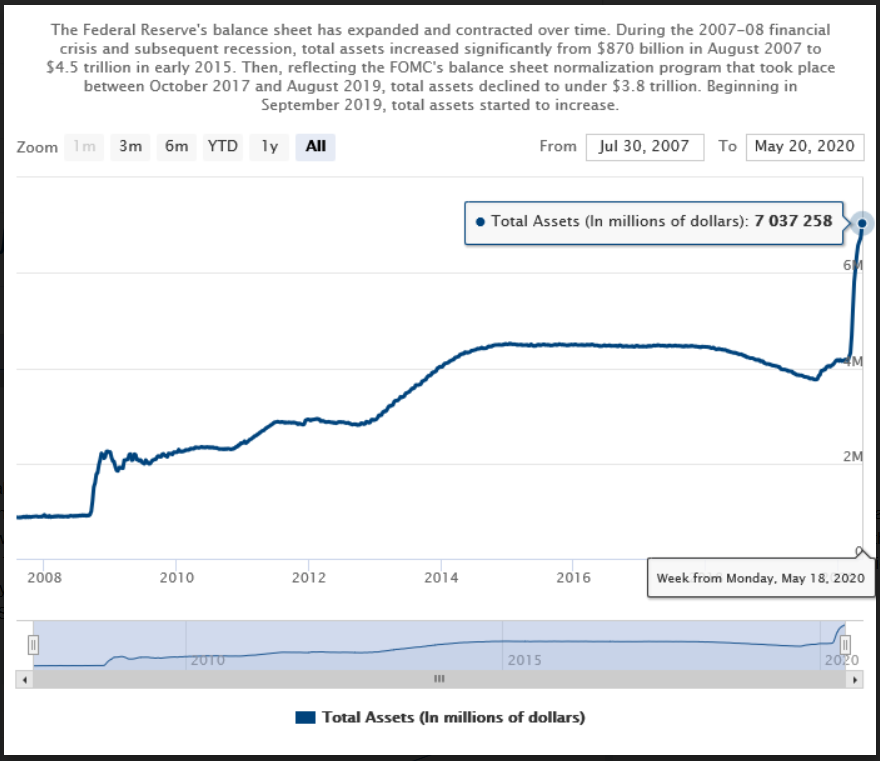
The United States quantitative easing efforts were already coming back into play before China’s economy started to go into lock-down in Wuhan, but since the U.S. cut rates to zero and announced its stimulus the Federal Reserve’s balance sheet has swelled (sorry, exploded) to $7.03 trillion as of May 20. This chart goes back to mid-2007 to show where it had been and how two recessions have made the Federal Reserve the most dominant force in the bond market.
Source: FederalReserve.gov
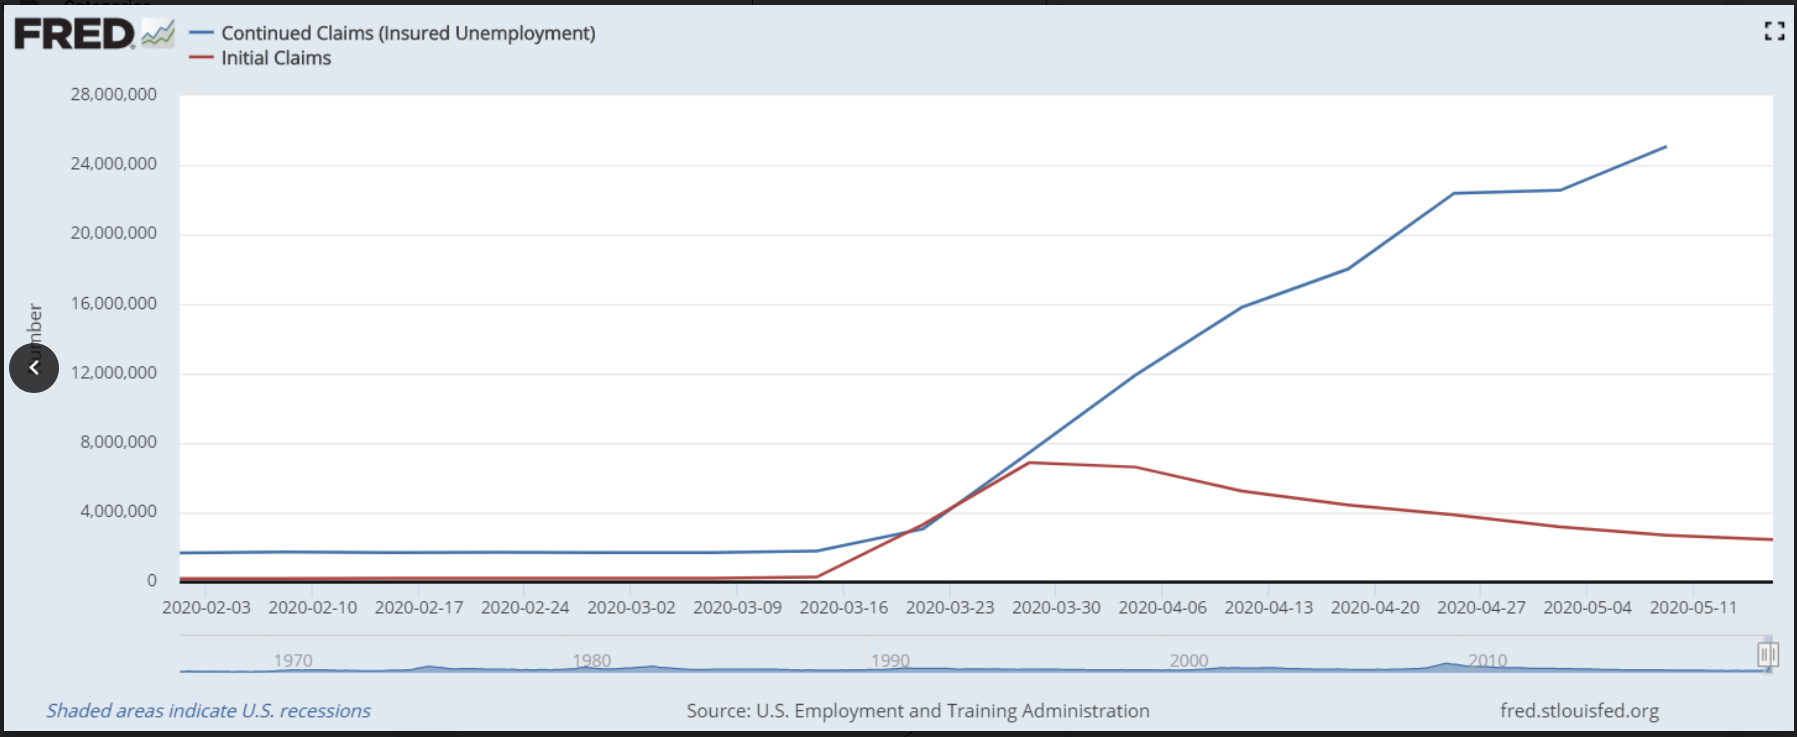
The initial weekly jobless claims from the U.S. Department of Labor have now reached a total of 38 million since the coronavirus turned into the COVID-19 pandemic driven recession. We all know the job market is atrocious now, but after peaking at 6.87 million for the last week of March the weekly claims have come down every single week and were down to 2.44 million for the week ending May 16. This is good news as businesses have received their PPP funds and as the economy is still early on in the reopening process. The bad news is that the army of the unemployed measured by the continuing jobless claims was just above 25.07 million people taking benefits for more than one-week as of May 9.
Source: St. Louis Fed (FRED)
[wallst_email_signup]
Contact [email protected] for any questions or corrections.