I want to be clear about something right away. Many great companies have started by losing massive amounts of money, or have been born in bubble-like environments and then go to thrive even after the bubble pops.
Quantum Computing Inc. (NASDAQ: QUBT) may certainly be one of those companies. But make no mistake. Investing in it right now is close to thematic gambling. And depending on the specific day you bought the stock, that gamble might have worked out for you.
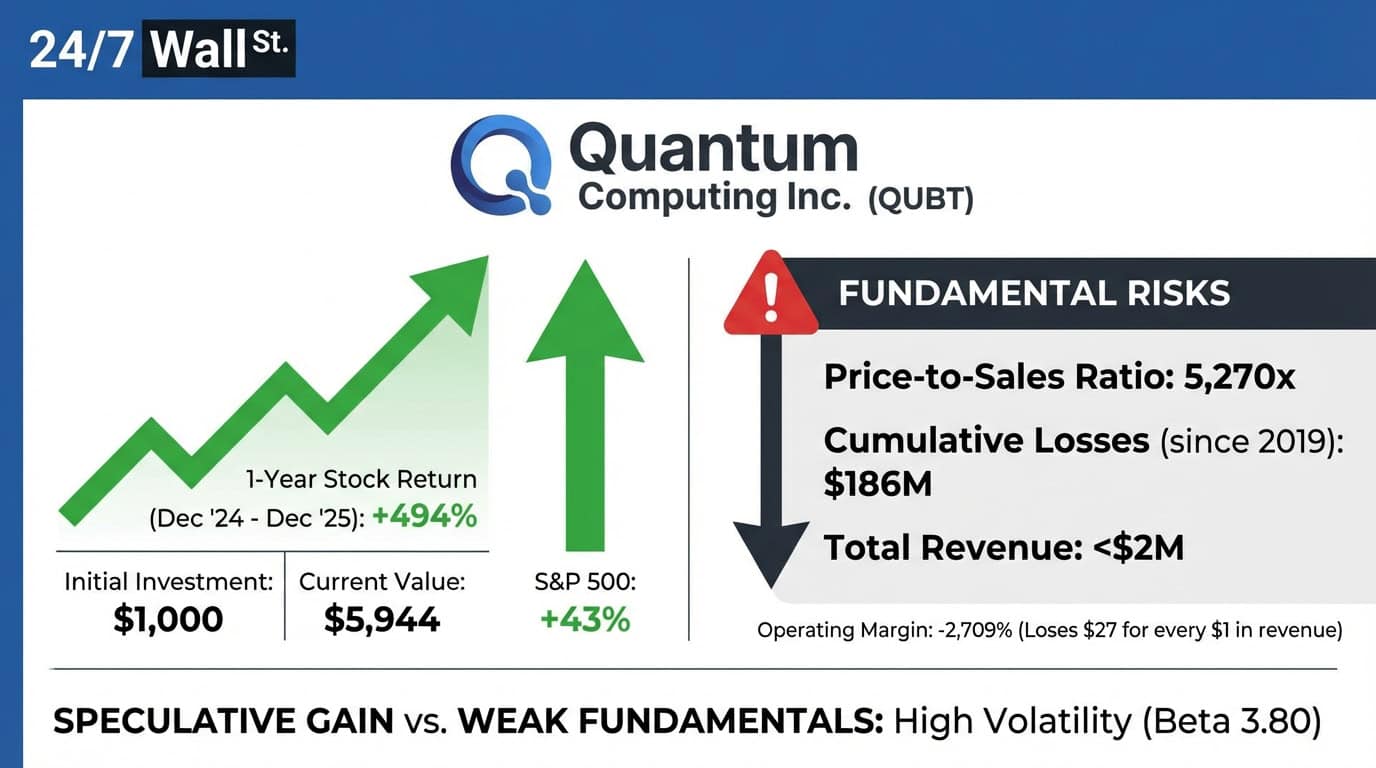
A 494% Gain Built on Almost Nothing
Here is what happened if you put $1,000 into QUBT roughly one year ago.
1-Year Return (Dec 2024 – Dec 2025)
- Initial Investment: $1,000
- Current Value: $5,944
- Total Return: 494%
- S&P 500 (same period): $1,428 (43%)
You would have turned $1,000 into nearly $6,000. The S&P 500 gained 43% over the same stretch, meaning QUBT outperformed the market by 451 percentage points. That sounds incredible until you look at what is underneath.
Quantum Computing Inc. generated $546,000 in trailing revenue while carrying a market cap of $2.88 billion. That puts the price-to-sales ratio at 5,270x. The company would need to grow revenue by more than 5,000 times just to justify a normal 1x sales valuation. It has burned through roughly $186 million in cumulative losses since 2019 while generating less than $2 million in total revenue. The operating margin sits at negative 2,709%, meaning it loses $27 for every $1 it brings in.
The recent rally was not driven by fundamentals. It was driven by speculation on quantum computing as a sector, retail trading volume that spiked to 71 million shares in a single day, and an earnings surprise in Q3 2025 that flipped expectations. The company posted $0.01 in earnings per share against estimates of a $0.06 loss, a 117% beat. One quarter earlier, it had missed by 333%. The quarter before that, it beat. The quarter before that, it missed by 844%.
This is not a business with predictable cash flows. It is a speculation vehicle.
The Timing Problem
If you bought QUBT at its October peak of $18.74, you are down 31% today at $12.84. If you bought at the November low of $10.27, you are up 25%. The stock has a beta of 3.80, meaning it moves nearly four times as much as the broader market.
Key Risk Factors to Consider
The company has not demonstrated a clear path to profitability with scaling revenue. Performance has been inconsistent, with quarterly earnings swinging from an 844% miss to a 117% beat. The $2.88 billion market cap is built on $546,000 in revenue and expectations about quantum computing solving problems that may be a decade away.
The valuation reflects future hopes rather than current fundamentals. The recent 494% gain was retail-driven speculation, not institutional revaluation based on business performance. There was zero mainstream financial news coverage of QUBT despite its surge, indicating this was a social media phenomenon rather than a fundamental shift in the company’s prospects.
The past year rewarded risk takers. The next year might not.
Contact [email protected] for any questions or corrections.