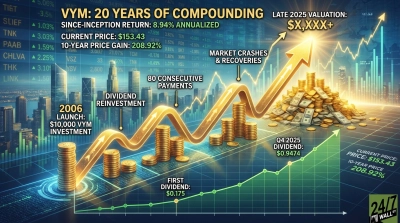
Invest $10,000 in VTI today and here’s what the numbers say it could be worth by 2036 — history already answered this question for the last decade. $10,000 invested in VTI ten years ago grew to over $38,000 today, with dividends reinvested. That’s a quadrupling of capital from a single fund that requires no stock-picking, no market timing, and no management decisions beyond the initial purchase.
That result reflects a 10-year annualized total return of 14.25% — one of the strongest decades in U.S. equity history, driven by a prolonged bull market, low interest rates, and the explosive growth of large-cap technology. VTI’s top three holdings — Apple at 6.29%, Nvidia at 6.21%, and Microsoft at 5.56% — were central to that run.
Two Scenarios, One Framework
For a retirement-focused investor putting $10,000 into VTI today, two historically grounded scenarios are worth understanding — not as promises, but as reference points.
The aggressive scenario uses the 14.25% 10-year annualized return. This reflects the last decade’s actual performance. If the next ten years matched it, $10,000 would again approach the $40,000 range. But this rate is elevated by an unusually favorable period, and assuming its continuation requires optimism about sustained tech dominance and economic expansion.
The conservative scenario uses VTI’s since-inception annualized return of 9.25%, covering the fund’s full history since its 2001 launch. This rate spans the dot-com crash, the Great Recession, the 2020 pandemic selloff, and the 2022 bear market. It’s a rate that has already survived the worst the market has delivered in a generation. At 9.25% annually over a decade, $10,000 grows meaningfully — though not to $40,000. It’s the number that reflects what the full market cycle, not just the good years, actually delivers.
The gap between these two scenarios is the honest tension every long-term investor faces: recent history looks extraordinary; full history looks durable.
Why the Rate Is Defensible
VTI tracks the CRSP US Total Market Index, covering approximately 100% of the investable U.S. stock market across large-, mid-, small-, and micro-cap stocks. With 3,525 holdings, no single company failure can meaningfully damage the fund. The 0.03% expense ratio — recently reinforced by Vanguard’s February 2026 fee cuts across 53 funds — means nearly every dollar of return reaches the investor. At $2.1 trillion in assets, VTI carries deep liquidity and institutional permanence.
The 1.08% dividend yield also compounds quietly in the background — a component that accounted for a meaningful portion of the $40,310 outcome over the last decade when reinvested.
The Biggest Risk to the Math
The primary threat is valuation. The last decade’s 14.25% CAGR was partly a function of expanding price-to-earnings multiples — investors paying more for each dollar of earnings over time. If multiples contract over the next decade, returns revert closer to earnings growth alone, compressing outcomes significantly. With the 10-year Treasury yield at 3.97%, bonds now offer a more competitive alternative than they did for most of the last decade, which adds pressure on equity valuations.
The Investor Takeaway
VTI’s track record is real, not theoretical. The $38,000 and change outcome from a $10,000 investment a decade ago is verified history. The forward path — whether it resembles the aggressive 14.25% scenario or the more tempered 9.25% since-inception rate — depends on conditions no one can fully predict. What history does confirm is that VTI has absorbed every major crisis since 2001 and still compounded. For a retirement investor with a 10-plus year horizon, that durability is the core of the case.
Contact [email protected] for any questions or corrections.