Nvidia vs. AMD: Which Stock Will Outperform The Market In 2026
Tech giant Nvidia (NASDAQ:NVDA | NVDA Price Prediction) and AMD (NASDAQ:AMD) both delivered powerful earnings beats in early 2026, yet are running fundamentally different races. The question for investors is which architecture, business mix, and growth trajectory wins this year.Blackwell…

Tech giant Nvidia (NASDAQ:NVDA | NVDA Price Prediction) and AMD (NASDAQ:AMD) both delivered powerful earnings beats in early 2026, yet are running fundamentally different races. The question for investors is which architecture, business mix, and growth trajectory wins this year.
Blackwell Dominates. EPYC Earns Its Moment.
Nvidia’s Q4 FY2026 revenue reached $68.13 billion, up 73.2% year-over-year, powered almost entirely by AI infrastructure spending.
Data Center revenue alone came in at $62.31 billion, a 75% gain, with the Blackwell architecture driving hyperscaler and enterprise deployments. Networking revenue Data Center Networking surged 263% year-over-year to $10.98 billion, reflecting rapid adoption of NVLink fabric for GB200 and GB300 systems.
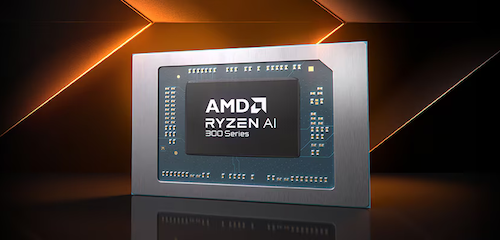
AMD’s story is smaller but impressive. Q4 2025 revenue hit $10.27 billion, up 34.1% year-over-year, with Data Center revenue reaching a record $5.38 billion, up 39%. EPYC server CPUs and Instinct GPU shipments both contributed. The Client segment set a record at $3.10 billion, up 34%, driven by Ryzen AI processor demand.
One note: the reported non-GAAP gross margin of 57% includes a $360 million MI308 inventory charge release, making the underlying margin lower when excluding the charge.
| Business Driver | Nvidia (Q4 FY2026) | AMD (Q4 2025) |
|---|---|---|
| Total Revenue | $68.13B (+73.2% YoY) | $10.27B (+34.1% YoY) |
| Data Center Share of Revenue | ~91% | ~52% |
| Non-GAAP Gross Margin | 75.2% | ~55% (underlying) |
| Non-GAAP EPS Beat | $1.62 vs. $1.52 est., beating expectations | $1.53 vs. $1.32 est., beating expectations |
| Free Cash Flow | $34.90B | $2.08B (record) |
Full-Stack Platform vs. Hardware Challenger
Nvidia’s advantage runs deeper than GPU performance. Its full-stack approach covering hardware, NVLink networking, CUDA software, and expanding partnerships creates switching costs AMD cannot replicate today.
Huang announced the Rubin platform, which promises up to a 10x reduction in inference token cost versus Blackwell. Strategic commitments with Meta, CoreWeave, and OpenAI span gigawatt-scale deployments through 2030. That pipeline is difficult to displace.
AMD’s path offers diversification. EPYC takes server CPU share from Intel, the Instinct MI350 is ramping, and the Helios rack-scale platform targets yotta-scale AI infrastructure. A partnership with OpenAI, Oracle, and HUMAIN signals AMD is landing serious enterprise commitments AMD carries less concentration risk: Client, Gaming, and Embedded segments provide a cushion Nvidia lacks.
Both face China export headwinds. Nvidia’s Q1 FY2027 guidance of $78.0 billion explicitly excludes China Data Center compute, while AMD’s Q1 2026 guidance of $9.8 billion includes only $100 million of MI308 China sales.
The Next Test: Can AMD Close the Margin Gap?
AMD’s gross margin trajectory matters. The underlying 55% figure needs to expand as Instinct GPU mix improves and Helios scales. Nvidia’s 75.2% non-GAAP gross margin reflects platform pricing power AMD has not matched in AI accelerators.
On valuation, Nvidia is down 5.95% since its February 25 earnings release, while AMD is down 2.26% since its February 3 report. Both lag the broader market’s year-to-date move of -0.29% for SPY, though AMD’s year-to-date gain of 10.5% exceeds both Nvidia’s year-to-date decline of -1.38% and the S&P 500.


Why AMD Offers Better Risk-Reward for 2026
Nvidia remains the dominant AI infrastructure platform. The analyst community agrees: 60 buy ratings versus 1 sell, with a consensus target of $268.22. But at a P/E of 36x and current price of $183.91, much near-term upside appears priced in. The $4.5 billion inventory charge in the 10-K has introduced retail uncertainty.
AMD trades at a P/E of 88x with current price of $236.64 and 37 buy ratings and no sell ratings. That valuation demands execution, which Su has delivered consistently.
AMD’s diversified product mix, CPU market share gains, and accelerating GPU partnerships present a different risk profile heading into 2026. China export restriction developments and Rubin deployment timelines remain key variables to watch for both stocks.
Contact [email protected] for any questions or corrections.
Vandita Jadeja is a financial copywriter who loves to read and write about stocks. She believes in buying and holding for long term gains. Her knowledge of words and numbers helps her write clear stock analysis. She has contributed to several publications, including the Joy Wallet, Benzinga, The Motley Fool and InvestorPlace.