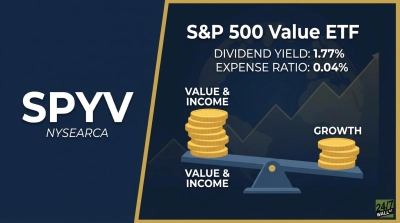
State Street offers investors a clean factor split of the S&P 500 through the SPDR Portfolio S&P 500 Value ETF (NYSEARCA:SPYV) and the SPDR Portfolio S&P 500 Growth ETF (NYSEARCA:SPYG). Same issuer, same parent index, opposite factor tilts. The gap between them right now is the story: SPYG is up 10.29% year to date while SPYV has returned 6.4%. Despite a steady drumbeat about value rotation, growth is still winning this cycle.
What each fund is actually betting on
S&P’s style methodology sorts the parent index using three value signals (book-to-price, earnings-to-price, sales-to-price) and three growth signals (sales growth, earnings change, momentum). Stocks scoring strongly on both sides get split proportionally across the two indexes, which is why SPYV’s largest holding is Apple at 6.9%, followed by Amazon at 3.54%. That single mechanic matters: a reader who assumes SPYV is a pure deep-value fund is wrong. It owns the cheaper sleeve of mega-caps alongside traditional value names.
The implicit bets diverge at the sector layer. SPYV leans on Financials at 15.6%, Health Care at 12.32%, Industrials at 11.36%, and Energy at 8.32%, a profile that needs a steeper yield curve, sticky inflation, or cyclical earnings expansion to outperform. SPYG concentrates in technology and communication services and needs the opposite: disinflation, falling real rates, and durable AI capex.
Where the difference shows up
Stretch the window and the growth bet has paid better. Over five years, SPYG returned 111.91% against SPYV’s 68.06%. Over ten years, the spread widens to 429.13% versus 212.84%. The trailing 12 months tell the same story, with SPYG up 35.38% against SPYV’s 20.22%.
The practical comparison
| Metric | SPYV | SPYG |
|---|---|---|
| Expense ratio | 0.04% | 0.04% |
| Dividend yield | 1.93% | ~0.6% |
| YTD 2026 return | 6.4% | 10.29% |
| Largest sector | Info Tech 16.6% | Info Tech (dominant) |
Cost is a non-factor. Both clip four basis points. What the investor actually chooses between is income and cyclicality on one side versus capital appreciation and concentration on the other.
The verdict
SPYG fits the investor who believes the AI capex cycle, margin expansion in software, and eventual rate cuts still have room to run, and who can tolerate sharper drawdowns when growth multiples compress. SPYV fits the investor prioritizing current income near 2%, cyclical exposure to energy and financials, and a smoother ride when long rates rise. The recommendation flips the day the 10-year yield breaks decisively higher or credit spreads widen sharply. Until then, the YTD spread is doing the talking.
Contact [email protected] for any questions or corrections.